

 Download:


-
It is essential to recognize that coronavirus disease 2019 (COVID-19) presents unique characteristics, including asymptomatic predominance (1), asymptomatic transmissibility (2), and reinfection/recurrent infection (3), which contribute to undetectable transmission and unforeseen risks. Consequently, it is crucial to effectively and accurately assess the risk of death for both populations and individuals in order to appropriately allocate health resources and take optimal preventive measures. However, an ideal assessment tool for this purpose remains unavailable at this time.
Several key factors including age (4), underlying diseases (4), vaccination history (5), and frailty (6) were identified as the primary factors that contribute to COVID-19-related fatalities. Notedly, underlying diseases, aging, and frailty often overlap in certain populations. Hence, understanding their interrelationship with COVID-19 mortality is crucial for predicting and assessing the risk of death.
This study analyzed clinical data and examined the associations among age, comorbidities, frailty, and vaccination history with COVID-19 mortality to create a straightforward mathematical model. Subsequently, we developed a forecasting software for population-level assessment and a web-based tool for individual risk evaluation. Our innovative tools provide reliable support for decision-making.
-
Collected and Analyzed Clinical Data: Clinical data from approximately 100 million cases were collected through a comprehensive literature search using international databases and statistically analyzed. See Supplementary Material for details of collection and analysis.
Development of the Locally Run Software SEIP-RA: Initially, we developed the K-SEIR-Sim software (7), followed by its enhancement through the creation of the SEIR-AS software (2). Here, we designed an improved software, SEIP-RA, which focuses on pinpointing high-risk populations. Our risk prediction formula is incorporated into the software, allowing for corresponding recalculation of necessary results. The software is programmed in Python, with detailed formulas and parameters designed as described in
Supplementary Table S1 . The software can be freely downloaded for noncommercial use (http://peiyun.cn/download/seir_sim.files/SEIR-RA%202.64.exe ).Developed the Remotely Run Simple Tool COVID-RA: We developed a scale to assess individual risk of death by considering all critical factors contributing to mortality. This scale employs 6 questions and 14 answer choices to evaluate risk through a question-answer-score system (
Supplementary Table S2 ). The evaluation outcomes were categorized into low, moderate, and high risk groups. Subsequently, we converted it into an easily accessible rapid assessment tool to encourage its implementation. We incorporated this tool into a web-based platform, utilizing Python for its development, and stored the data in MySQL. The online tool in both English and Chinese languages can be accessed free of charge and without any setup requirements (http://peiyun.cn/SEIR-AS-query/ ). -
Relationships between Risk Factors and the Death from COVID-19: We examined 106,103,566 COVID-19 cases from 20 countries, revealing that individuals aged over 65 years represented 76.51% of the deaths, frailty and pre-frailty (an intermediate stage between normal and frail) accounted for 83.20%, hypertension for 63.44%, cardiovascular diseases for 42.64%, dyslipidemia for 37.33%, diabetes for 35.44%, heart diseases for 28.63%, arrhythmias for 27.11%, depression for 26.84%, coronary artery disease for 25.48%, dementia for 23.18%, and renal disease for 18.86% of the fatalities (Figure 1A).
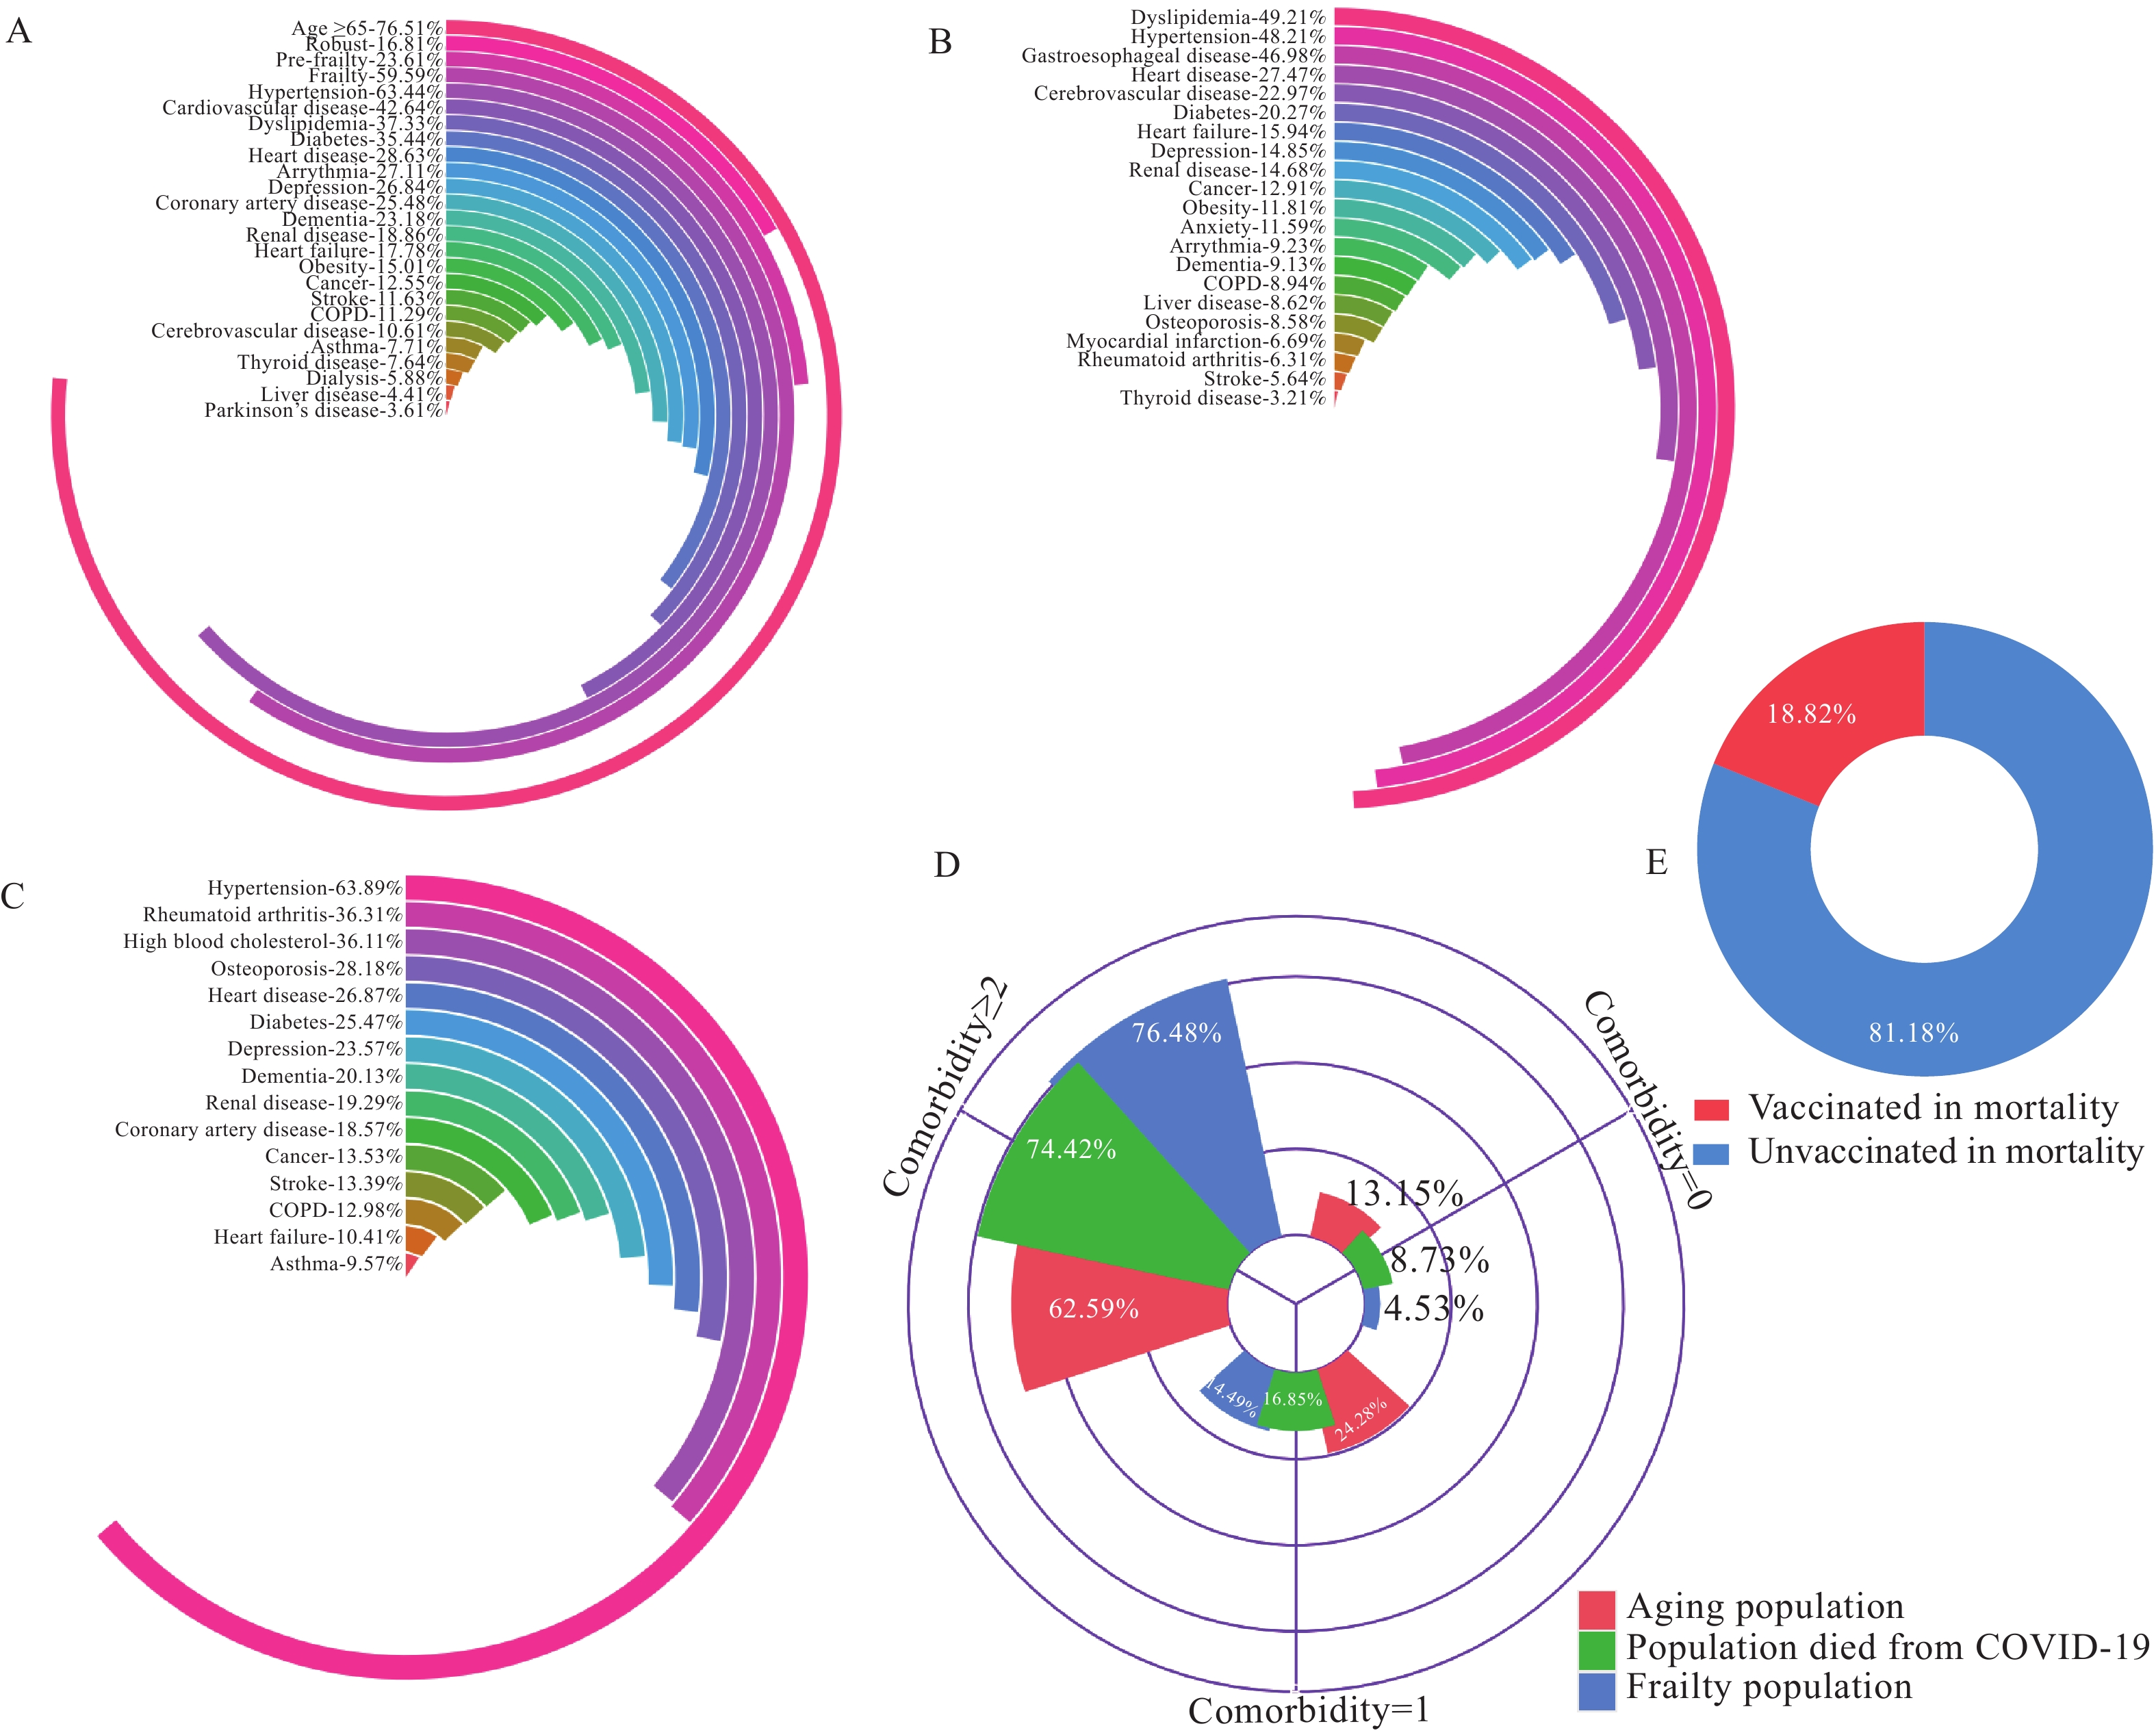 Figure 1.
Examining the complex relationships between aging, frailty, underlying disease, and medical history and COVID-19 mortality. (A) Proportion of individuals with aging, frailty, and underlying conditions among the total cases who died of COVID-19. (B) Proportion of underlying conditions in elderly patients. (C) Proportion of various underlying conditions among patients with frailty. (D) Number of coexisting diseases and frailty syndrome correlated with COVID-19 deaths. (E) Vaccination history affecting deaths of COVID-19.
Abbreviation: COPD=chronic obstructive pulmonary disease; COVID-19=coronavirus disease 2019.Among the elderly patients (a total of 38,645,762 cases), hyperlipidemia was present in 49.21% of the cases, hypertension in 48.22%, gastroesophageal disease in 46.98%, heart disease in 27.47%, cerebrovascular disease in 22.97%, diabetes in 20.27%, heart failure in 15.94%, depression in 14.85%, renal disease in 14.68%, and cancer in 12.91% (Figure 1B). In contrast, among patients with frailty (a total of 890,586 cases), hypertension was a factor in 63.89% of the cases, rheumatoid arthritis in 36.31%, high blood cholesterol in 36.11%, osteoporosis in 28.18%, heart disease in 26.87%, diabetes in 25.47%, depression in 23.57%, dementia in 20.13%, renal disease in 19.29%, and coronary artery disease in 18.57% (Figure 1C).
To further investigate the relationship between aging, frailty, and mortality in COVID-19 patients, we analyzed the number of underlying diseases these patients had. A nearly 75% similarity was observed in the proportion of patients with frailty who had more than two underlying diseases to that of COVID-19 related deaths with two underlying diseases (Figure 1D). In comparison, the older adult group had an approximate proportion of 62.59%. This finding suggests that the presence of two or more underlying diseases in patients with frailty can serve as a useful indicator for determining the risk of death in COVID-19 patients.
By examining clinical data and assessing the proportion of vaccination history among COVID-19-related deaths (7,348,213 total cases), we found that less than 20% of the deceased individuals were vaccinated (Figure 1E). This outcome indicates that vaccination history also serves as a valuable predictor for evaluating the risk of death in COVID-19 patients.
The Formula Proposed for Predicting the Deaths in COVID-19: Based on the analysis results and the logical relationships among population factors, we derived a mathematical formula to estimate the potential number of deaths as follows: A = A1 × A2 × (1 − A3) × A4. This equation implies that the high-risk population (i.e., the deaths) can be calculated by multiplying the total infections by the proportion of individuals over 60 years, then by (1 − vaccination rate), and finally by the proportion of frail elderly individuals (Figure 2A). The estimated number of high-risk populations closely aligns with the actual number of COVID-19 deaths in areas with strict control measures in place, such as New Zealand, and Singapore (Figure 2B), as well as in areas with less stringent control measures, including the USA, Brazil, India, Italy, England, Germany, and Spain, Republic of Korea, Russia, Australia, Iran, Mexico, Türkiye, Viet Nam, and the Netherlands (Figure 2C). To evaluate the accuracy of our prediction, we assessed the difference between our predicted values and the reported numbers of deaths. We found that the highest discrepancy was 42.06% and the lowest was 2.60%, resulting in a mean variation of 16.24% (Figure 2D).
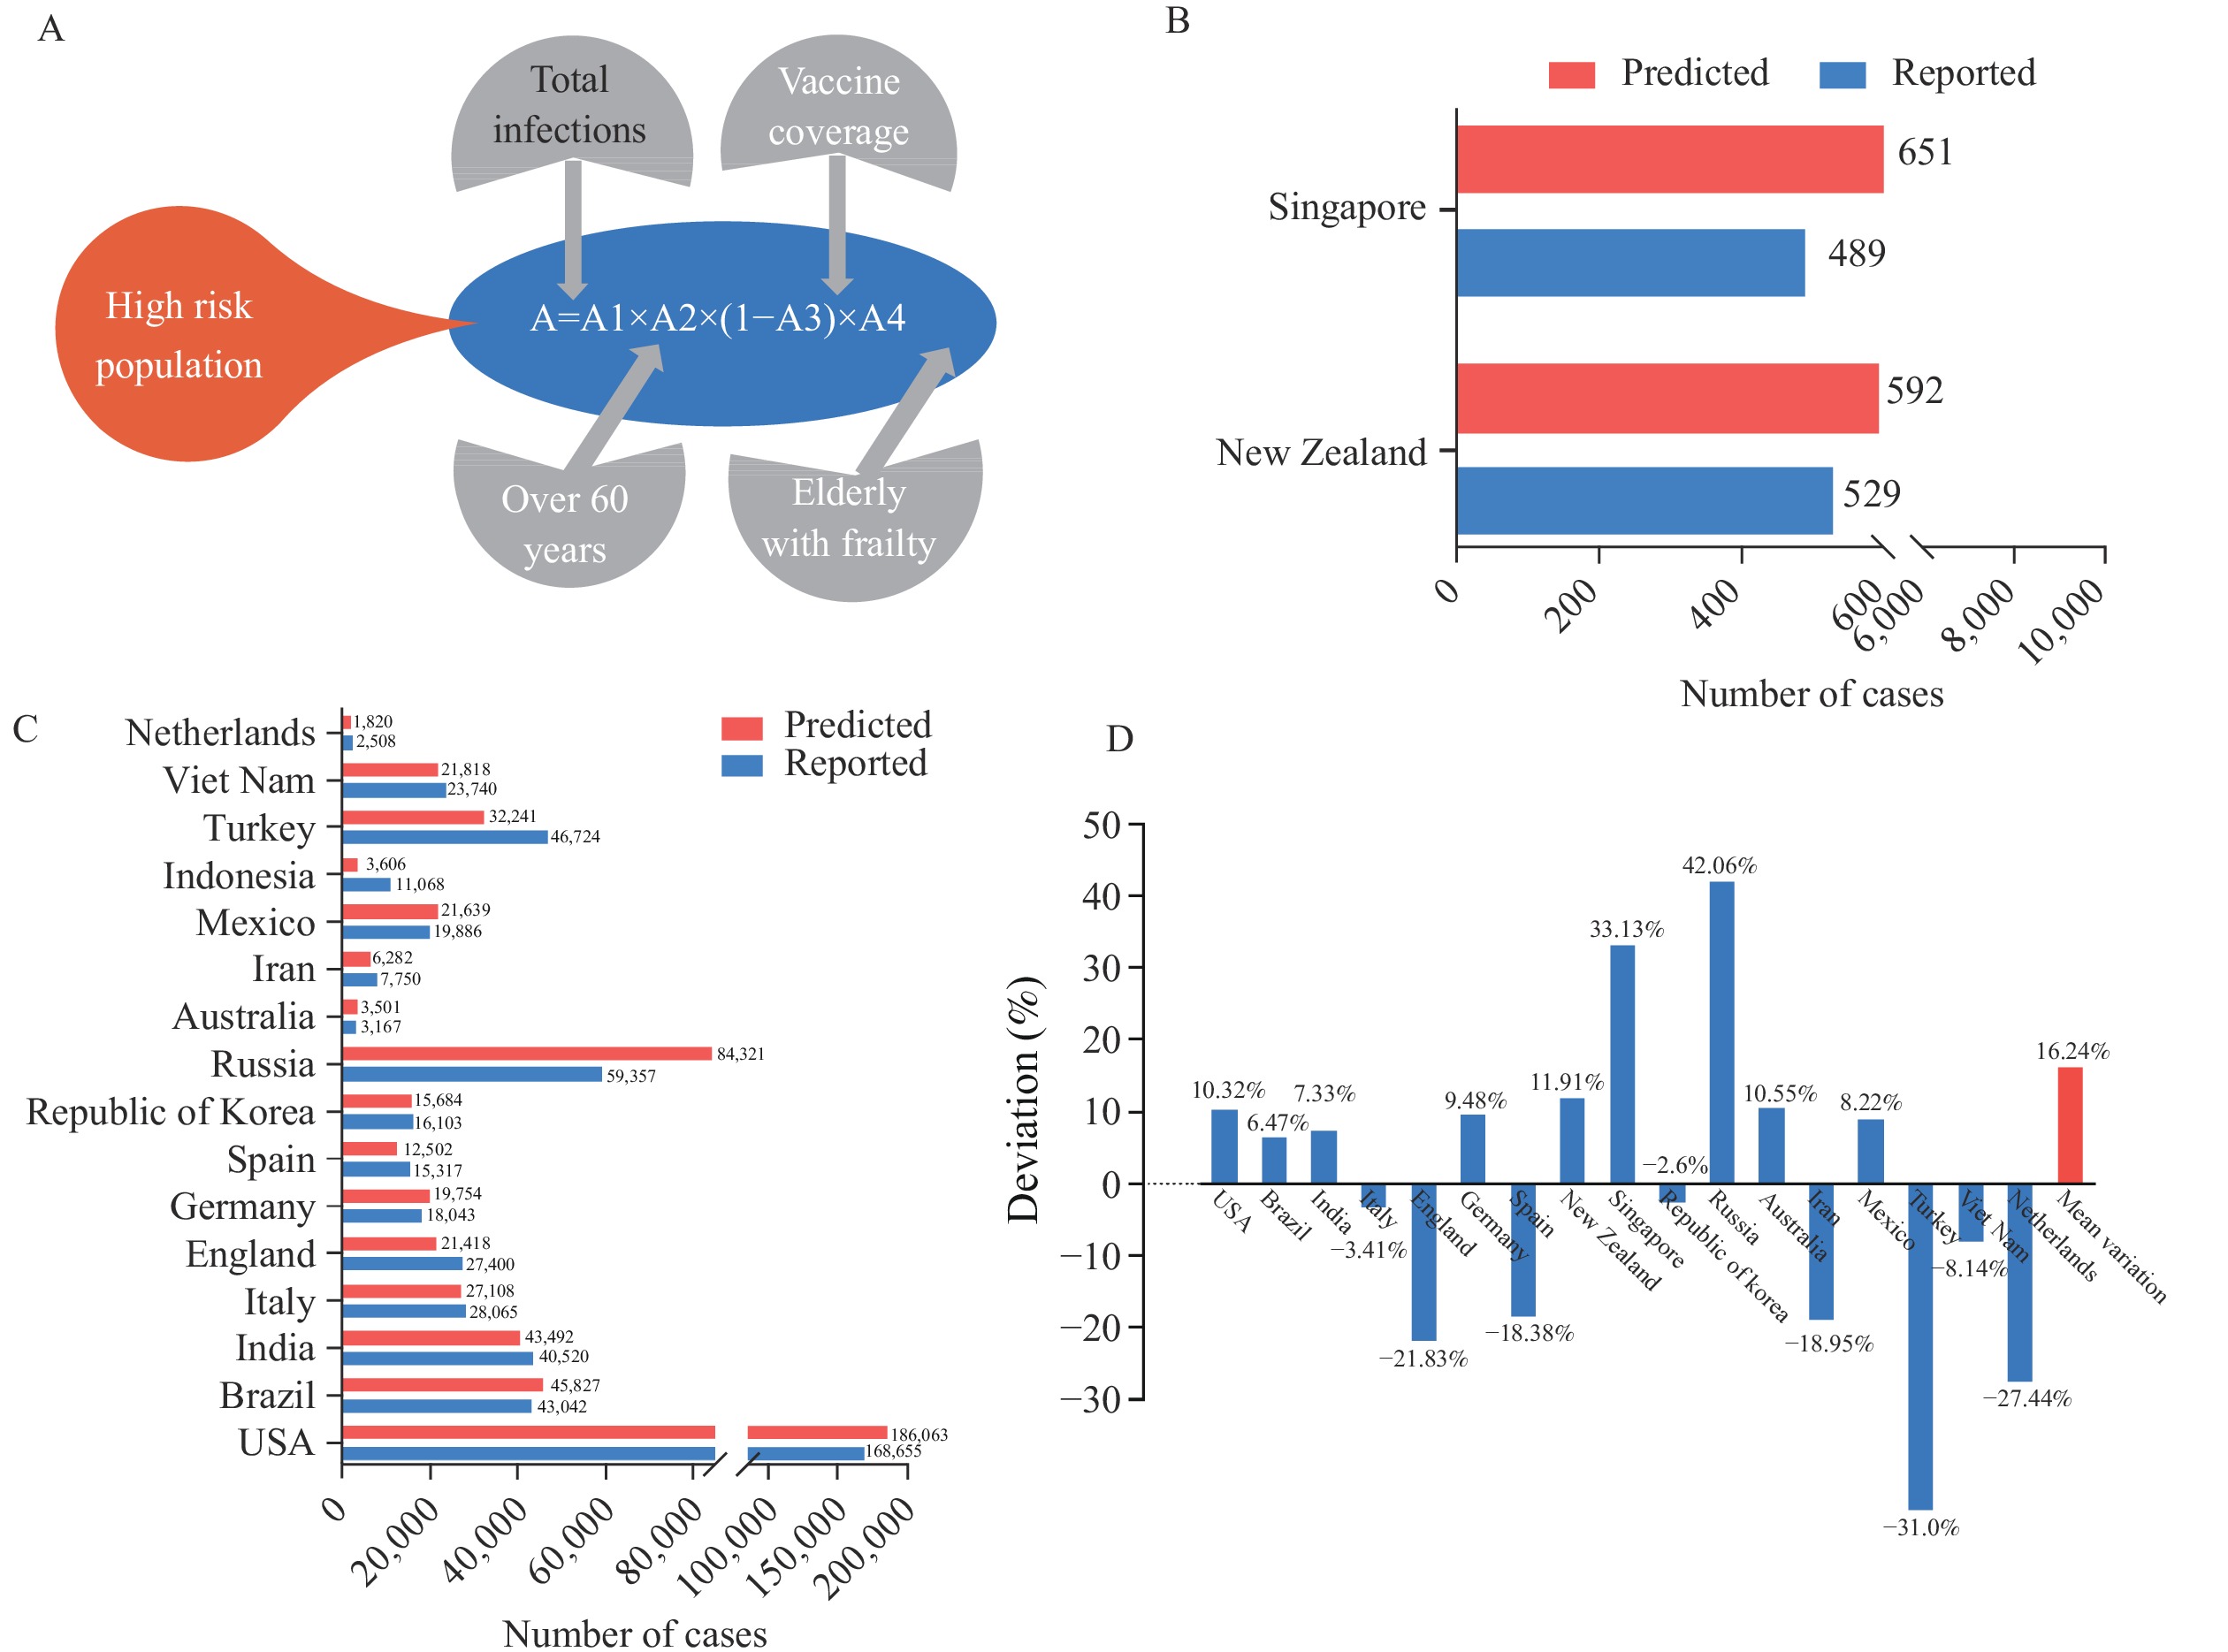 Figure 2.
Comparison of predicted high-risk populations and actual COVID-19-related deaths. (A) Proposed formula for predicting the deaths. (B) Comparison of predicted and reported case numbers in New Zealand, and Singapore. (C) Comparison of predicted and reported COVID-19 cases in the United States, Brazil, India, Italy, United Kingdom, Germany, Spain, Republic of Korea, Russia, Australia, Iran, Mexico, Türkiye, Viet Nam, and the Netherlands. (D) Bias generated by prediction for all analyzed regions.
Abbreviations: USA=the United States of America; COVID-19=coronavirus disease 2019.Software Developed for Assessing the Risk of Death for a Population Suffering from COVID-19: We developed a software tool designed to assess the risk of mortality within a population, providing a reference framework for decision-making at country or regional levels. This software incorporates our risk assessment formula into the traditional SEIR model, which is frequently employed for simulating the progression of an epidemic (Figure 3A). Our software offers both out-of-the-box and customizable functionality (Figure 3B). Users can input relevant epidemic parameters and click the “simulate” button to obtain the predicted total infection and death counts.
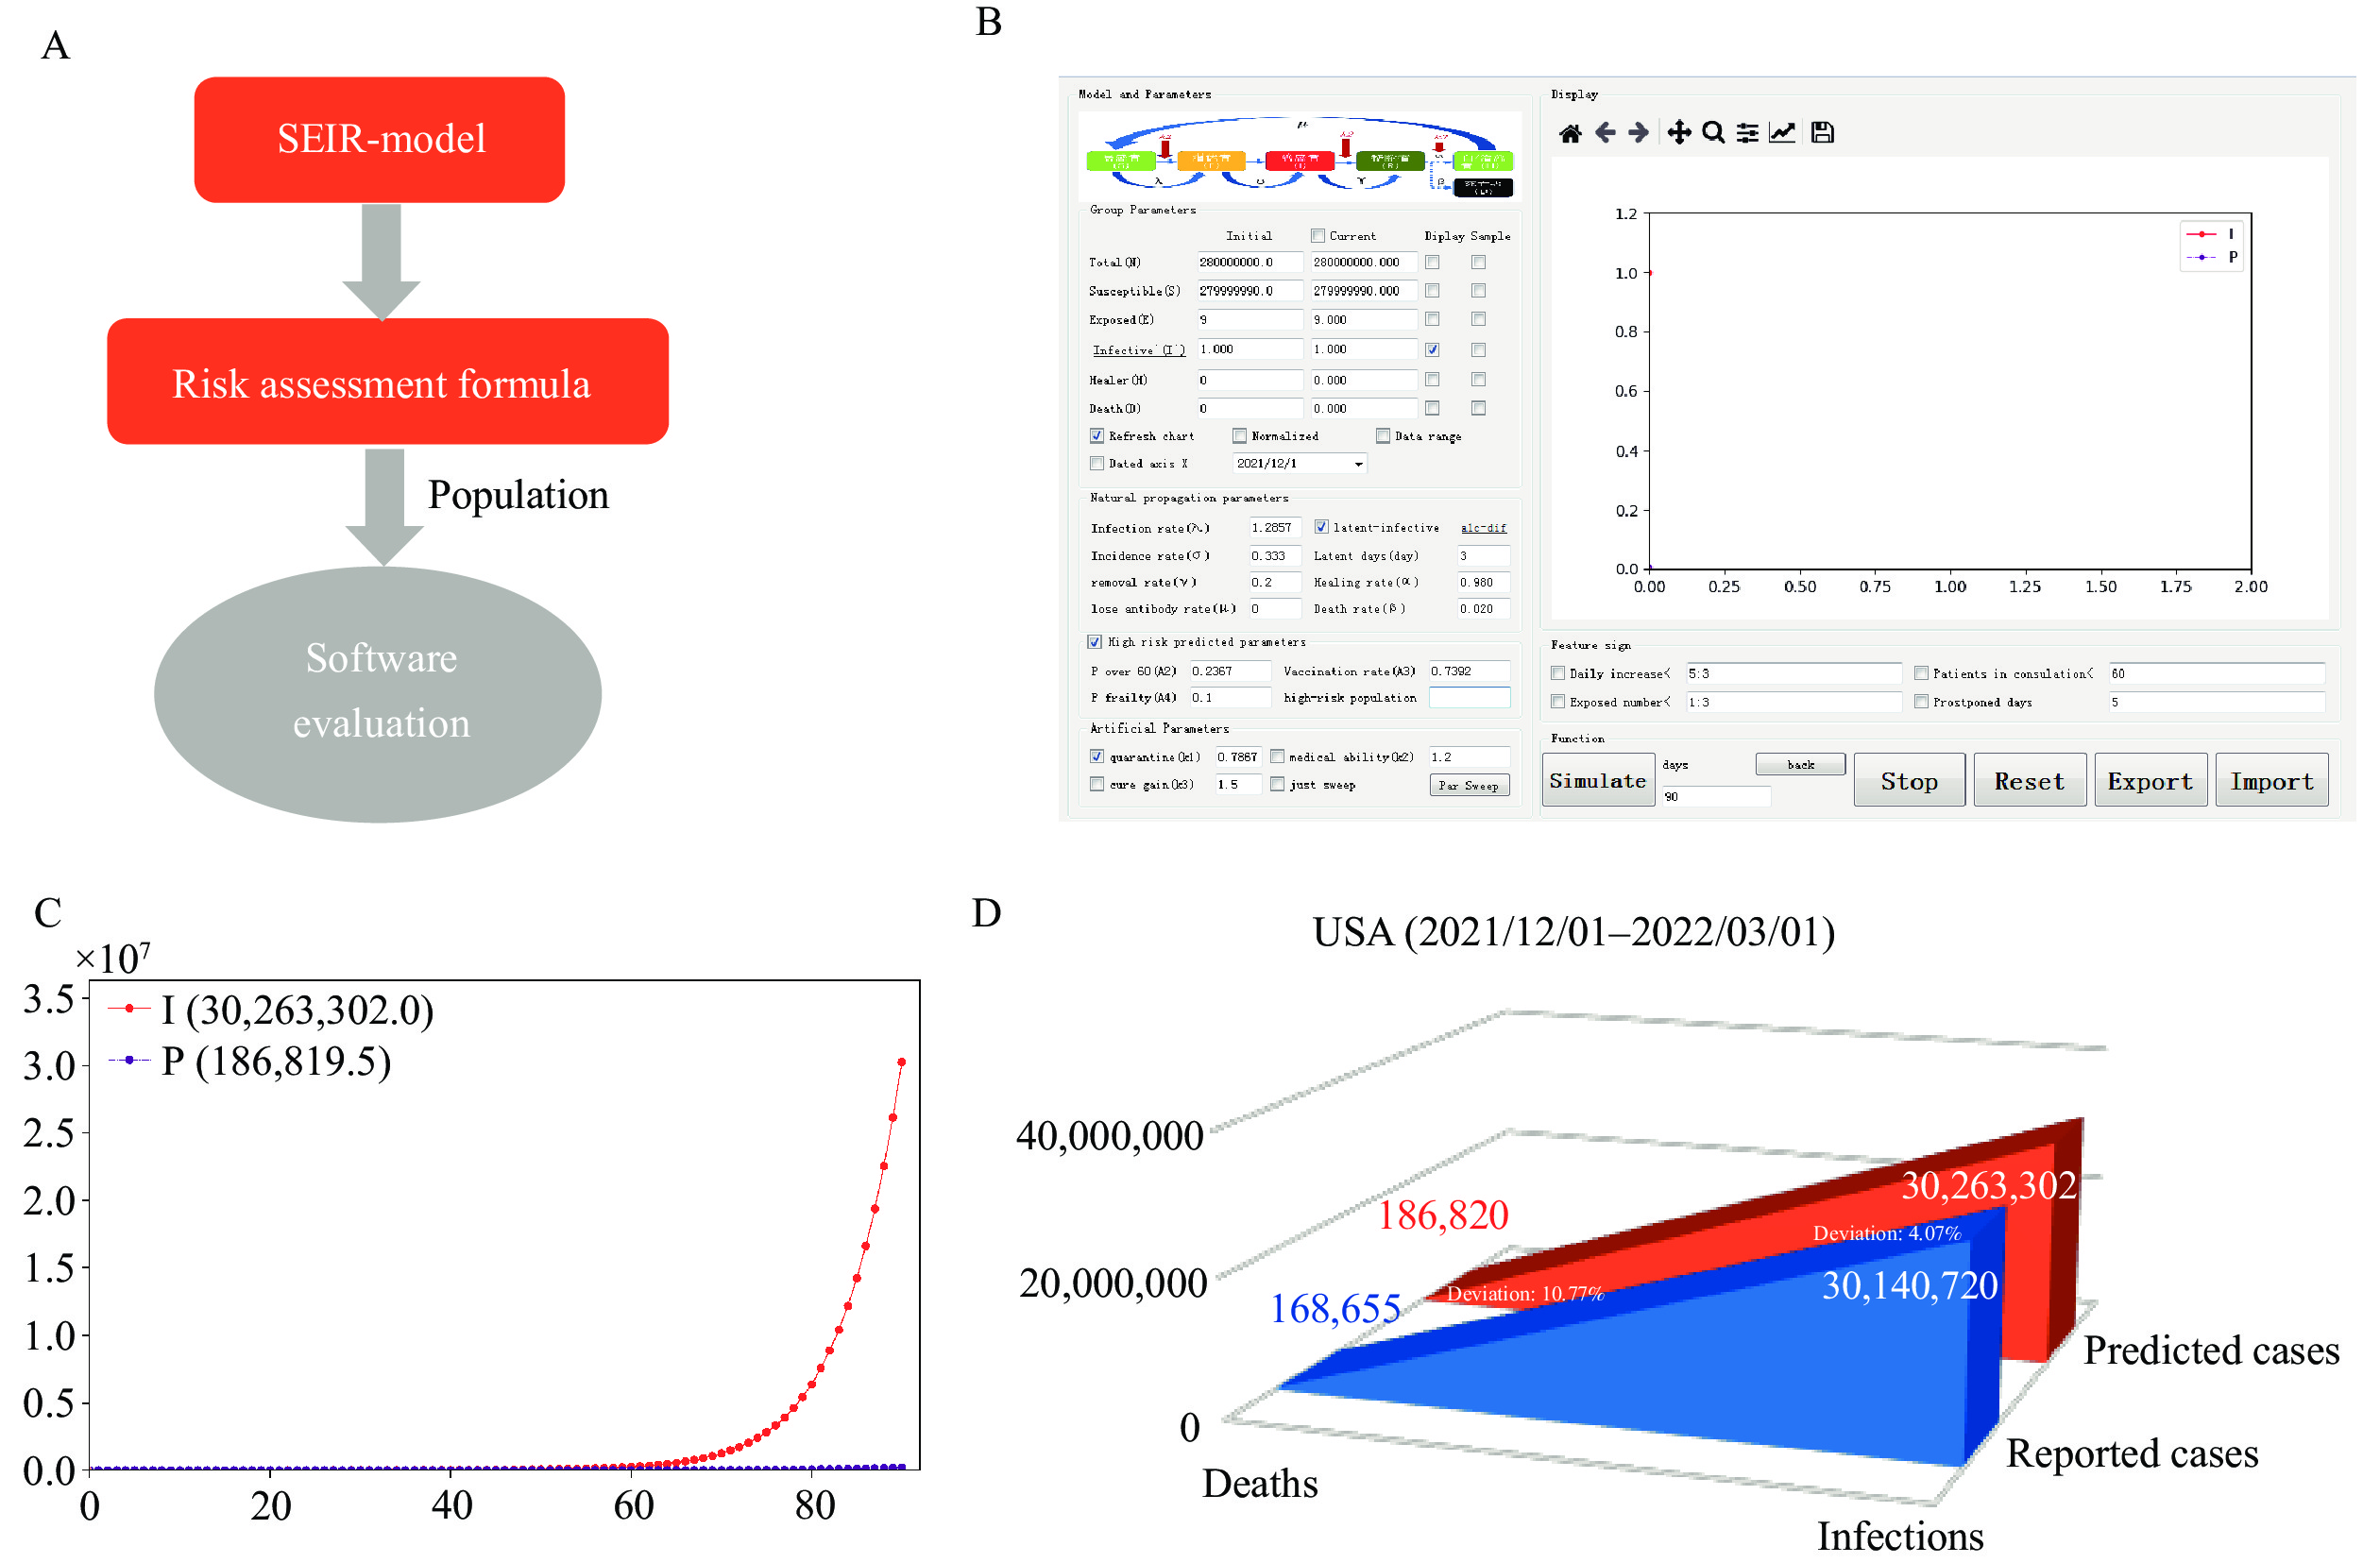 Figure 3.
Software for population risk assessment for coronavirus disease 2019. (A) Design principle of the software. (B) Software interface and operating parameters. (C) Projected total number of infections and deaths in the United States from December 1, 2021 to March 1, 2022, utilizing predictive modeling software. (D) Comparison of predicted and reported total infections and deaths in the United States from December 1, 2021 to March 1, 2022.
Abbreviations: USA=the United States of America.Using data from the United States between December 1, 2021 and March 1, 2022, we entered these values and executed the software. The 90-day simulation results are presented within the software interface and can be exported for further analysis (Figure 3C). We compared the predicted and reported numbers of total infections and deaths. The reported figures were 30,140,720 and 168,655, whereas the simulated figures were 30,263,302 and 186,820, respectively (Figure 3D). These findings demonstrate the practical utility of our software tool.
Scale Designed for Assessing the Risk of Death for an Individual Suffering from COVID-19: We designed a scale that considers the above main key factors that lead to COVID-19 deaths to rapidly assess the risk of death for an individual. This scale consists of four domains: frailty phenotype, comorbidity number, vaccine dose, and COVID-19 symptom (Figure 4A). We can assess the risk by way of the question and answer scoring (Figure 4B). It has 6 questions and 14 answers, and the score is rated from 0 to 6 (
Supplementary Table S2 ). The evaluation results are as follows: low risk at <3.5; moderate risk at 3.5–5; and high risk at >5. Presently, we are in the information age. We have designed an online web page for risk assessment anytime and anywhere to facilitate individual prediction (Figure 4C). Completing this scale may only take 1–3 minutes due to its free and out-of-the-box availability, which will allow a simple and quick individual assessment.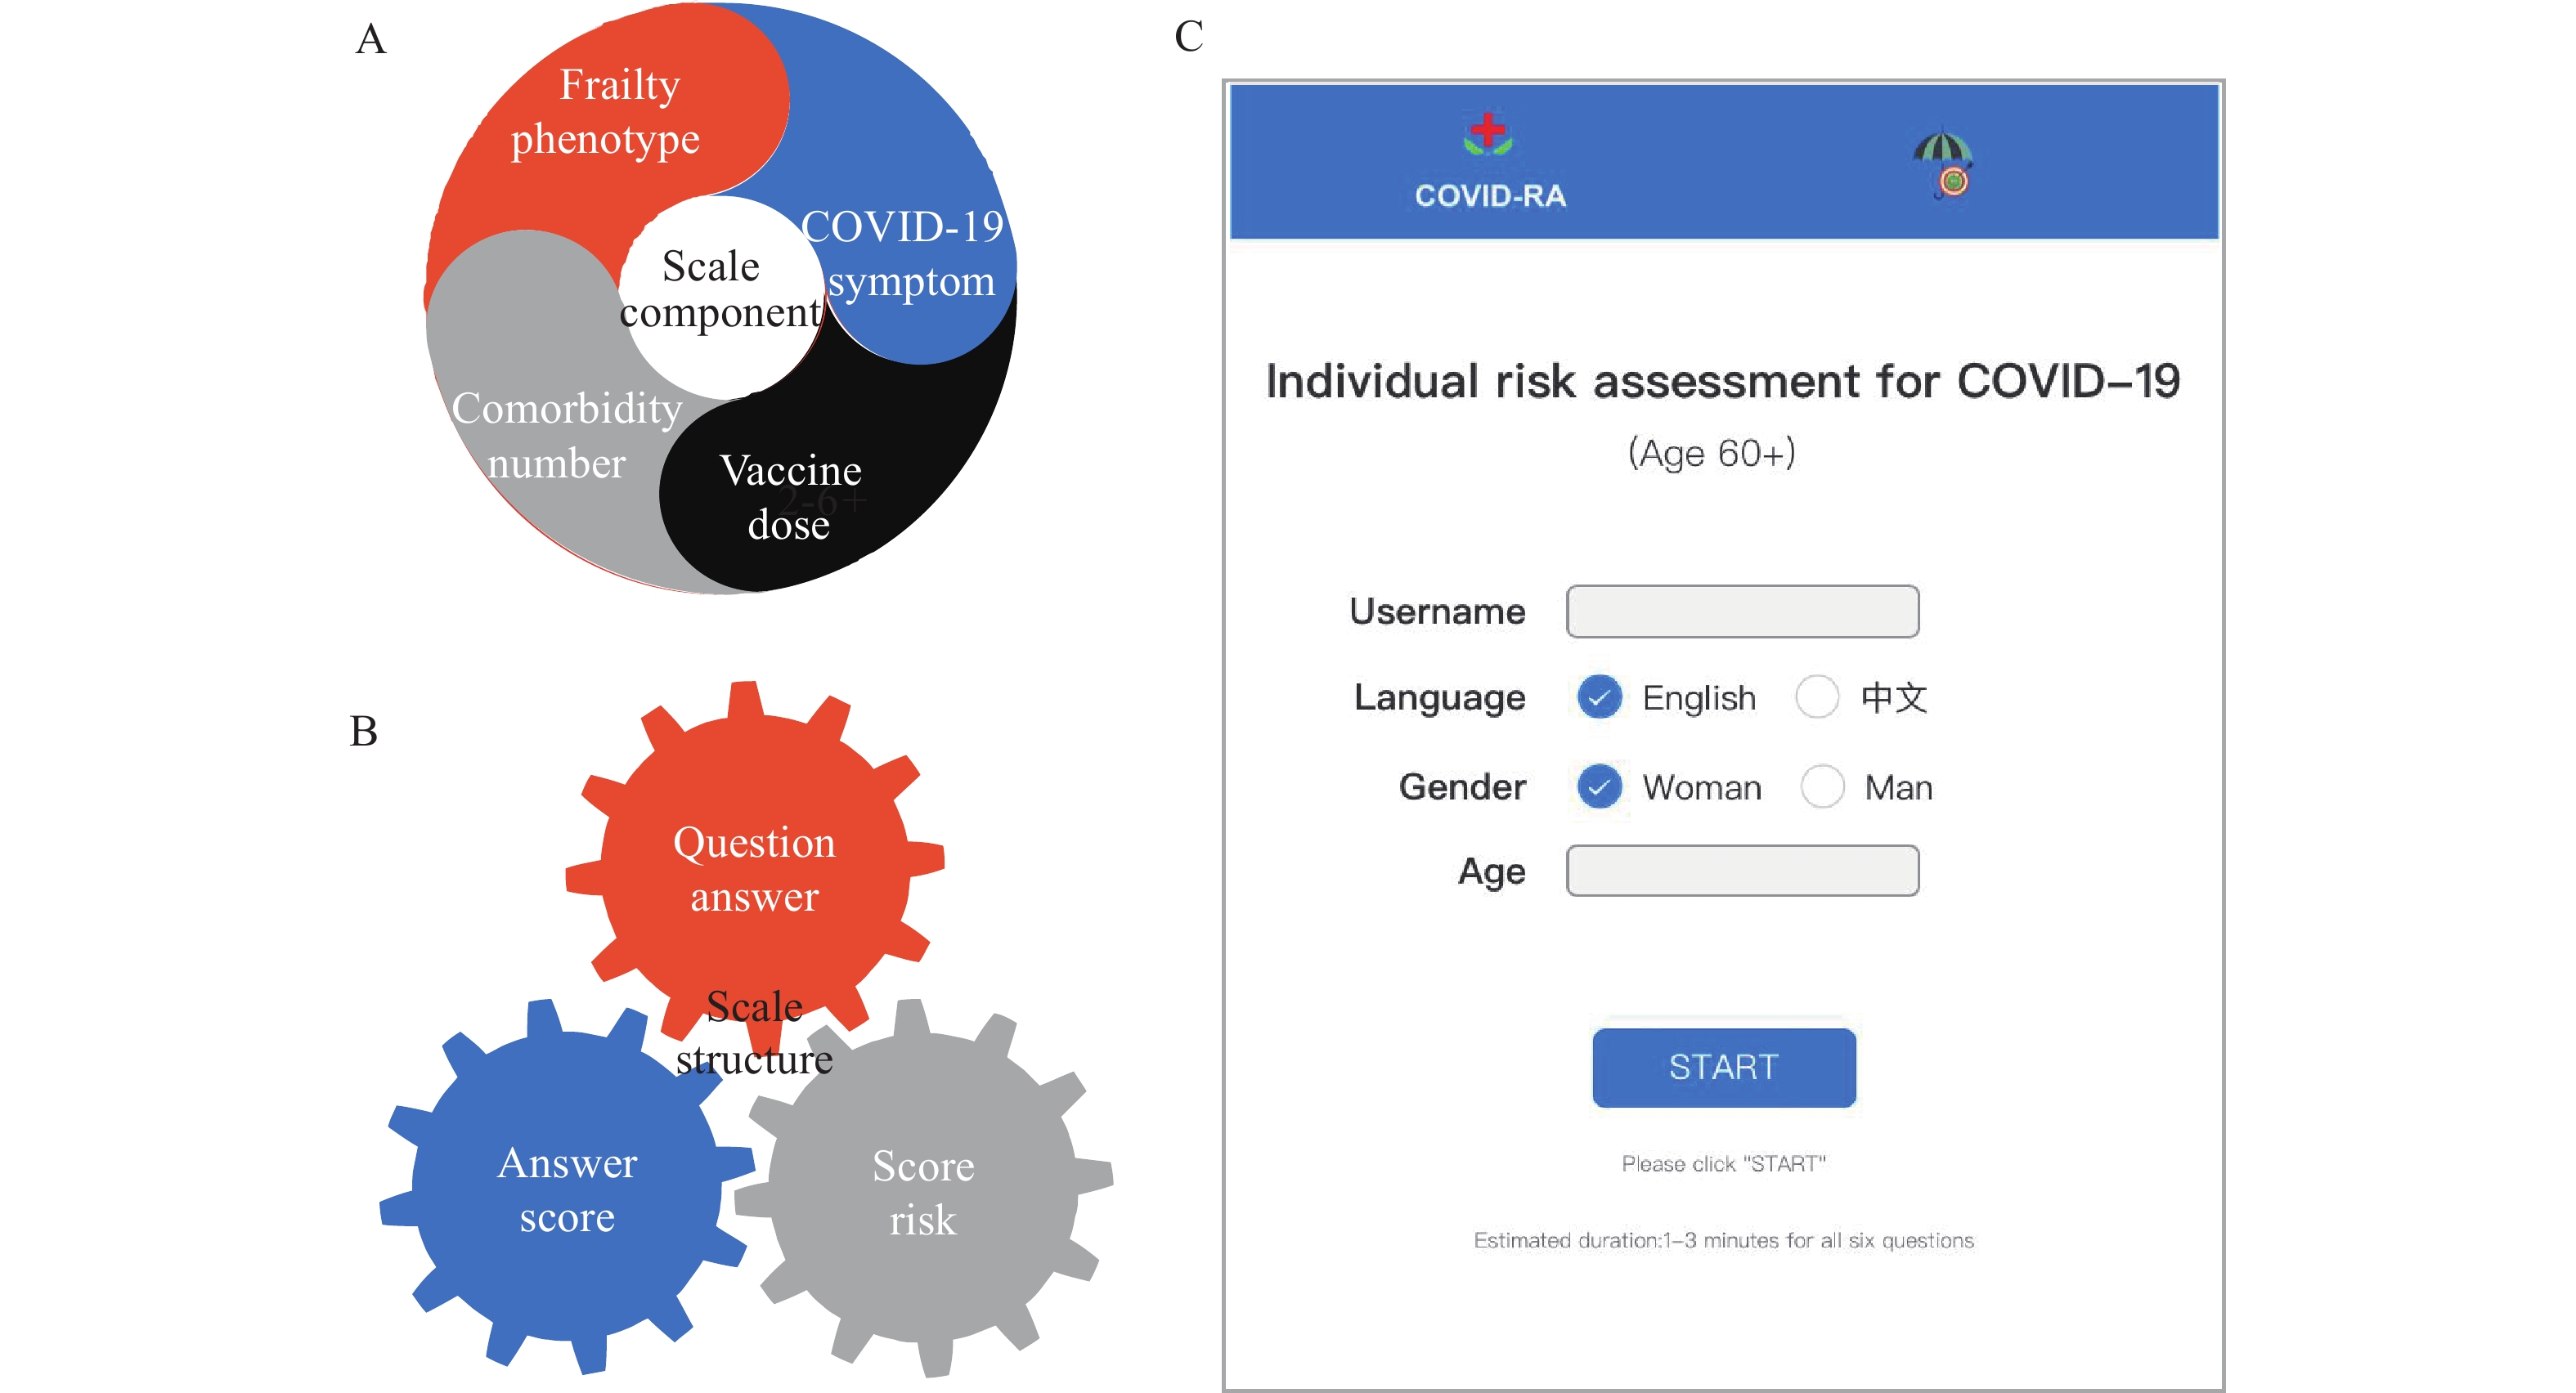 Figure 4.
Web-based version of scale for individual risk assessment for coronavirus disease 2019 (COVID-19). (A) Scale component. (B) Scale structure. (C) Online risk assessment tool.
-
Frailty characterized by a decline in physiological reserves across multiple organ systems can result in increased susceptibility to external stressors (8). Risk assessment based on frailty has been employed in clinical resource allocation in various fields since its introduction 20 years ago (9-10). Frailty has also been suggested as a criterion for priority access to medical care for COVID-19 patients (10). However, relying solely on frailty as an indicator may not be sufficient in addressing the novel epidemic strain, which is predominantly characterized by asymptomatic cases. We incorporated age, frailty, and vaccination history into our risk assessment tool to enhance its accuracy and applicability using a mathematical formula based on the product effect to estimate the number of fatalities (Figure 2A). Subsequently, we refined this formula and developed a population risk assessment software, SEIP-RA (Figure 3), by adapting our previous SEIR model (7) to make it more practical. The reliability of this formula was demonstrated to be accurate to 83.76% using epidemic data from 20 countries and regions (Figure 2D). Although discrepancies exist between our predictions and the available reports (Figure 2B–D), these variations can be mainly attributed to the regional heterogeneity of the frailty index and the ongoing changes in vaccination rates.
For individual risk assessment, relying solely on age, frailty, and vaccination history may be inadequate. Factors such as the number of comorbidities and the presence of COVID-19 symptoms also significantly influence the severity of the disease. To improve accuracy, we integrated these two factors into our assessment tool. The tool is based on the Fried phenotype, a frailty assessment method, with the removal of complex indicators. Key risk factors, such as vaccination status and number of comorbidities, were extracted from the population level and combined with clinical symptoms of COVID-19 to create a straightforward and rapid personal risk assessment tool. The weight of each item is assigned according to the scoring system of the frailty scale (Fried phenotype) (11). Clearly, retrospective research methods are insufficient to rigorously verify and fine-tune the weight of each item. Further refinement will necessitate years of clinical experience in multiple countries or regions with ongoing COVID-19 outbreaks. Unfortunately, we could not provide individualized clinical data for risk assessment due to current conditions. It is our hope that widespread use of this scale will generate valuable data in the future, assisting in the tool's improvement.
In accordance with prevailing logic, factors such as aging, comorbidities, frailty, and vaccinations significantly contribute to the mortality associated with infectious diseases, irrespective of viral mutations. Consequently, our risk assessment tools remain broadly applicable. In summary, these tools may offer valuable insights for enhancing life preservation, resource allocation, cost-effectiveness, and the advancement of social and economic development.
HTML
| Citation: |

|