

 Download:


-
Due to waning immunity against coronavirus disease 2019 (COVID-19) and the ongoing emergence of severe acute respiratory syndrome coronavirus 2 (SARS-CoV-2) Omicron variants, another epidemic wave of COVID-19 is expected. Insights from other countries can offer valuable information on the timing and severity of the upcoming COVID-19 wave in China. In this study, we analyzed surveillance data related to COVID-19 from 189 countries that experienced two or more waves of the SARS-CoV-2 Omicron variant. The median time between the first and second wave peaks was 164 days, and between the first and third wave peaks was 247 days. The median relative peaks of the second and third waves compared to the first wave were 14.5% and 11.2%, respectively.
The relative peak of the second wave showed a significant increase in relation to the gross domestic product per capita (P<0.001), urbanization rate (P=0.003), population density (P=0.007), and proportion of older adults over 65 years (P<0.001). Meanwhile, it decreased significantly with the proportion of individuals aged 0–14 years (P<0.001). In conclusion, the historical context and progression of COVID-19 outbreaks in other countries may help inform risk assessment for future outbreaks in China. However, the timing of the next COVID-19 wave may also be influenced by several unknown factors, including the rapid viral evolution of SARS-CoV-2.
Understanding the timing and magnitude of subsequent COVID-19 waves in China is crucial for predicting and mitigating the spread of the virus. The Omicron variant, first identified in South Africa and Botswana and reported to the World Health Organization (WHO) on November 24, 2021 (1), has led to at least three waves of COVID-19 in Europe, the Americas, and the Western Pacific (1). However, due to China’s zero-COVID policy and stringent nonpharmaceutical interventions, the country experienced its first nationwide COVID-19 wave caused by the Omicron variant considerably later compared to other nations. The initial and most severe nationwide wave, attributed to the SARS-CoV-2 Omicron BF.1 and BA.2.2 subvariants, subsided by January 25, 2023 in China. Nevertheless, as immunity to COVID-19 wanes (2) and the SARS-CoV-2 Omicron variant continues to evolve (3), subsequent waves are inevitable. Consequently, insights from other countries can offer valuable information regarding the timing and magnitude of future COVID-19 waves in China.
In the present study, we analyzed COVID-19 surveillance data from 237 countries to determine the timing and magnitude of the first, second, and third waves of COVID-19 attributable to the SARS-CoV-2 Omicron variant. Furthermore, we examined the correlations between these waves and socioeconomic factors. Daily confirmed COVID-19 case data for 237 countries from January 1, 2020, to February 28, 2023, were obtained from the WHO Coronavirus (COVID-19) Dashboard (1), and Our World in Data (4). Socioeconomic status data for each country were also collected from the World Bank (5), encompassing gross domestic product (GDP) per capita, urbanization rate (percentage of people residing in urban areas), population density, and the proportions of individuals aged >65 years and <14 years. Given that the SARS-CoV-2 Omicron variant was initially identified in South Africa and Botswana and reported to the WHO on November 24, 2021 (6), our analysis focused on the period following this date.
In this study, the highest number of daily confirmed COVID-19 cases was considered the peak of a wave. The period between two consecutive waves of the SARS-CoV-2 Omicron variant was defined as the time interval between the peak timings of these waves. The relative peaks of the second and third waves were calculated by dividing the peaks of these waves by the peak of the first wave. Since the first nationwide wave of the SARS-CoV-2 Omicron variant occurred in China in January 2023, the timing of the second wave is of significant interest. Therefore, we primarily focused on the period between the first and second waves of the Omicron variant in other countries.
The definition of a COVID-19 wave within a country used in this study was similar to our previous studies on influenza (7). The onset timing of an epidemic wave was identified as the first seven consecutive days with a smoothed increase in daily cases exceeding a predetermined baseline. The baseline was set as the 50% quantile of the non-zero number of daily cases (8). The end of a wave was defined as the first of seven consecutive days with a smoothed number of daily cases below the baseline.
Due to the potential impact of fluctuations in surveillance data on estimating the peak timing and peak value of a wave, a 7-day moving average was used to smooth the COVID-19 surveillance data in this study (7). Spearman's correlation was utilized to characterize the relationship between socioeconomic factors and the period of peak timing between two consecutive waves or the relative peak of the second wave, as these data did not exhibit a normal distribution. Correlation analysis was performed using R software (version 4.0.3; R Core Team, Vienna, Austria). A two-sided P-value of 0.05 or lower was considered statistically significant.
According to the established definition of a COVID-19 wave, by March 2023, a minimum of two waves of the SARS-CoV-2 Omicron variant had transpired in 189 countries. Concurrently, at least three waves were observed in 120 countries, and over four waves occurred in 48 countries.
The peak timings of the first and second waves of the SARS-CoV-2 Omicron variant significantly varied across 189 countries. Early peak timing in the first wave did not consistently indicate early peak timing in the second wave (Figure 1). Among these countries, the duration between the peak timings of the first and second waves ranged from 15 days in El Salvador to 351 days in Eswatini, with a median of 164 days [interquartile range (IQR): 125.5–184.0] and generally followed a Weibull distribution (Figure 2A). For 55 countries (30%), the duration between the peak timings of the first and second waves was between 150 and 180 days. In only seven countries, this period was less than 60 days, possibly due to small initial wave peaks in those countries. As such, these fluctuations are important factors in understanding COVID-19 wave patterns.
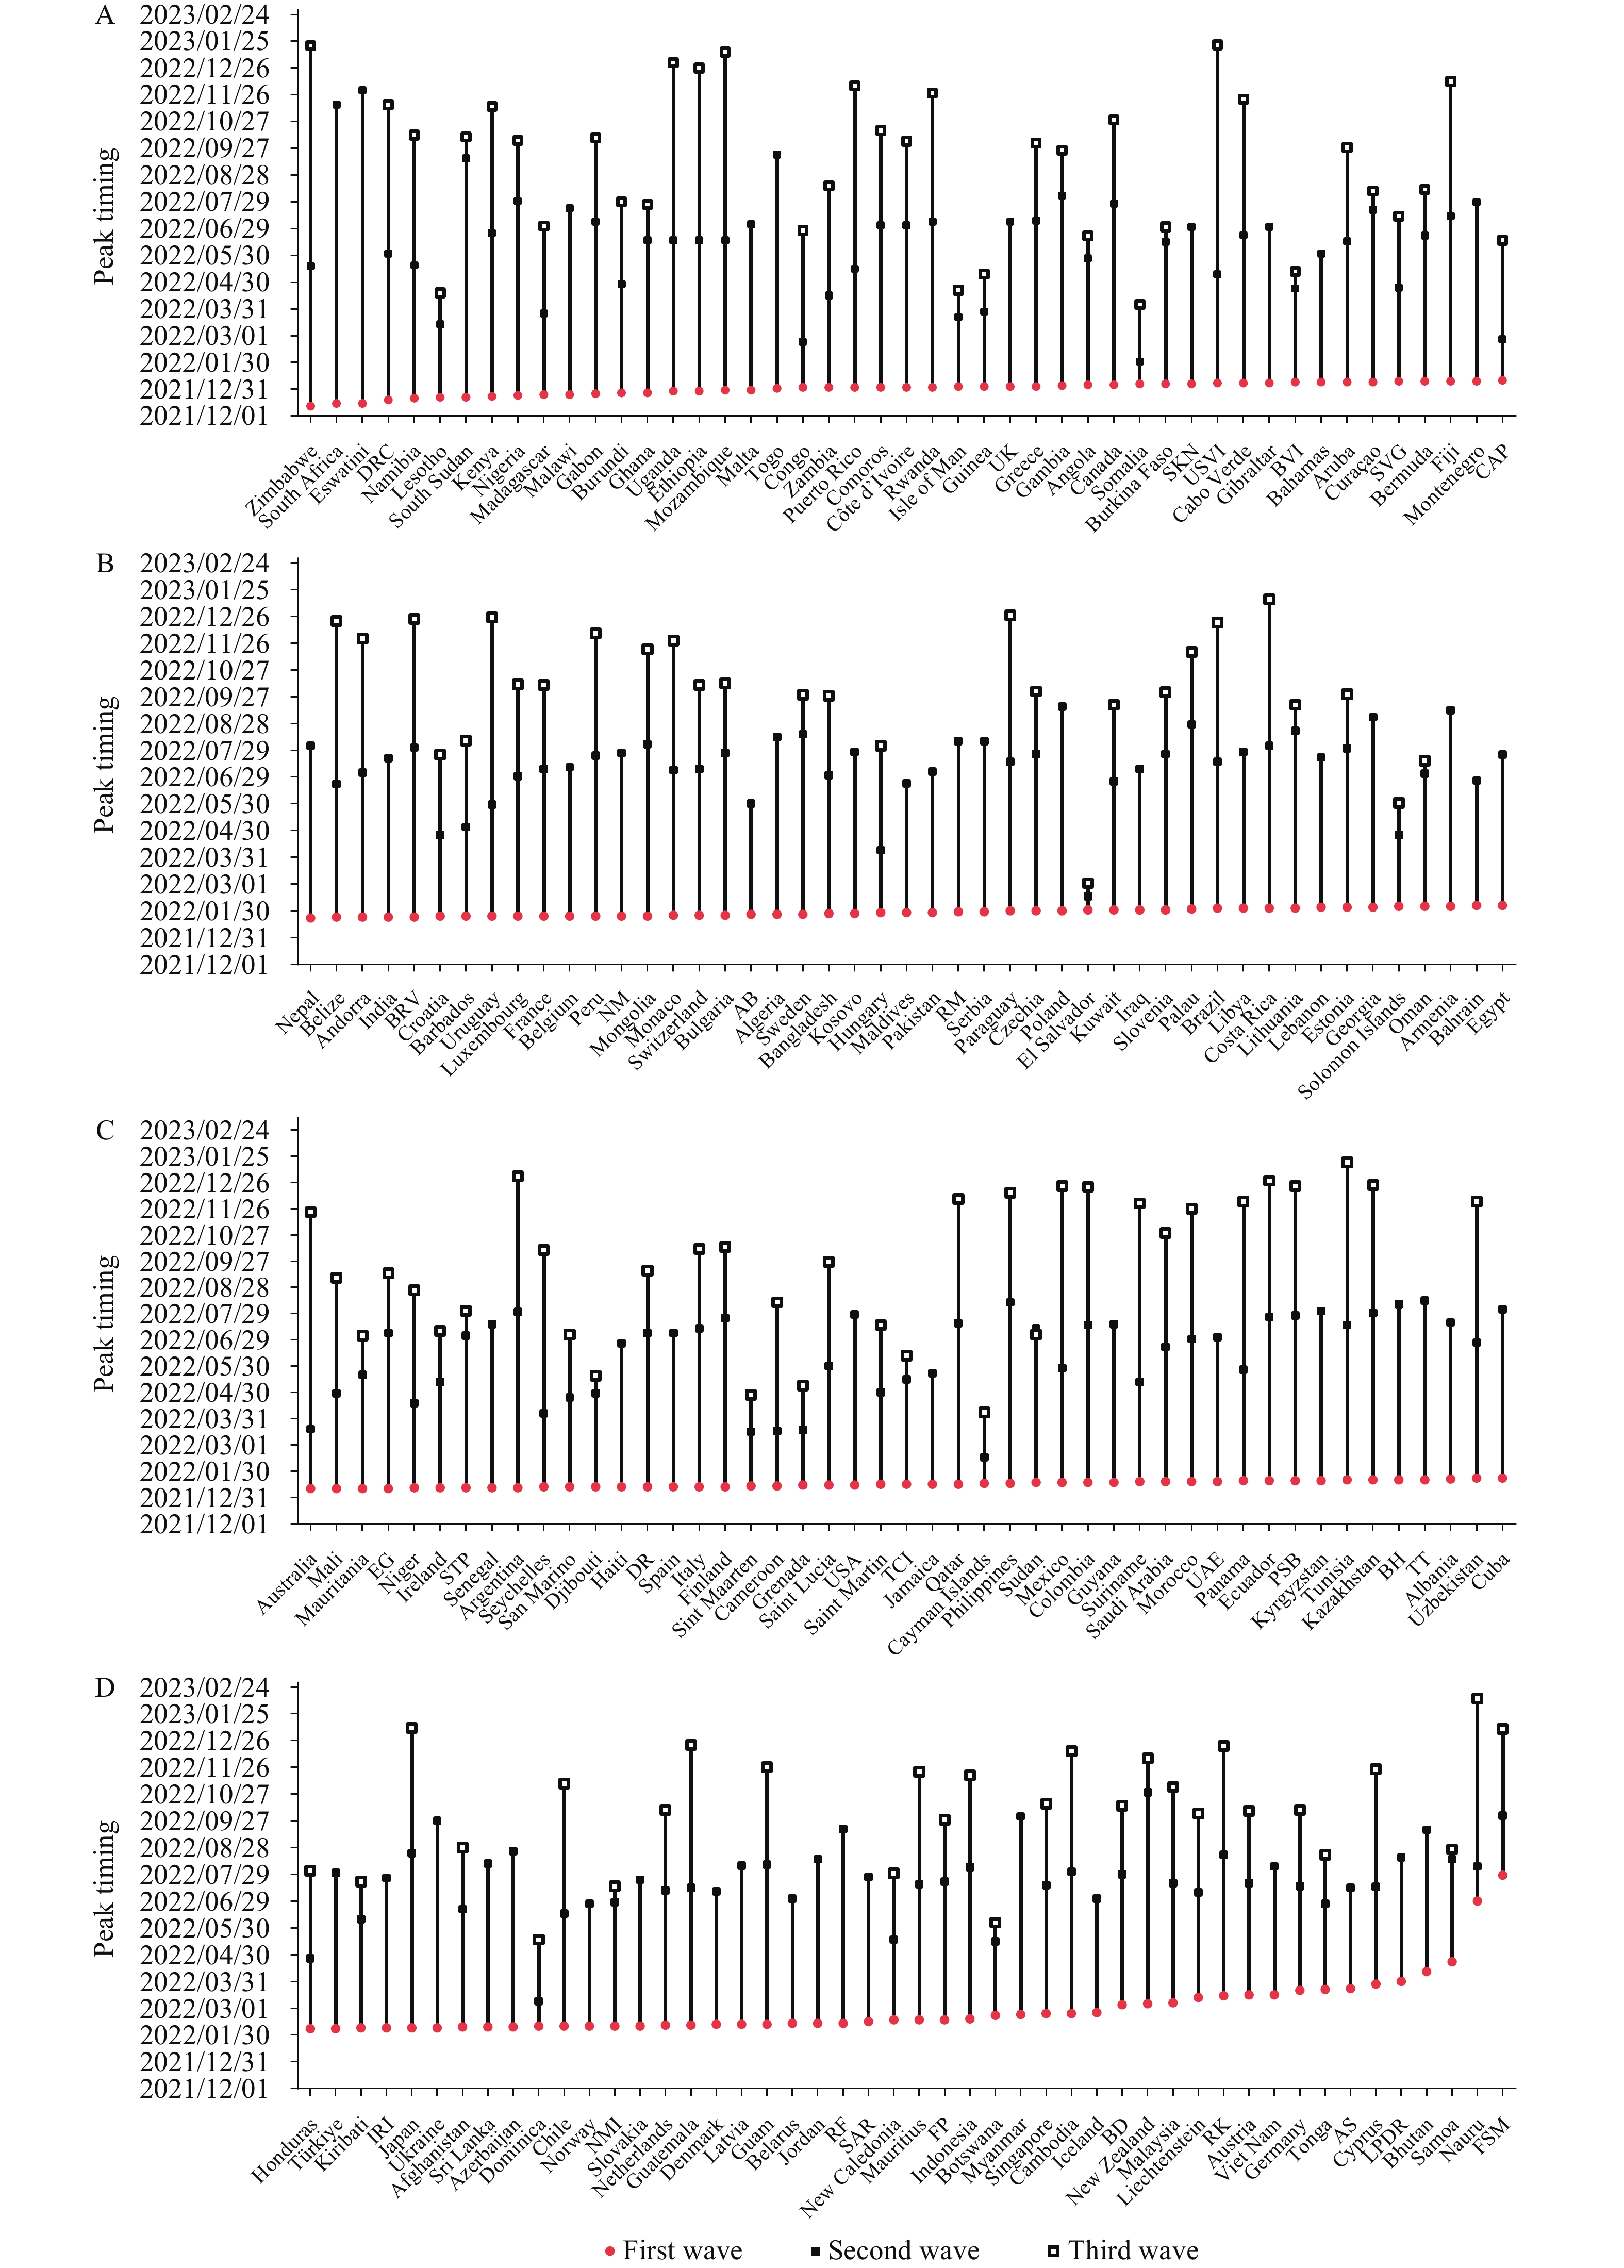 Figure 1.
Peak timing of the first, second, and third waves of COVID-19 caused by the SARS-CoV-2 Omicron variant in 189 countries. (A) In 47 countries with the peak timing of the first waves between December 12, 2021 and January 10, 2022; (B) In 47 countries with the peak timing of the first waves between January 10, 2022 and January 22, 2022; (C) In 47 countries with the peak timing of the first waves between January 22, 2022 and February 5, 2022; (D) In 48 countries with the peak timing of the first waves between February 6, 2022 and July 28, 2022.
Note: Countries were sorted by the increased peak timing of the first waves.
Abbreviation: DRC=Democratic Republic of the Congo; UK=United Kingdom; SKN=Saint Kitts and Nevis; USVI=United States Virgin Islands; BVI=British Virgin Islands; SVG=Saint Vincent and the Grenadines; CAP=Central African Republic; EG=Equatorial Guinea; STP=Sao Tome and Principe; DR=Dominican Republic; USA=United States of America; TCI=Turks and Caicos Islands; UAE=United Arab Emirates; PSB=Plurinational State of Bolivia; BH=Bosnia and Herzegovina; TT=Trinidad and Tobago; BRV=Bolivarian Republic of Venezuela; NM=North Macedonia; AB=Antigua and Barbuda; RM=Republic of Moldova; IRI=Islamic Republic of Iran; NMI=Commonwealth of the Northern Mariana Islands; RF=Russian Federation; SAR=Syrian Arab Republic; FP=French Polynesia; BD=Brunei Darussalam; RK=Republic of Korea; AS=American Samoa; LPDR=Lao People's Democratic Republic; FSM=Federated States of Micronesia; COVID-19=coronavirus disease 2019; SARS-CoV-2=severe acute respiratory syndrome coronavirus 2.
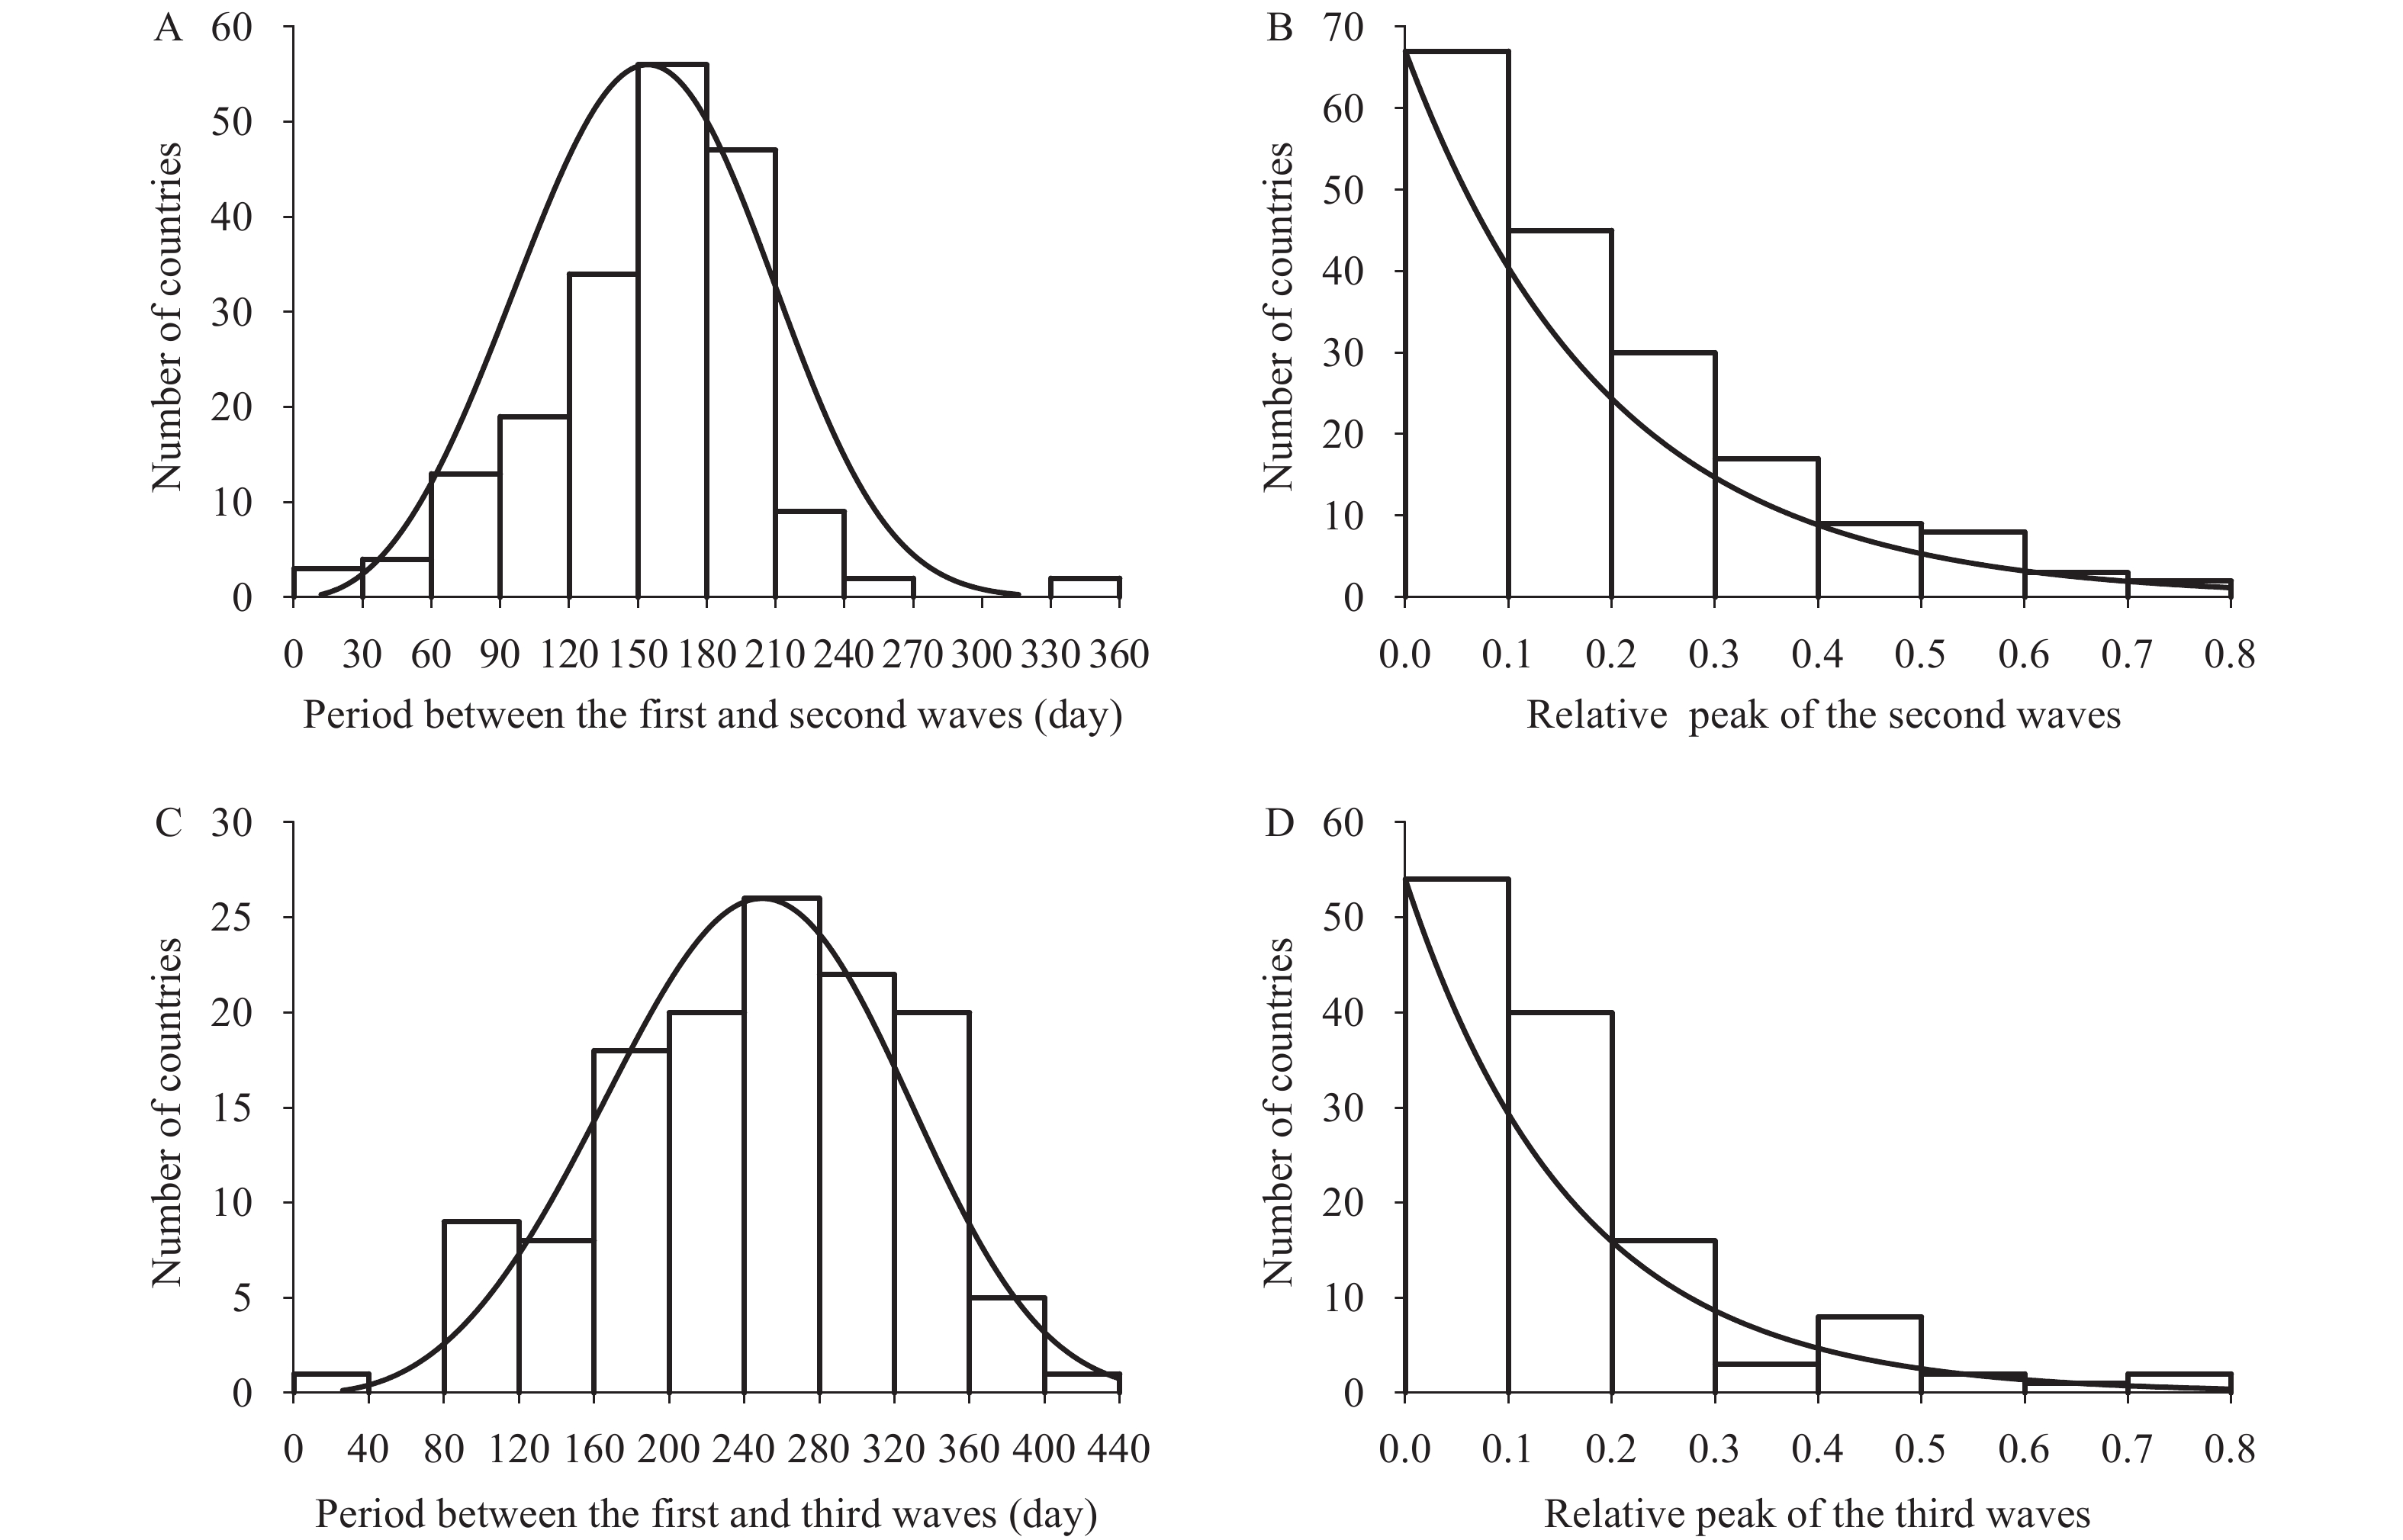 Figure 2.
Distribution of time periods and relative peaks of the second or third waves compared to the first waves of the SARS-CoV-2 Omicron variant. (A) Distribution of the time period between the first and second waves in 189 countries; (B) Distribution of relative peak of the second waves compared to the first waves in 181 countries; (C) Distribution of the time period between the first and third waves in 120 countries; (D) Distribution of relative peak of the third waves compared to the first waves in 117 countries.
Abbreviation: SARS-CoV-2=severe acute respiratory syndrome coronavirus 2.In only eight countries (i.e., Japan, Somalia, Guatemala, Federated States of Micronesia, El Salvador, Solomon Islands, Cayman Islands, and Australia), the peak of the second wave was higher than that of the first wave. Conversely, in 181 countries, the second wave peak was substantially lower than the first wave peak. In these countries, on average, the second wave peak was only one-fifth of the first wave peak. The relative peak of the second wave ranged from 1.0% to 73.1%, with a median value of 14.5% (IQR: 6.9%–28.5%), following an exponential distribution (Figure 2B).
More than three waves of the Omicron variant occurred in 120 of the 189 countries. The duration between the peak timings of the first and third waves varied from 30 to 404 days, with a median of 243 days (IQR: 184.2–314.5) (Figure 2C). In 69 countries (57.5%), the duration between the peak timings of the first and third waves ranged from 200 to 320 days. Only three countries (El Salvador, Solomon Islands, and Japan) had a third wave peak higher than the first wave peak. In the other 117 countries, the relative third wave peak ranged from 1% to 83.6% with a median value of 11.2% (IQR: 4.5%–20.6%), following an exponential distribution (Figure 2D). Generally, in these 117 countries, the third wave peak was slightly lower than the second wave peak.
The interval between the peak timings of the first and second waves did not exhibit a statistically significant rank correlation with any of the five socioeconomic factors analyzed in this study (Table 1). However, the second wave's relative peak demonstrated a significant increase in association with GDP per capita (P<0.001), urbanization rate (P=0.003), population density (P=0.007), and the percentage of older adults (>65 years; P<0.001). Conversely, it exhibited a significant decrease in relation to the proportion of individuals aged 0-14 years (P<0.001) (Table 1).
Socioeconomic factors Peak timing Relative peak Spearman correlation P value Spearman correlation P value GDP per capita −0.037 0.616 0.298 <0.001 Urbanization rate 0.042 0.571 0.214 0.003 Population density −0.077 0.294 0.196 0.007 Proportion of older adults >65 years 0.127 0.081 0.307 <0.001 Proportion of <14 teenagers −0.064 0.384 −0.347 <0.001 Abbreviation: GDP=gross domestic product. Table 1. Correlation between socioeconomic factors and the timing and relative peak of the second compared with the first waves.
-
Predicting the timing and magnitude of future COVID-19 waves is crucial for efficiently preparing for and responding to potential crises. Due to the implementation of the dynamic zero-COVID policy in China, the first COVID-19 wave caused by the SARS-CoV-2 Omicron variant occurred later in China than in other countries. Consequently, insights can be gained from examining the development of outbreaks elsewhere. Our study indicates that in most countries, the second wave of COVID-19 brought on by the SARS-CoV-2 Omicron variant emerged 5–7 months after the first wave, with the magnitude of the second wave being significantly lower than that of the initial wave.
In addition, our analysis revealed that the peak timing of the second COVID-19 waves in 107 out of 151 Northern Hemisphere countries occurred between June 1 and August 30, 2022, suggesting that warm weather has a limited impact on curbing the spread of the epidemic. This observation may be attributed to the fact that at the early stages of an emergent pathogen, an ample supply of susceptible individuals can constrain the influence of climatic factors (9).
Over three years have passed since the COVID-19 pandemic was first identified in December 2019 (10), yet numerous factors that could influence the transmission dynamics of SARS-CoV-2, such as viral evolution and environmental drivers, remain unclear. The median duration between the initial and subsequent waves of COVID-19 was marginally shorter than the reported immunity period — approximately 8 months of immunity via vaccination, 12 months through infection, and over 12 months with both (1). Furthermore, there was no statistically significant rank correlation observed between the timing of the second wave of COVID-19 and socioeconomic factors. One possible explanation for this is the rapid evolution of SARS-CoV-2, which may play a crucial role in the timing of COVID-19’s second waves (2). If a new variant manages to evade the pre-existing immune response, even a recent infection may not guarantee protection.
The results of this study should be interpreted while bearing in mind two key limitations. Firstly, the primary source of COVID-19 surveillance data analyzed was obtained from the WHO, and potential discrepancies between different COVID-19 surveillance databases were not examined. Secondly, this investigation did not take into account certain factors that might influence the onset and intensity of subsequent waves, such as the enforcement of non-pharmaceutical interventions, including but not limited to, the regulation of international travel (11).
HTML
| Citation: |

|