
 Download:


-
Adverse pregnancy outcomes (APOs), including preterm birth, low birth weight, macrosomia, birth defects, and stillbirths, have significant effects on the health of mothers and newborns. Although the etiology of APOs is multifactorial, their prevalence is typically associated with population characteristics and socioeconomic conditions. Prior research at the individual level has indicated that the risk of APOs increases with reproductive age (1-2) and may also vary by parity (3). Moreover, there is a growing body of evidence demonstrating that social determinants, assessed at individual and/or aggregated levels, have a crucial impact on APOs (4).
Owing to China’s urban-rural socioeconomic disparities, the prevalence of APOs may differ based on factors such as health service utilization and lifestyle choices. By examining the primary determinants of these urban-rural gaps, policymakers can be provided with valuable insights to develop targeted public health policies, ultimately aiming to reduce urban-rural health inequalities.
We utilized data from the birth registration system within the Huaihe River Basin Birth and Birth Defects Monitoring Project in China, spanning from 2011 to 2020. This study included all birth records (inclusive of birth defect records) registered in four counties across different provinces: Mengcheng County in Anhui Province; Sheyang County in Jiangsu Province; Xiping County in Henan Province; and Wenshang County in Shandong Province. Data were derived from the national survey of population birth quality in these four provinces within the Huaihe River Basin, a project notable for its high-quality monitoring and data.
Employing SAS software (Version 9.4; SAS Institute, Cary, USA), we cleaned the registered records and merged samples from the four counties. Records with missing essential information were excluded to ensure the accuracy of statistical results. Following data cleaning, a total of 379,562 births and 62,328 APOs recorded from 2011 to 2020 were analyzed.
APOs were defined as preterm birth, low birth weight, macrosomia, birth defect, stillbirth, or any combination of these, and were categorized according to maternal residence in either urban or rural areas. Due to socioeconomic and population structure differences between urban and rural settings, along with varying degrees of change and development, crude APO rates may exhibit distinct characteristics. Consequently, it is essential to standardize crude APO rates.
We calculated standardized rates for urban and rural areas, allowing for comparison while controlling for population structure effects (parental age, parity) and regional differences. Subsequently, we decomposed the effects of these factors on APO rates and analyzed the temporal trends of these factors.
The algebraic formula utilized for the standardization and decomposition analysis of the prevalence of APOs is derived from Das Gupta’s method of standardization and decomposition (5).
$$ {T}_{\dots .}=\sum _{ijkl}\frac{{{T}_{ijkl}N}_{ijkl}}{{N}_{\dots .}} $$ (1) In formula (1),
$\dfrac{{N}_{ijkl}}{{N}_{\dots .}}$ can be written as$$ \frac{{N}_{ijkl}}{{N}_{\dots .}}={A}_{ijkl}{B}_{ijkl}{C}_{ijkl}{D}_{ijkl} $$ (2) $$ \begin{aligned} {A}_{ijkl}= & {\left(\frac{{N}_{ijkl}}{{N}_{.jkl}}\right)}^{\frac{1}{4}}{(\frac{{N}_{ijk.}}{{N}_{.jk.}}\cdot \frac{{N}_{ij.l}}{{N}_{.j.l}}\cdot \frac{{N}_{i.kl}}{{N}_{..kl}})}^{\frac{1}{12}}\\ & {(\frac{{N}_{i..l}}{{N}_{\dots l}}\cdot \frac{{N}_{i.k.}}{{N}_{..k.}}\cdot \frac{{N}_{ij..}}{{N}_{.j..}})}^{\frac{1}{12}}{\left(\frac{{N}_{i\dots }}{{N}_{\dots .}}\right)}^{\frac{1}{4}} \end{aligned} $$ (3) The variables i, j, k, and l represent paternal age, maternal age, parity, and region, respectively. The crude rate of APOs is represented by “T” while “N” refers to the number of births in urban areas. In formula (1), “Tijkl” and “Nijkl” denote the crude rate of APOs and number of births for the (i, j, k, l) categories in urban settings, respectively. Similarly, the crude rate in rural areas can be expressed using lowercase letters t and n.
The coefficients Bijkl, Cijkl, and Dijkl can be derived from equation (3) by interchanging the subscripts i and j,i and k,and i and l, respectively. For instance, N.jkl in (3) is transformed into Ni.kl in the expression for Bijkl. Similarly, the ratios nijkl/n can be expressed using the lowercase letters a, b, c, d, and n.
The urban-rural disparities can be represented by the summation of five distinct effects: rate effect, paternal age effect, maternal age effect, parity effect, and regional effect. Each of these effects can be understood as the difference between two standardized rates, which are given by the following:
$$ \begin{aligned} {T}_{\dots .}-{t}_{\dots .}= & \left[R\left(\stackrel-{T}\right)-R\left(\stackrel-{t}\right)\right]+ \left[I\left(\stackrel-{A}\right)-I\left(\stackrel-{a}\right)\right]+\\ &\left[J\left(\stackrel-{B}\right)-J\left(\stackrel-{b}\right)\right]+\left[K\left(\stackrel-{C}\right)-K\left(\stackrel-{c}\right)\right]+\\ &\left[L\left(\stackrel-{D}\right)-L\left(\stackrel-{d}\right)\right] \end{aligned}$$ (4) $$ \begin{aligned} \mathrm{R}\left(\stackrel-{T}\right)=& (I, J, K, L)-{\rm{standardized}}\; {\rm{rate}}\; {\rm{in}}\; {\rm{urban}}\; =\\ & \sum _{ijkl}\frac{\dfrac{{N}_{ijkl}}{{N}_{\dots .}}+\dfrac{{n}_{ijkl}}{{n}_{\dots .}}}{2}{T}_{ijkl} \end{aligned} $$ (5) $$ \begin{aligned} \mathrm{I}\left(\stackrel-{A}\right)= & (J, K, L, R)-{\rm{standardized}}\; {\rm{rate}}\; {\rm{in}}\; {\rm{urban}}\;=\\ & \sum _{ijkl}\frac{{T}_{ijkl}+{t}_{ijkl}}{2} \end{aligned} $$ (6) The standardized rates R(
$\bar {\rm{t}}$ ) and I(ā) for rural areas are obtained, respectively, from equations (5) and (6) by replacing$ {T}_{ijkl} $ in equation (5) with$ {t}_{ijkl} $ . Other standardized rates, such as J($ \stackrel{-}{b} $ ), K($ \stackrel{-}{C} $ ), K($ \stackrel{-}{c} $ ), L($ \stackrel{-}{D} $ ), and L($ \stackrel{-}{d} $ ) are derived from equation (6) by interchanging the respective letters. Standardization and decomposition calculations were performed in the present study using DECOMP(Version 2.0, Wang Jichuan, Wright State University, USA) (6).Figure 1 presents the crude and standardized rates of APO prevalence in urban and rural areas from 2011–2020, revealing three primary patterns throughout the decade. Initially, the crude prevalence of APOs followed comparable trends in both urban and rural settings, with declines noted in both areas between 2012–2017. However, the overall prevalence during that period remained higher in urban areas. Moreover, the prevalence gap between urban and rural areas narrowed during 2011–2016 but widened during 2017–2020. Lastly, after standardizing the prevalence rates, the urban-rural discrepancies exhibited different patterns, with a nearly equivalent prevalence between 2014 and 2016 (showing a mere 0.16% difference in 2016). These trends highlight factors such as parental age, parity, and regional characteristics that contribute to the urban-rural disparities in APOs.
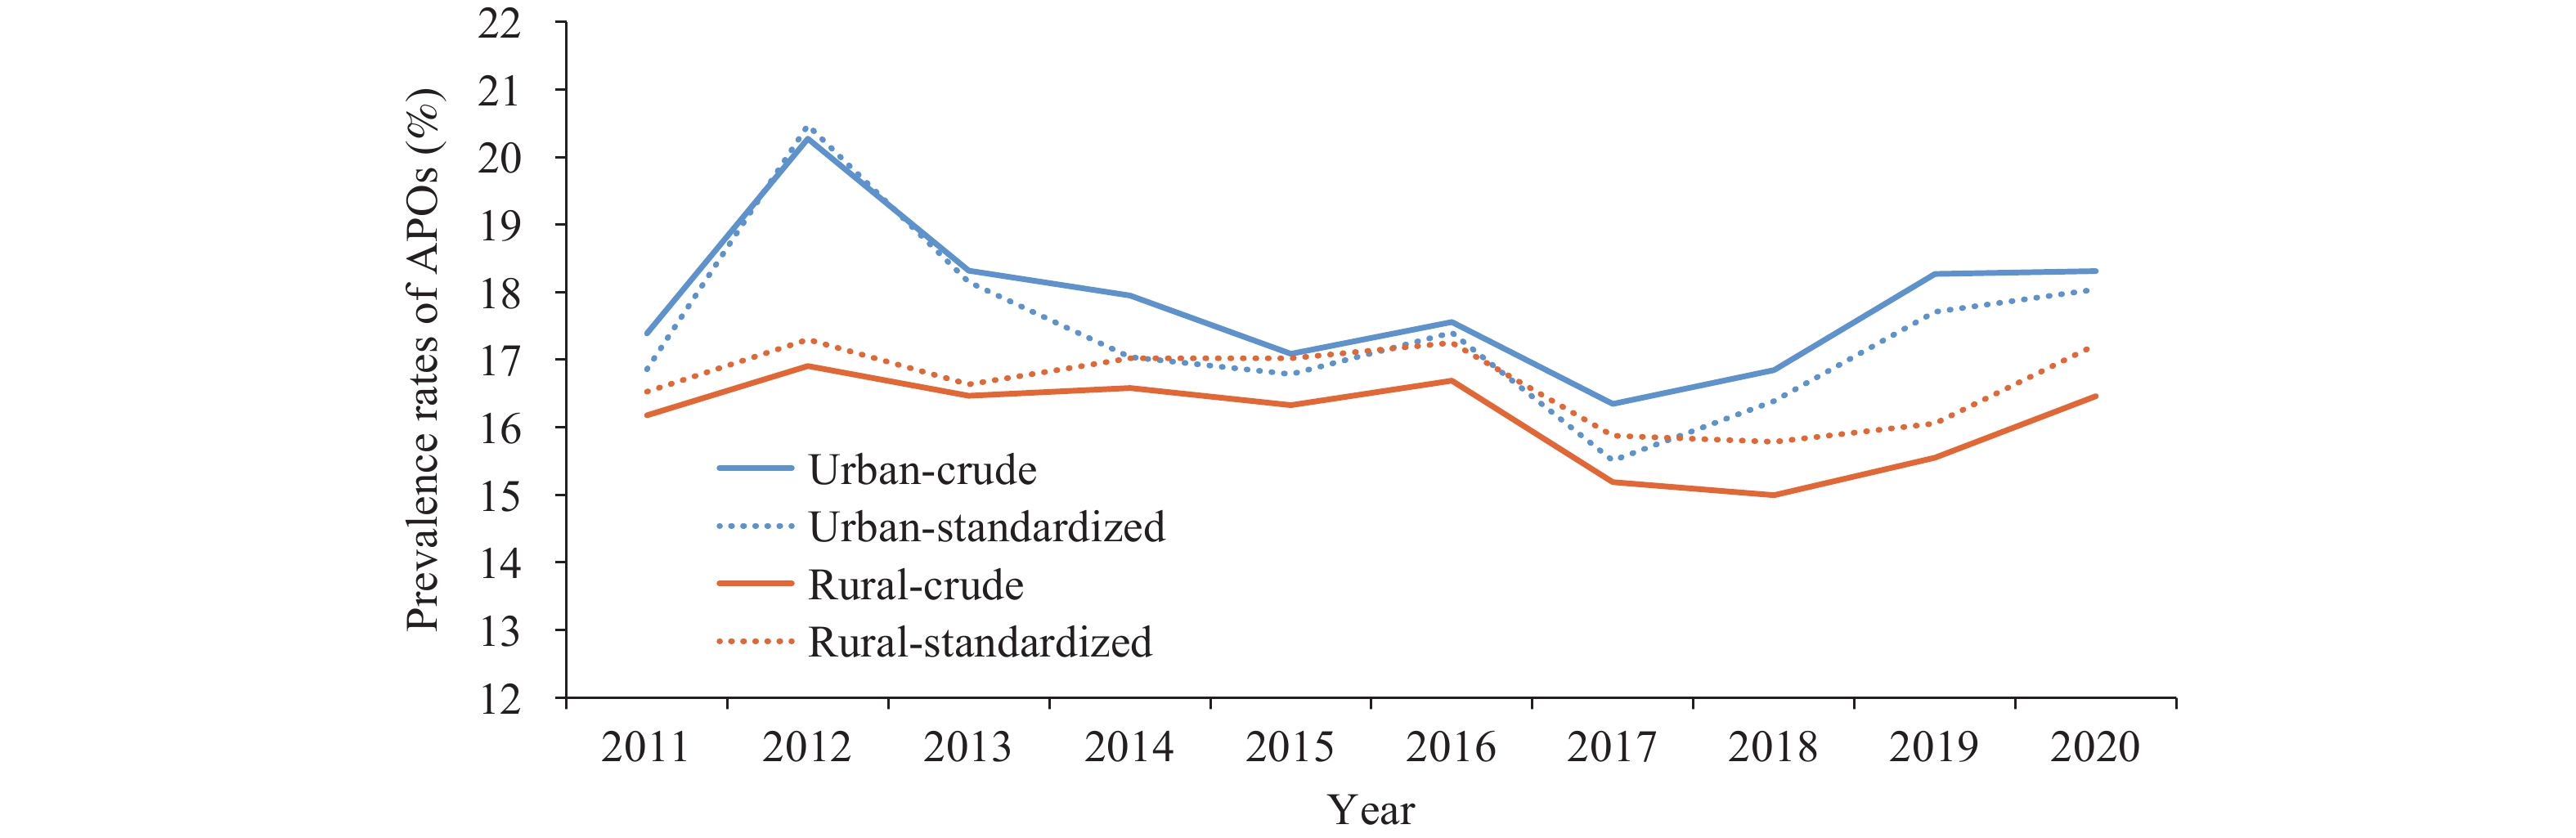 Figure 1.
Crude and standardized prevalence rates of APOs in urban and rural areas, 2011–2020.
Abbreviation: APOs=adverse pregnancy outcomes.Paternal age, maternal age, and parity were considered as demographic factors for the population composition, while the region was included as a factor for decomposition analysis to evaluate their impact on the prevalence of APOs (Table 1). The results indicate that these factors significantly contributed to the gap in APO prevalence between urban and rural areas. Plus and minus signs represent the direction of these factors. For instance, the paternal age effect contribution in 2011 was 38.94, suggesting the paternal age effect contributed to the widening urban-rural gap and accounted for approximately 38.94% of the difference in the crude rate of APOs. Paternal age, maternal age, and region effect tended to increase the urban-rural gap, while parity tended to decrease the gap in APO prevalence between urban and rural areas. Over the past decade, paternal and maternal ages exhibited similar patterns in their contributions to the gap between urban and rural areas, specifically, increasing continuously from 2012 to 2015 and then decreasing after 2015.
Factors 2011 2012 2013 2014 2015 2016 2017 2018 2019 2020 Paternal age Urban-standardized 16.67 18.67 17.28 16.99 16.76 17.26 15.74 16.03 16.81 17.59 Rural-standardized 16.20 18.41 16.97 16.53 16.43 16.88 15.27 15.75 16.58 17.30 Difference −0.47* −0.26* −0.31* −0.46* −0.33* −0.38* −0.47* −0.28* −0.23* −0.29* Contributions 38.94 7.75 16.78 33.42 43.48 43.70 40.49 15.10 8.46 15.71 Maternal age Urban-standardized 16.59 18.72 17.31 16.94 16.82 17.25 15.72 16.01 16.82 17.55 Rural-standardized 16.28 18.38 16.95 16.57 16.38 16.91 15.30 15.78 16.57 17.34 Difference −0.31* −0.34* −0.36* −0.37* −0.44* −0.34* −0.42* −0.23* −0.25* −0.21* Contributions 25.68 10.13 19.49 26.88 57.97 39.10 36.18 12.40 9.20 11.38 Parity Urban-standardized 16.32 18.31 16.87 16.70 16.47 16.97 15.55 15.87 16.69 17.35 Rural-standardized 16.59 18.78 17.39 16.84 16.76 17.22 15.53 15.95 16.74 17.56 Difference −0.06* −0.07* −0.06* −0.05 −0.06* −0.05* −0.05 −0.06 −0.05 −0.08* Contributions −22.37 −14.01 −28.15 −10.17 −38.21 −28.75 1.72 −4.31 −1.84 −11.38 Region Urban-standardized 16.64 18.57 17.22 17.11 16.84 17.21 15.84 16.32 17.03 17.82 Rural-standardized 16.28 18.51 17.04 16.43 16.35 16.96 15.23 15.49 16.39 17.08 Difference −0.36* −0.06 −0.18 −0.68* −0.49* −0.25 −0.61* −0.83* −0.64* −0.74* Contributions 29.83 1.79 9.74 49.41 64.56 28.75 52.55 44.76 23.54 40.09 Note: Standard errors were estimated using bootstrapping with 200 resamples.
Abbreviation: APOs=adverse pregnancy outcomes.
* P<0.05.Table 1. The urban-rural difference of standardized rates (%) and contributions (%) of each factor in rates of APOs by standardization and decomposition, 2011–2020.
Although no measurable variables for regional character were identified, the region itself may serve as an indicator of socioeconomic development status. Furthermore, the region contributed to the observed gap. Between 2011 and 2013, the region’s proportion of contribution was lower than that of paternal age. However, after 2013, the proportion of contribution attributed to the region increased, becoming similar to paternal age between 2013 and 2016, and emerging as the primary factor influencing urban-rural differences after 2017. In the case of parity, its proportion of contribution to narrowing the gap declined after 2017. It is noteworthy that since 2013, the proportion of contribution by the region has risen, paralleling paternal age during 2013–2016, and becoming the main determinant of urban-rural disparities after 2017.
In examining the general decomposition results, we further compared the age composition of parents, who serve as the primary sources of urban-rural differences in APO prevalence. Due to adjustments in the national family planning policy, there has been a shift in the age structure of parents. We classified the parents into four age groups: under 25 years, 25–29 years, 30–34 years, and 35 years or older. While controlling for region and parity once more, the contributions of each parental age group are illustrated in Figure 2.
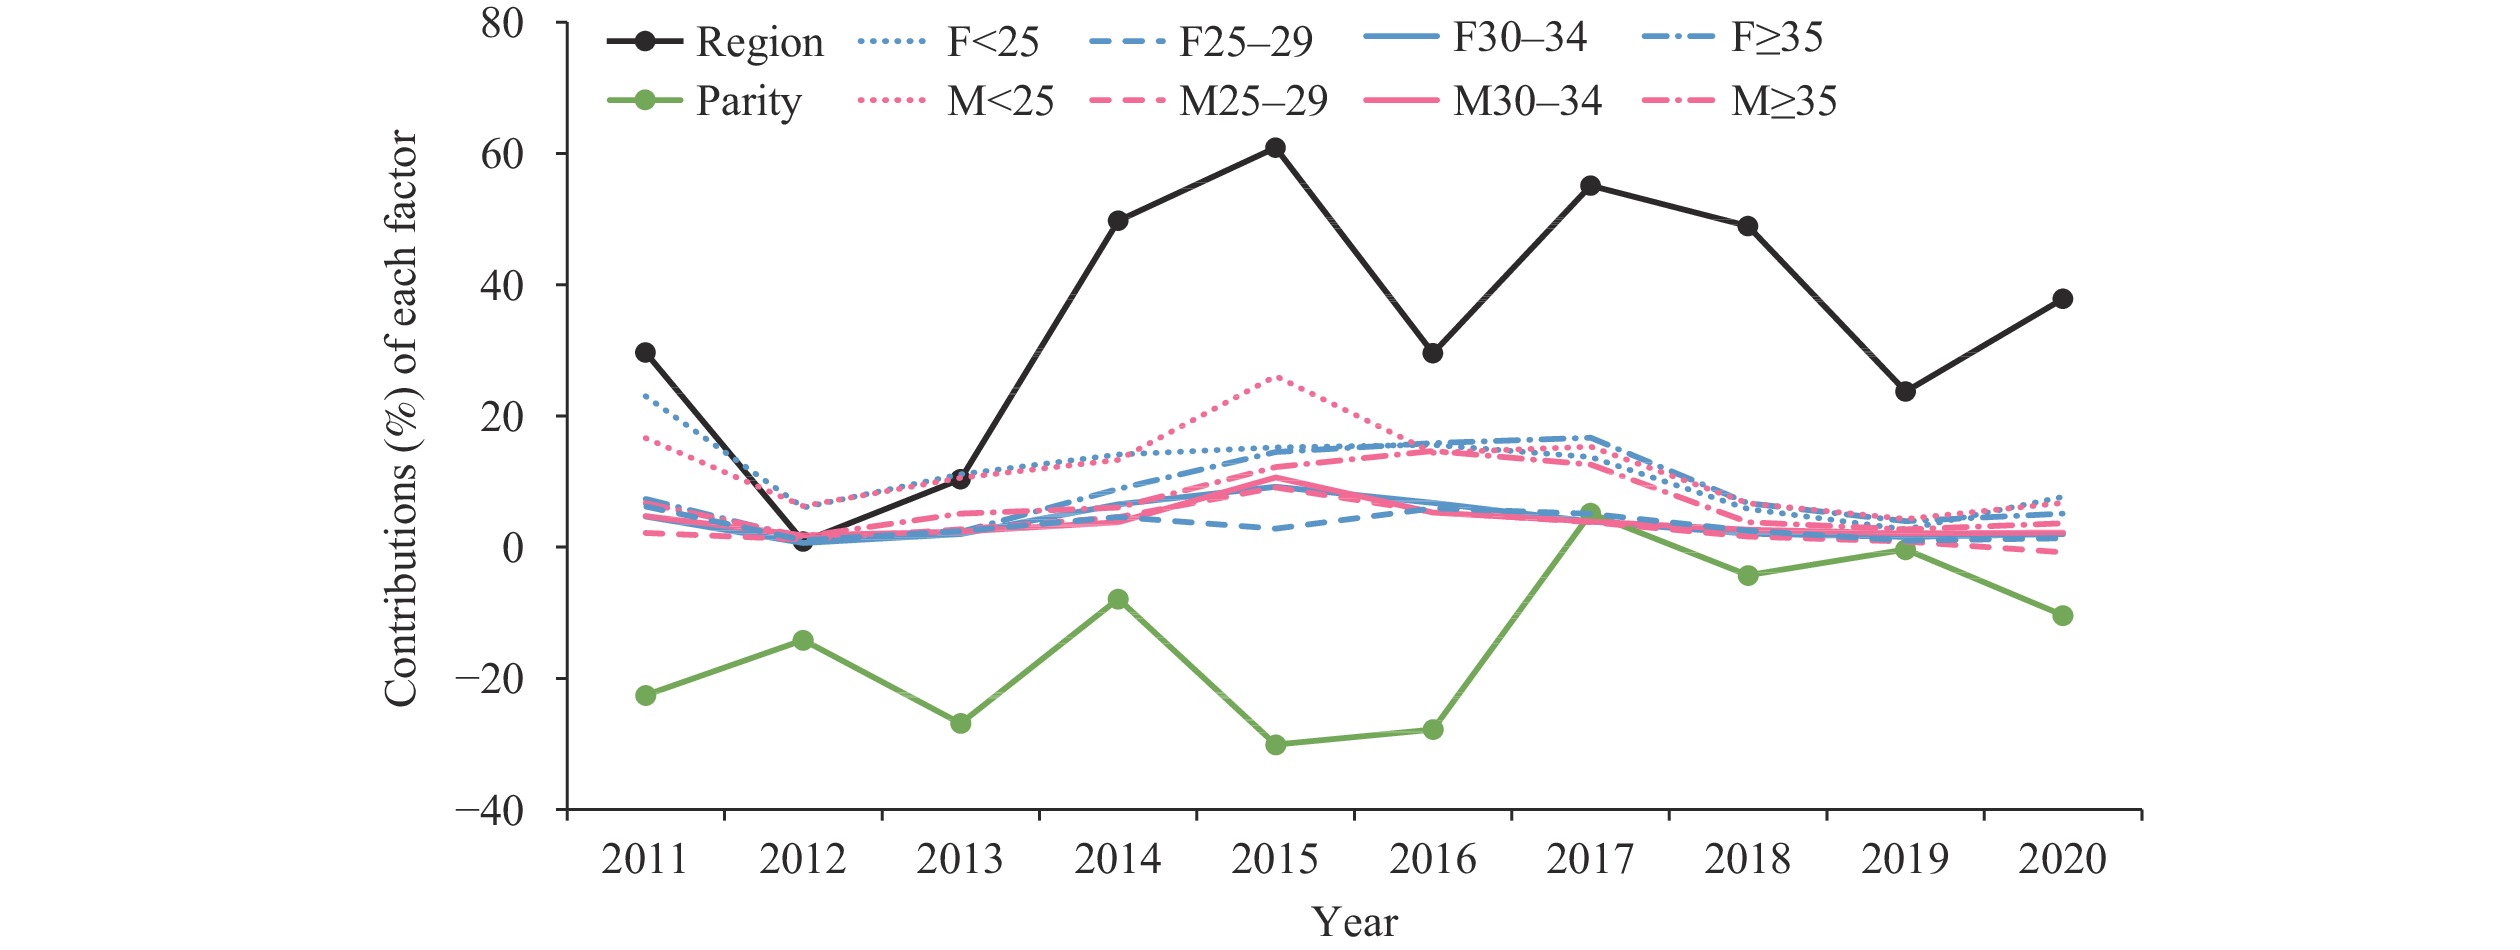 Figure 2.
Percentage contributions of each factor to the prevalence of adverse pregnancy outcomes, categorized by age group form 2011 to 2020.
Note: M is mother’s age, and F is father’s age.The findings reveal distinct temporal trends in the urban-rural gap concerning age. Prior to 2016, the disparity was predominantly linked to parents under 25 years old. The influence of advanced paternal age (over 35 years old) emerged in 2013 and attained a level comparable to that of the younger group by 2016. The impact of various age groups showed a decline after 2017.
-
Consistent with previous research, our findings indicate a disparity in the prevalence of APOs between urban and rural settings, with higher incidence rates observed in urban areas (7–8). In the present study, we employed standardization and decomposition analysis (SDA) techniques to assess various factors contributing to the standardized rate and identify the underlying “urban-rural gap” in APO prevalence. Additionally, by utilizing a decade’s worth of data, we extended the application of SDA to facilitate the decomposition of these factors and enable a temporal comparison.
We discovered that both parental ages under 25 years old and advanced paternal age (>35 years old) contributed to the disparity in the prevalence of APOs. This finding aligns with previous conclusions drawn from individual studies (1–3), indicating that low or high parental age constitutes a risk factor for adverse pregnancy outcomes. The impact of parental age on the urban-rural gap rose steadily from 2012 to 2015 and subsequently declined after 2015. This trend might be associated with urban and rural marriage arrangements aligning with Chinese traditions. Additionally, the proportion of parents aged 30 and above increased continuously until 2016 and then decreased.
Following the implementation of the two-child policy, an increase in births at advanced parental age as well as the proportion of second and third children led to higher risks of APOs (8–9). However, our study’s results reveal a minimal increase in the prevalence of APOs after 2013 and 2015, with parity demonstrating a negative effect on urban-rural differences. This outcome could be attributed to advancements in healthcare service utilization, medical resources, socioeconomic development, and pregnant women’s health behavior knowledge. Nonetheless, the parity effect has diminished since 2017, possibly due to a reduced disparity in the proportion of multiparous mothers after 2017.
Region is a significant factor associated with urban-rural differences, which aligns with previous studies’ conclusions that APOs are related to socioeconomic levels (4,10). This finding implies that the urban-rural gap varies across different regions. For instance, in our study, the urban and rural per capita disposable incomes within each county were compared over the past decade, revealing that the economic disparities between urban and rural areas fluctuated and varied in different regions.
As a consequence of socioeconomic development and improvements in women’s education, the postponement of childbearing has become more prevalent, which is evident in the decreased impact of the four age groups on urban-rural differences since 2017. Moreover, certain national policies have been implemented to reduce health service disparities and promote equity in service accessibility between urban and rural areas. Considering these factors, it is clear that each region requires customized policies to address their distinct needs. As a result, it is recommended that policymakers adopt targeted strategies for different regions to accommodate specific circumstances.
In China, national and provincial governments have implemented various programs targeting rural and impoverished areas to reduce disparities in women’s reproductive, maternal, newborn, child, and adolescent health (RMNCAH). However, our findings indicate that for the elimination of inequalities between urban and rural residents, attention should be directed towards demographic composition and fertility characteristics within diverse regions. Consequently, targeted interventions may serve as a more effective approach in promoting equity in healthcare access. Additionally, when comparing the incidence of APOs among different regions and evaluating the effectiveness of interventions and policies, greater consideration should be given to the regional population structures.
In our study, we have analyzed data from 10 years, but in the early stages of this project, the quality of these data is relatively low, with possible omissions, misstatements, and non-standard measurement of body weight, resulting in a certain degree of bias in the results. In addition, numerous factors influence APOs, with distinct risk factors associated with each specific outcome. In the present study, APOs encompass a combination of five outcome measures. However, the demographic characteristics examined in the analysis were limited to parental age and parity, excluding additional factors. This limitation may introduce minor biases in the analysis results, potentially leading to overestimations or underestimations of the impacts of the two demographic factors. Consequently, future research should expand the sample size and conduct further investigation into the disparities between urban and rural populations in relation to various APOs.
-
Our deepest gratitude goes to the personnel responsible for project management, data collection and submission. And we’d also like to appreciate the support of all the medical institutions involved, and the staff in the monitoring regions for providing detailed information to help us in the data clearance.
HTML


| Citation: |

|