

 Download:


-
Breast cancer became the most commonly diagnosed form of cancer worldwide in 2020, with approximately 2.3 million women affected, surpassing the number of new cases of lung cancer for the first time. It is still the primary cause of cancer mortality in women and is also the fifth most common cause of cancer deaths globally (1). China had 24% of newly diagnosed cases and 30% of cancer-related deaths worldwide in 2020 (2). The age-standardized incidence of breast cancer increased from 17.07 per 100,000 in 1990 to 35.61 per 100,000 in 2019 over the past three decades (3). Early detection, along with available, low-cost, and effective treatment, can result in improved cancer staging upon presentation and reduced mortality. To combat this rising incidence of breast cancer since the 1990s, China implemented a free screening program nationally in 2009 for rural women aged 35–64 years. During the course of the study, 18.9% of all women aged 20 and above and 25.7% of women aged 35 to 64 participated in breast cancer screening (4), slightly higher than rates in the early 2010s (5). This study aimed to provide an update on the current status of breast cancer screening levels in China, estimating the screening rates across subgroups using the latest nationally and provincially representative surveillance data. The findings showed that 22.3% of women aged 20 years and above and 30.9% of women aged 35–64 years had ever participated in breast cancer screening in China. Lower screening uptake was noted among women from lower socioeconomic status (SES); with considerable variations observed across provincial-level administrative divisions (PLADs).
This study utilized data from the sixth field survey named China Adults Chronic Disease and Nutrition Surveillance, which is part of the China Chronic Disease and Risk Factor Surveillance (CCDRFS), to estimate the latest uptake of breast cancer screening in China (6). The field survey was conducted from August 2018 to June 2019 in 298 districts/counties across all 31 PLADs directly under the central government in Chinese mainland. A multistage and cluster randomized sampling approach was used to select adults aged 18 years or older who had lived at their residence for more than 6 months in the past year, were not pregnant, and did not have serious health conditions or illnesses that would prevent participation, including intellectual disability or language disorders. Trained local health staff conducted interviews with all participants to collect information on major chronic diseases and related risk factors. Female participants were also asked about their breast cancer screening history and the date of their most recent screening, if applicable. The Ethical Committee of the National Center for Chronic and Noncommunicable Disease Control and Prevention and Chinese Center for Disease Control and Prevention approved the CCDRFS survey, and all participants provided written informed consent. A total of 184,876 participants completed the survey, yielding a response rate of 97.4%. After data cleaning, 184,509 participants (including 109,317 females) were included in the basic database. For the final analysis, 15,354 female participants were excluded due to their age being less than 20 years old, having incomplete sociodemographic data, or lacking responses to the breast cancer screening questions. All estimates were weighted based on China’s 2010 census, which was released by the National Bureau of Statistics. The chi-square test was used to analyze differences in unordered categorical variables, and logistic regression was employed to investigate trends with ordered categorical variables. A multiple logistic regression analysis based on complex sampling design was conducted, and standard errors (SEs) were estimated using Taylor linearization with a finite population correction. Statistical significance was determined using a two-sided P-value of less than 0.05. All statistical analyses were performed using SAS software (version 9.4, SAS Institute Inc., Cary, USA).
This study included a total of 93,963 female participants who were 20 years of age or older. As of 2018–2019, 54.8% of Chinese women lived in rural areas, 37.3% had received primary school education or less, and 46.4% had undergone health examinations within the past three years (Table 1).
Characteristic No. of participants (N=93,963) Weighted proportion (%)* Age (years) 20–29 5,047 24.2 30–39 10,178 21.0 40–49 17,921 22.3 50–59 25,555 15.4 60–69 24,377 9.5 70 and above 10,885 7.7 Residence Urban 44,176 45.2 Rural 49,787 54.8 Location East 35,196 42.2 Middle 27,851 32.4 West 30,916 25.5 Education Primary or less 51,956 37.3 Secondary 24,755 29.9 High 10,640 14.7 College or above 6,612 18.0 Household income per capita (CNY) Q1 (<7,200) 17,022 15.3 Q2 (7,200–14,999) 19,310 19.0 Q3 (15,000–24,999) 16,170 18.0 Q4 (25,000 and above) 20,672 25.7 Don’t know/refused 20,789 21.9 Employment status Employed 57,093 66.3 Housework 21,016 19.5 Retired 11,013 6.0 Unemployed 4,841 8.2 Health examination in the past 3 years No 56,992 53.6 Yes 36,971 46.4 Self-assessed health status Poor or fair 47,820 54.1 Good 46,143 45.9 Abbreviation: CNY=Chinese Yuan.
* Proportions are weighted to represent the national total population with poststratification for age, and urban/rural residence.Table 1. Sociodemographic characteristics of female participants aged 20 years and above, 2018–2019.
In 2018–2019, among women aged 20 years and above, 22.3% [95% confidence interval (CI): 21.1%–23.5%] of women reported undergoing at least one lifetime screening for breast cancer. The rate was higher in women aged 35 to 64 years with a prevalence of 30.9% (95% CI: 29.2%–32.5%) (Table 2). When considering the past three years, 20.5% of women had undergone screening. The highest ever screening rate was among women aged 40–49 years, with a prevalence of 36.0% (95% CI: 33.9%–38.2%), while women aged 70 years and above had the lowest screening rates (4.3%, 95% CI: 3.7%–4.9%). The study also found that reporting breast screening was less likely among women with the lowest education level (16.6%, 95% CI: 15.3%–18.0%) or income (17.2%, 95% CI: 15.4%–19.1%), unemployed women (14.8%, 95% CI: 12.6%–17.0%), and women who had not undergone a health examination during the past 3 years (14.3%, 95% CI: 13.2%–15.4%). Urban women (24.5%, 95% CI: 22.4%–26.6) were more likely to undergo screening than rural women (20.6%, 95% CI: 18.8%–22.4%). Additionally, women living in eastern China had higher screening rates (27.0%, 95% CI: 25.1%–29.0%) than those in central (20.6%, 95% CI: 18.3%–22.8%) and western China (16.7%, 95% CI: 14.9%–18.6%).
Sociodemographic variable Screening rates among 20 years and above Screening rates among 35–64 years Ever screened (%) (95% CI) Screened in 3 years (%)
(95% CI)Ever screened (%) (95% CI) OR (95% CI) Total Urban Rural P value* Total 22.3 (21.1, 23.5) 24.5 (22.4, 26.6) 20.6 (18.8, 22.4) <0.0001 20.5 (19.3, 21.7) 30.9 (29.2, 32.5) Age (years) 20–29 10.8 (9.1, 12.6) 11.5 (8.7, 14.2) 10.3 (8.2, 12.4) 0.5242 10.6 (8.9, 12.3) – – 30–39 27.3 (25.5, 29.2) 29.8 (27.2, 32.4) 25.3 (22.3, 28.2) 0.0413 25.7 (23.7, 27.6) – – 40–49 36.0 (33.9, 38.2) 39.2 (35.6, 42.8) 33.7 (30.5, 36.9) 0.0510 33.4 (31.3, 35.4) – – 50–59 27.3 (25.4, 29.1) 31.1 (28.1, 34.2) 24.5 (21.7, 27.3) 0.0075 24.3 (22.6, 26.0) – – 60–69 14.7 (13.5, 16.0) 19.2 (17.1, 21.3) 11.5 (9.5, 13.5) <0.0001 12.4 (11.2, 13.6) – – 70 and above 4.3 (3.7, 4.9) 6.6 (5.4, 7.8) 2.7 (2.0, 3.4) <0.0001 3.4 (2.8, 3.9) – – P value for difference <0.0001 <0.0001 <0.0001 <0.0001 Residence Urban – – – 22.7 (20.7, 24.7) 34.4 (31.7, 37.2) 1.00 (Reference) Rural – – – 18.8 (17.1, 20.6) 28.2 (25.7, 30.8) 1.11 (0.86, 1.43)§ P value for difference <0.0001 <0.0001 Geographic location East 27.0 (25.1, 29.0) 29.2 (26.2, 32.2) 24.7 (21.2, 28.1) 0.1018 25.1 (23.2, 27.1) 37.1 (34.5, 39.6) 1.58 (1.33, 1.88) Middle 20.6 (18.3, 22.8) 22.1 (17.7, 26.5) 19.6 (17.2, 22.1) 0.3440 18.5 (16.3, 20.6) 28.8 (25.7, 31.9) 1.22 (0.99, 1.50) West 16.7 (14.9, 18.6) 17.5 (14.6, 20.5) 16.2 (13.6, 18.8) 0.5390 15.5 (13.8, 17.3) 23.5 (20.9, 26.2) 1.00 (Reference) P value for difference <0.0001 <0.0001 0.0003 <0.0001 <0.0001 Education Primary or less 16.6 (15.3, 18.0) 16.3 (13.8, 18.9) 16.7 (15.0, 18.4) 0.8299 15.0 (13.7, 16.3) 22.2 (20.3, 24.0) 1.00 (Reference) Secondary 25.1 (23.3, 26.9) 25.9 (23.3, 28.4) 24.7 (22.0, 27.3) 0.5658 22.9 (21.2, 24.6) 33.8 (31.7, 35.8) 1.41 (1.23, 1.62)§ High 27.5 (25.1, 29.9) 29.0 (25.9, 32.1) 25.3 (21.3, 29.3) 0.1867 25.5 (23.2, 27.8) 39.0 (35.8, 42.2) 1.40 (1.15, 1.70)§ College or above 25.2 (22.8, 27.7) 26.6 (23.9, 29.2) 20.3 (15.0, 25.6) 0.0573 24.1 (21.7, 26.5) 48.7 (45.2, 52.2) 1.84 (1.49, 2.28)§ P value for trend <0.0001 <0.0001 <0.0001 <0.0001 <0.0001 Household income per capita (CNY) Q1 (<6,000) 17.2 (15.4, 19.1) 16.2 (12.6, 19.8) 17.5 (15.4, 19.6) 0.5789 15.4 (13.7, 17.2) 23.7 (21.1, 26.2) 1.00 (Reference) Q2 (6,000–12,499) 19.1 (17.7, 20.6) 19.7 (17.5, 21.9) 18.9 (16.9, 20.8) 0.6290 17.8 (16.3, 19.2) 26.9 (25.0, 28.8) 1.08 (0.93, 1.24) Q3 (12,500–23,999) 24.4 (22.4, 26.4) 24.4 (22.0, 26.9) 24.4 (21.3, 27.6) 0.9978 22.5 (20.6, 24.4) 33.4 (31.2, 35.7) 1.21 (1.04, 1.40) Q4 (24,000 and above) 29.7 (27.6, 31.7) 30.0 (27.4, 32.6) 28.9 (24.5, 33.3) 0.7105 27.4 (25.3, 29.4) 40.8 (38.5, 43.1) 1.36 (1.16, 1.58) Don’t know or refused 18.3 (16.5, 20.1) 20.1 (17.3, 23.0) 16.8 (14.4, 19.3) 0.1148 17.0 (15.2, 18.7) 25.6 (22.9, 28.3) 0.93 (0.79, 1.11) P value for trend† <0.0001 <0.0001 <0.0001 <0.0001 <0.0001 Employment status Employed 23.7 (22.4, 25.1) 26.7 (24.4, 28.9) 21.6 (19.6, 23.6) 0.0035 22.1 (20.8, 23.4) 31.6 (29.8, 33.3) 1.00 (Reference) Housework 19.4 (17.5, 21.4) 20.2 (16.7, 23.6) 19.1 (16.6, 21.6) 0.6575 17.8 (15.9, 19.7) 28.1 (25.8, 30.4) 1.01 (0.92, 1.11) Retired 26.1 (23.5, 28.6) 26.1 (23.4, 28.8) 25.6 (12.8, 38.3) 0.9390 21.4 (18.9, 23.9) 33.1 (29.7, 36.6) 0.95 (0.81, 1.11) Unemployed 14.8 (12.6, 17.0) 15.3 (12.5, 18.1) 14.2 (10.6,17.7) 0.6478 13.9 (11.7, 16.1) 28.7 (24.7, 32.7) 0.90 (0.72, 1.22) P value for difference <0.0001 <0.0001 0.0068 <0.0001 0.0085 Health examination in past 3 years No 14.3 (13.2, 15.4) 13.1 (11.4, 14.9) 14.9 (13.5, 16.4) 0.1577 12.5 (11.5, 13.6) 19.4 (17.9, 20.9) 1.00 (Reference) Yes 31.8 (30.2, 33.4) 33.4 (31.2, 35.7) 29.8 (27.3, 32.4) 0.0628 30.0 (28.4, 31.6) 45.6 (43.7, 47.6) 3.17 (2.95, 3.41) P value for difference <0.0001 <0.0001 <0.0001 <0.0001 <0.0001 Self-assessed health status Poor or fair 23.0 (21.6, 24.4) 25.9 (23.7, 28.1) 20.8 (18.8, 22.8) 0.0026 21.0 (19.7, 22.4) 31.1 (29.3, 32.9) 1.15 (1.05, 1.27) Good 21.6 (20.2, 22.9) 23.1 (20.7, 25.4) 20.3 (18.2, 22.3) 0.1232 20.0 (18.6, 21.3) 30.6 (28.6, 32.6) 1.00 (Reference) P value for difference 0.0464 0.0053 0.5666 0.1275 0.6084 Note: The screening rates presented in this study are weighted proportions that have been adjusted for age through poststratification to ensure representation of the entire national population.
Abbreviation: CI=confidence interval; CNY=Chinese Yuan.
* P value denotes the difference between urban screening coverage and rural screening coverage in women aged 20 years and above.
† Participants who responded with “don’t know/refused” were excluded from the calculation.
§ The model accounted for the interaction between residence and education.Table 2. Breast cancer screening rates among Chinese adult women by sociodemographic factors ― China, 2018–2019.
A multivariate logistic regression analysis was conducted on women between the ages of 35 and 64. Results showed that the odds of receiving breast cancer screening were higher among rural women compared to urban women [odds ratio (OR)=1.25, 95% CI: 1.03–1.50]. However, the likelihood of breast cancer screening in eastern China was still higher compared to western China (OR=1.58, 95% CI: 1.33–1.88). Additionally, the odds of screening were three times higher among women who had received a health examination within the past three years compared to those who had not (OR=3.17, 95% CI: 2.95–3.41) (Table 2).
In Beijing, over 40% of women aged 20 years and above and more than 60% of women aged 35–64 years underwent screening, and in economically developed eastern coastal PLADs such as Jiangsu Province, Zhejiang Province, Tianjin, and Shanghai, more than 30% of women aged 20 years and above and 40% of women aged 35–64 years underwent screening. In contrast, the Xizang (Tibet) Autonomous Region, Guizhou Province, and Hebei Province demonstrated the lowest rates of screening, all below 10%. Refer to Figure 1 for more details.
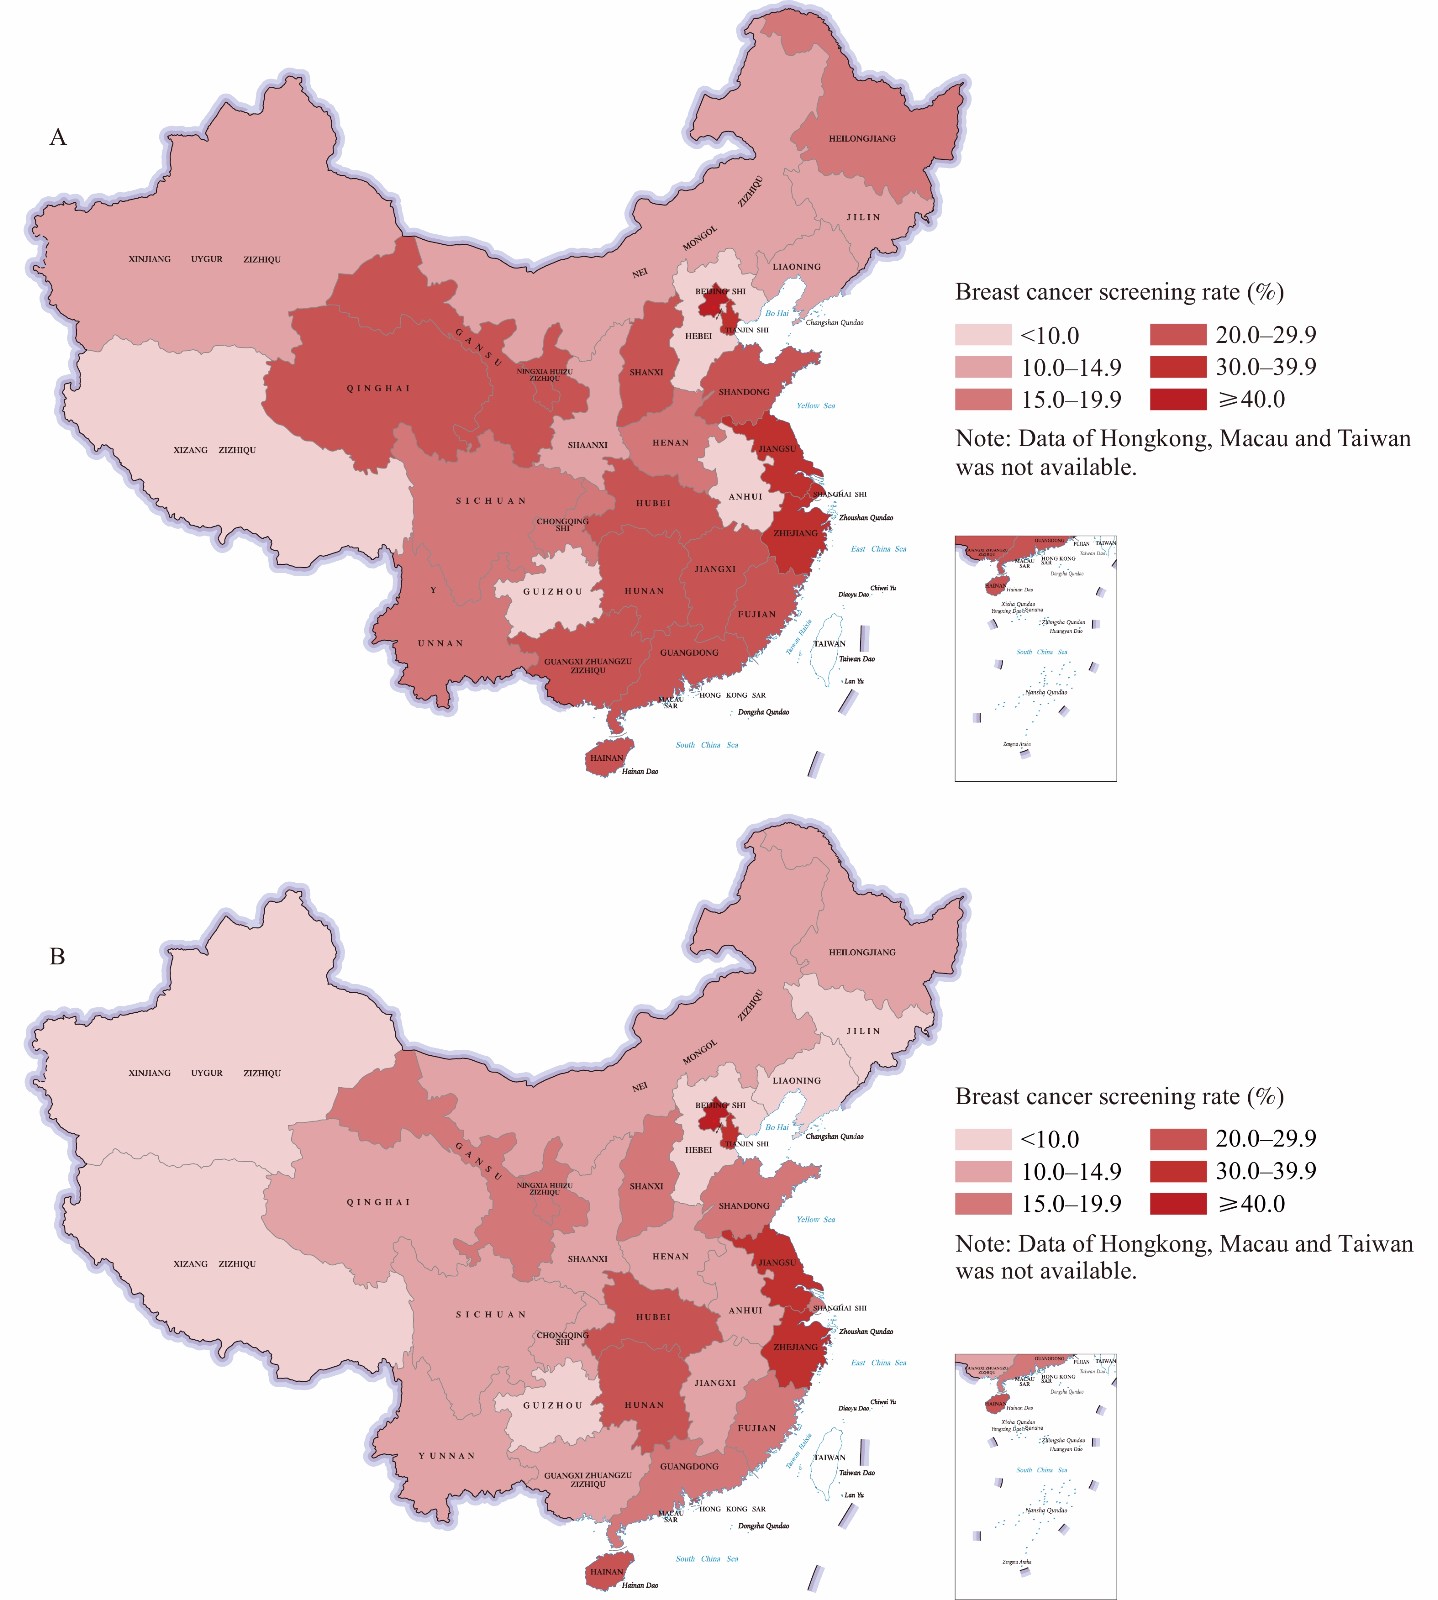 Figure 1.
Provincial variations in breast cancer screening coverage in adult women in China, 2018–2019. (A) Screening rates among 20 years and above; (B) Screening rates among 35–64 years.
-
According to the findings of the China CDC, the use of breast cancer screening among adult women in China continues to be inadequate. Although there has been a slight increase in breast cancer screening rates for women aged 20 years and above, as well as for those aged 35–64 years, when compared to the statistics of 2015, the breast cancer screening coverage is still way below the standard in developed countries (7). As of 2018, more than 1,700 counties had conducted breast cancer screening programs (8). Since 2022, the scope of free screening services has been broadened to include both urban and rural women. However, this study reveals that despite the expansion of breast cancer screening programs, the proportion of women availing of screening services is still considerably low.
Numerous factors have the potential to restrict the uptake of cancer screening in women, including but not limited to low socioeconomic status, cultural barriers, and cancer fatalism (9). Upon conducting this study, we discovered that women who underwent health examinations were significantly more likely to obtain cancer screening even when other potential restricting factors were accounted for. This outcome underscores the significance of both accessible health services and effective health education.
There are two limitations to be taken into account. Initially, the self-reported screening history may have been subject to recall bias. To minimize this, the interviewers were instructed to carefully define and explain the types of breast cancer screening and assist participants in recalling the timing of their last test. Second, the CCDRFS did not collect information on the reasons for non-participation in screening.
Based on nationally and provincially representative survey data from 2018–2019, this study provides the most current estimate of breast cancer screening coverage in China. Women aged 20 years and older had a breast cancer screening coverage of 22.3%, while women aged 35–64 years had a coverage of 30.9%. Women with lower socioeconomic status had lower screening coverage, and there were still significant disparities across PLADs. To increase the utilization of breast cancer screening, it is crucial to continue national and local policies and provide financial support for breast cancer screening services. Additionally, health education and accessibility of health services should be strengthened, particularly in targeted age groups, those with low SES, and underdeveloped PLADs, to encourage more women to participate in screening.
-
No conflicts of interest.
HTML
| Citation: |

|