
 Download:


-
Sentinel surveillance of influenza-like illness (ILI) has been recommended by the World Health Organization (WHO) for influenza surveillance for many years due to its sensitivity and rapidity, although it is less specific (1). Other respiratory viruses, including rhinovirus, respiratory syncytial virus, parainfluenza, adenovirus, and severe acute respiratory syndrome coronavirus 2 (SARS-CoV-2), can also present as ILI (2–7). The China National Influenza Surveillance Network (CNISN) reached its current scale in 2009, consisting of 554 national-level sentinel hospitals and 410 national influenza surveillance network laboratories, as well as hundreds of provincial-level sentinels. During the coronavirus disease 2019 (COVID-19) pandemic, SARS-CoV-2 and influenza virus can be tested simultaneously (8). Integrated sentinel surveillance of influenza virus and SARS-CoV-2 can guide public health responses to both public health problems concurrently. SARS-CoV-2 has undergone constant variation, resulting in changes in its pathogenicity and transmissibility (9). On December 7, 2022, the Comprehensive Group of Joint Prevention and Control Mechanism for the State Council’s Response to COVID-19 Epidemic optimized prevention and control policies. To gain insight into the epidemic trends and provide risk assessment of SARS-CoV-2 in China, this study analyzed the positive rate of SARS-CoV-2 and influenza virus reported by the network laboratories, as well as the ILI cases reported by sentinel hospitals in outpatient and emergency departments.
-
ILI is characterized by fever (temperature ≥38 ℃) and cough or sore throat. ILI surveillance has been a common symptom surveillance method adopted by WHO member countries around the world over the years.
The percentage of ILI (ILI%) cases among all patients of the sentinel hospitals’ surveillance departments was calculated. These departments included: 1) Internal Medicine Outpatient and Internal Medicine Emergency; 2) Pediatric Outpatient and Pediatric Emergency; and 3) Fever Clinic.
-
Data on ILI were reported by 824 sentinel hospitals, including 546 national influenza surveillance sentinel hospitals and 278 non-national level sentinel hospitals, and were downloaded from the China National Influenza Sentinel Surveillance System (CNISIS). From December 1, 2022 to February 12, 2023 (sample collection date), 402 national influenza surveillance network laboratories submitted their real-time reverse transcription polymerase chain reaction (rRT-PCR) testing results for SARS-CoV-2 and seasonal influenza viruses. Laboratories were required to test both SARS-CoV-2 and influenza virus for each sample; this study only includes samples that were tested for both simultaneously. Sentinel hospitals collected samples of ILI cases and sent them to the network laboratories in viral transportation medium for testing. rRT-PCR testing was conducted according to the influenza and COVID-19 national surveillance guide.
-
A total of 92,304,428 outpatient and emergency visit cases were reported by 31 provincial-level administrative divisions and the Xinjiang Production and Construction Corps from September 4, 2022 to February 12, 2023. Of these, 3,512,735 were ILI cases (3.8%). From September to early December 2022, the weekly number of ILI cases in sentinel hospitals ranged from 85,000 to 124,000, with ILI percentages fluctuating between 2.7% and 3.2%. Starting from December 12, 2022 (Week 50), the ILI percentage in Chinese mainland showed a rapid increase, with ILI percentages of 3.6% (Week 49) and 8.5% (Week 50), respectively. In Week 51, the ILI percentage reached its peak of 12.1%. Subsequently, it began to decline dramatically from Week 52 (7.6%). By Week 6, 2023 (February 6–12), it had decreased to 1.4% (Figure 1), with both ILI cases and ILI percentages lower than the levels at the beginning of December 2022.
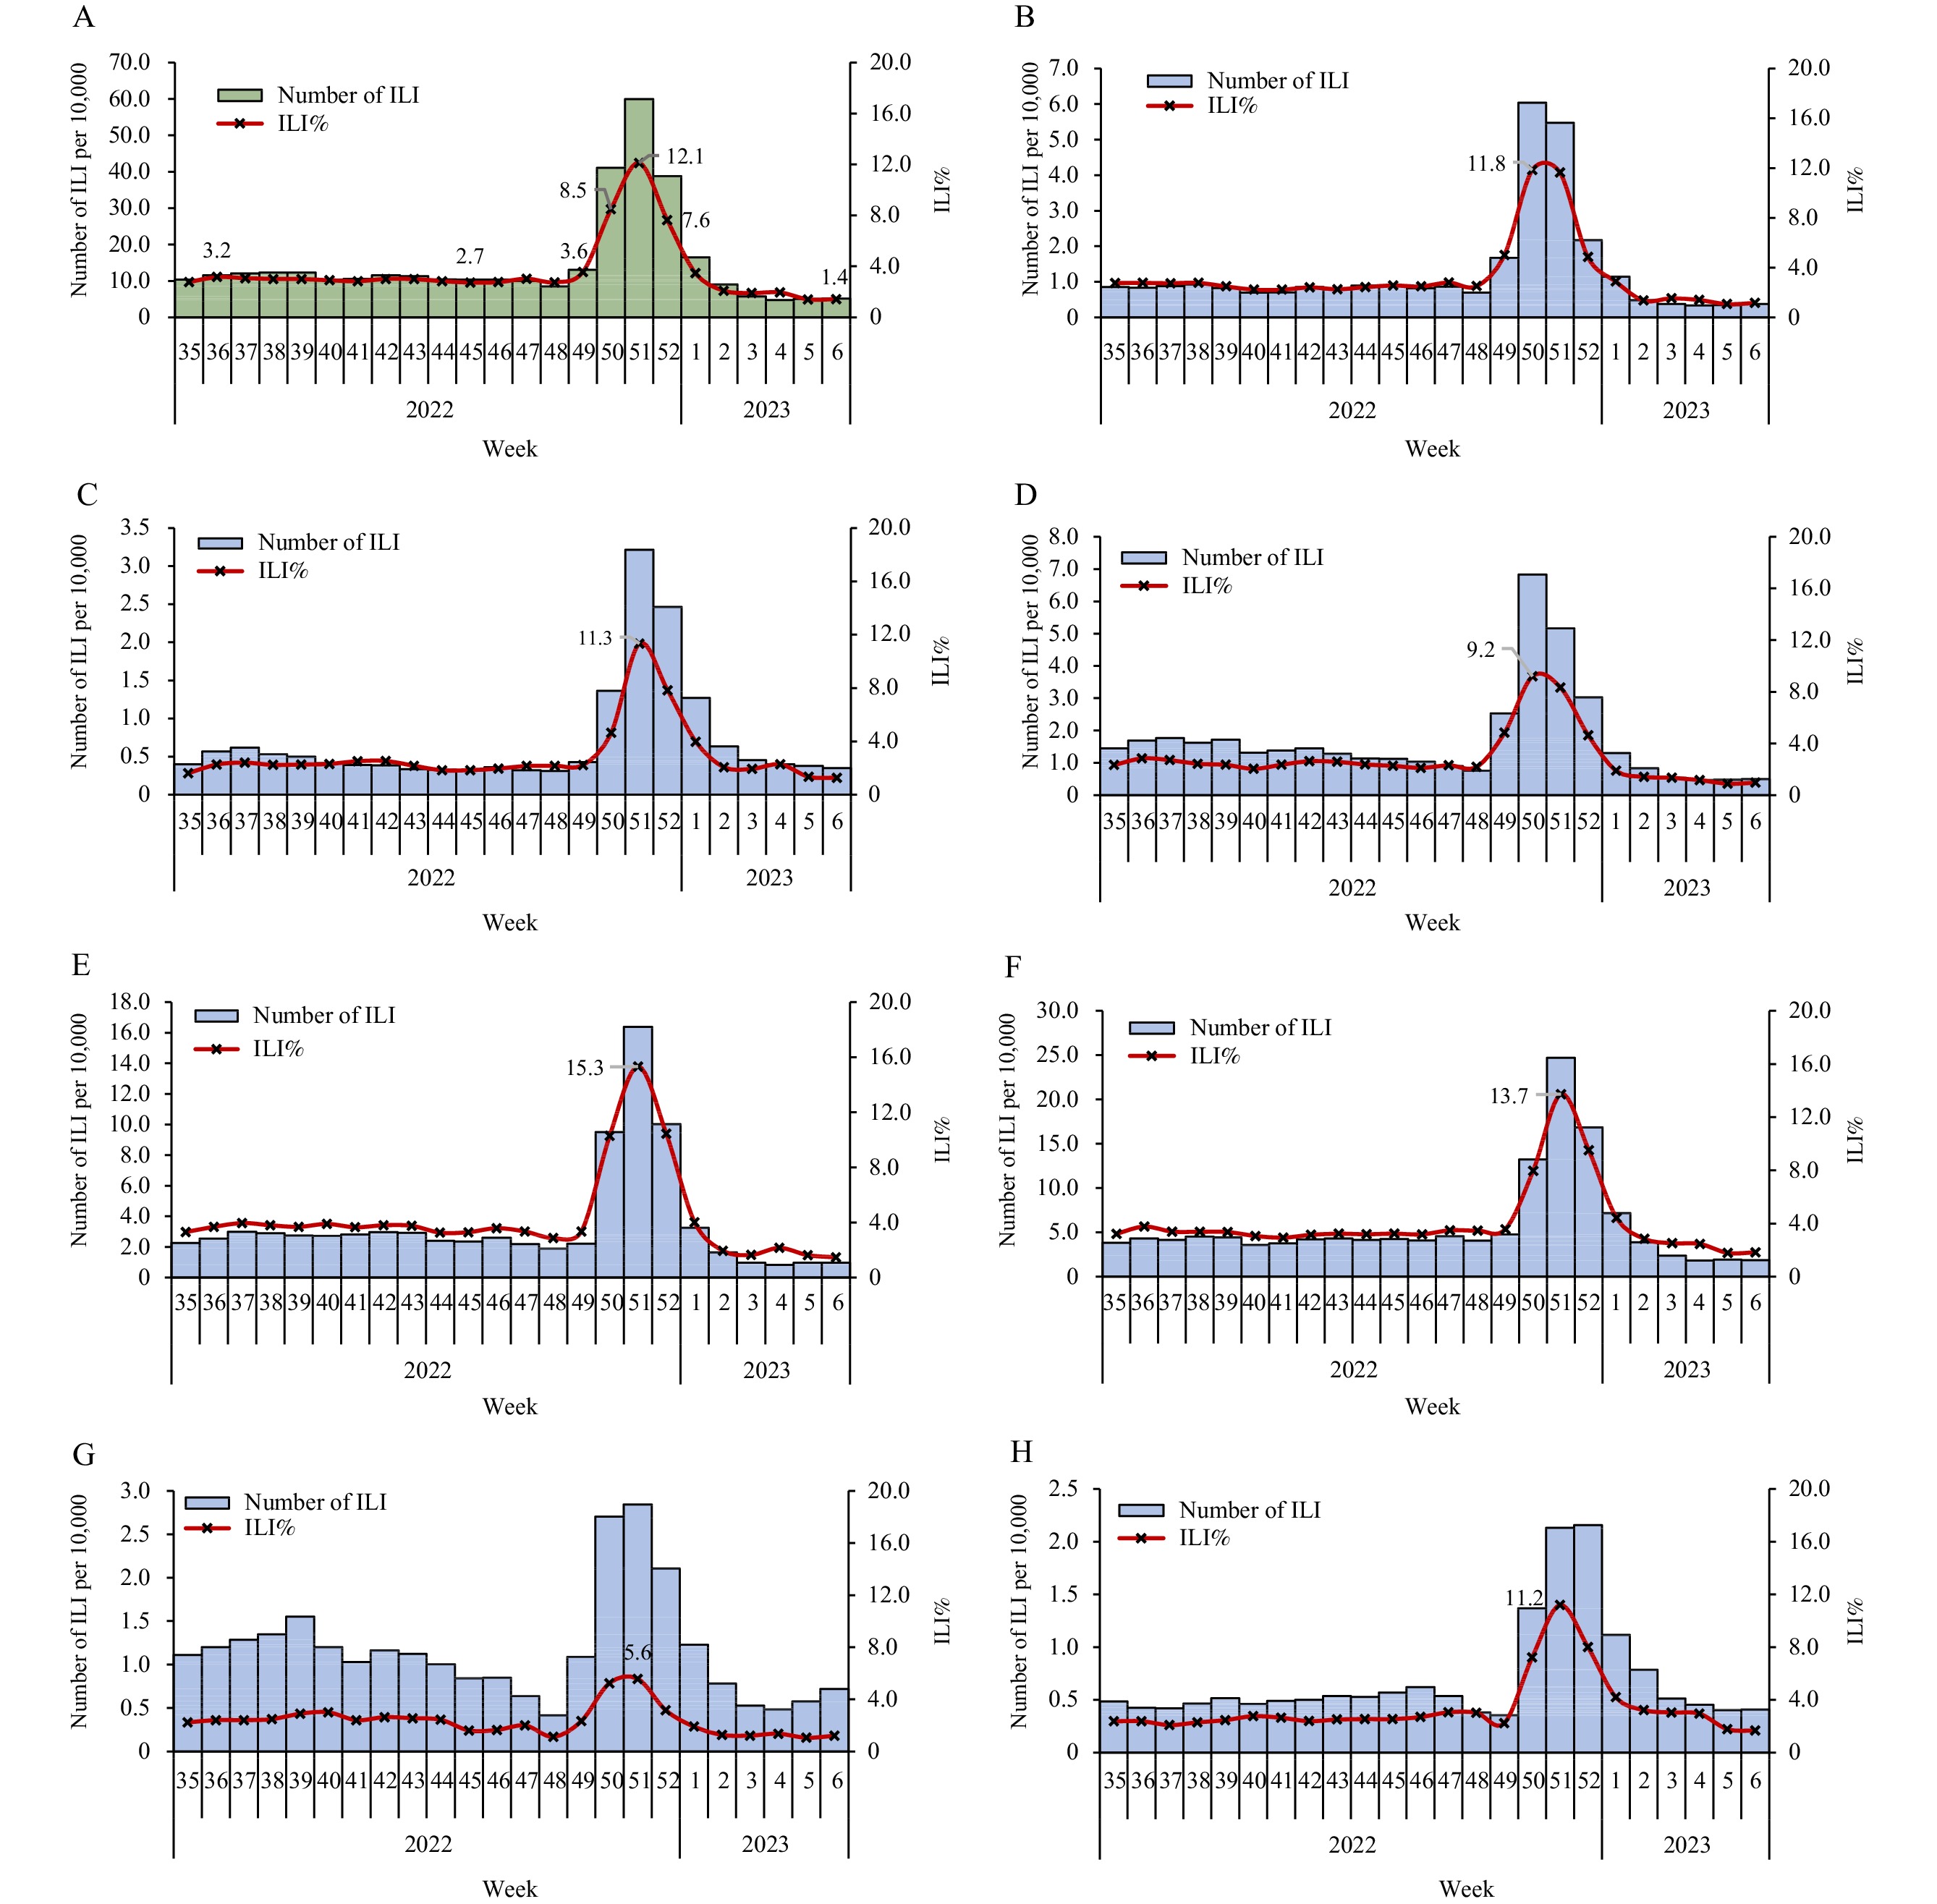 Figure 1.
Influenza-like illness (ILI) and ILI% as reported by sentinel hospitals from September 4, 2022 to February 12, 2023 in (A) Chinese mainland, (B) Southwest China, (C) Northwest China, (D) Central China, (E) South China, (F) East China, (G) North China, (H) Northeast China.
Note: Southwest China: Guizhou, Sichuan, Xizang (Tibet), Yunnan, Chongqing; Northwest China: Gansu, Xinjiang Production and Construction Corps, Ningxia, Qinghai, Shaanxi, Xinjiang; Central China: Henan, Hubei, Hunan; South China: Guangdong, Guangxi, Hainan; East China: Anhui, Fujian, Jiangsu, Jiangxi, Shandong, Shanghai, Zhejiang; North China: Beijing, Hebei, Inner Mongolia, Shanxi, Tianjin; Northeast China: Heilongjiang, Jilin, Liaoning. The population of each region was 205,148,550, 103,527,786, 223,562,940, 186,220,546, 423,469,844, 169,334,110, 98,514,948 (Data of the 7th National Population Census in 2020), respectively.Further data analysis of different regions revealed that the peak time of ILI% was similar across regions. The ILI% in the Southwest and Central China peaked in Week 50 (11.8% and 9.2%, respectively), while the ILI% in the Northwest, South, East, North, and Northeast China peaked in Week 51 (11.3%, 15.3%, 13.7%, 5.6%, and 11.2%, respectively). Subsequently, the ILI% continued to decline (Figure 1).
Further analysis of different age groups indicated that the groups aged 0–4 years, 5–14 years, 15–24 years, and 25–59 years reached their peaks in Week 51, while the ≥60 years age group reached its peak in the following week, with a slower trend of rise and decline. Currently, the number of ILI cases in all age groups is lower than the pre-epidemic level (Figure 2).
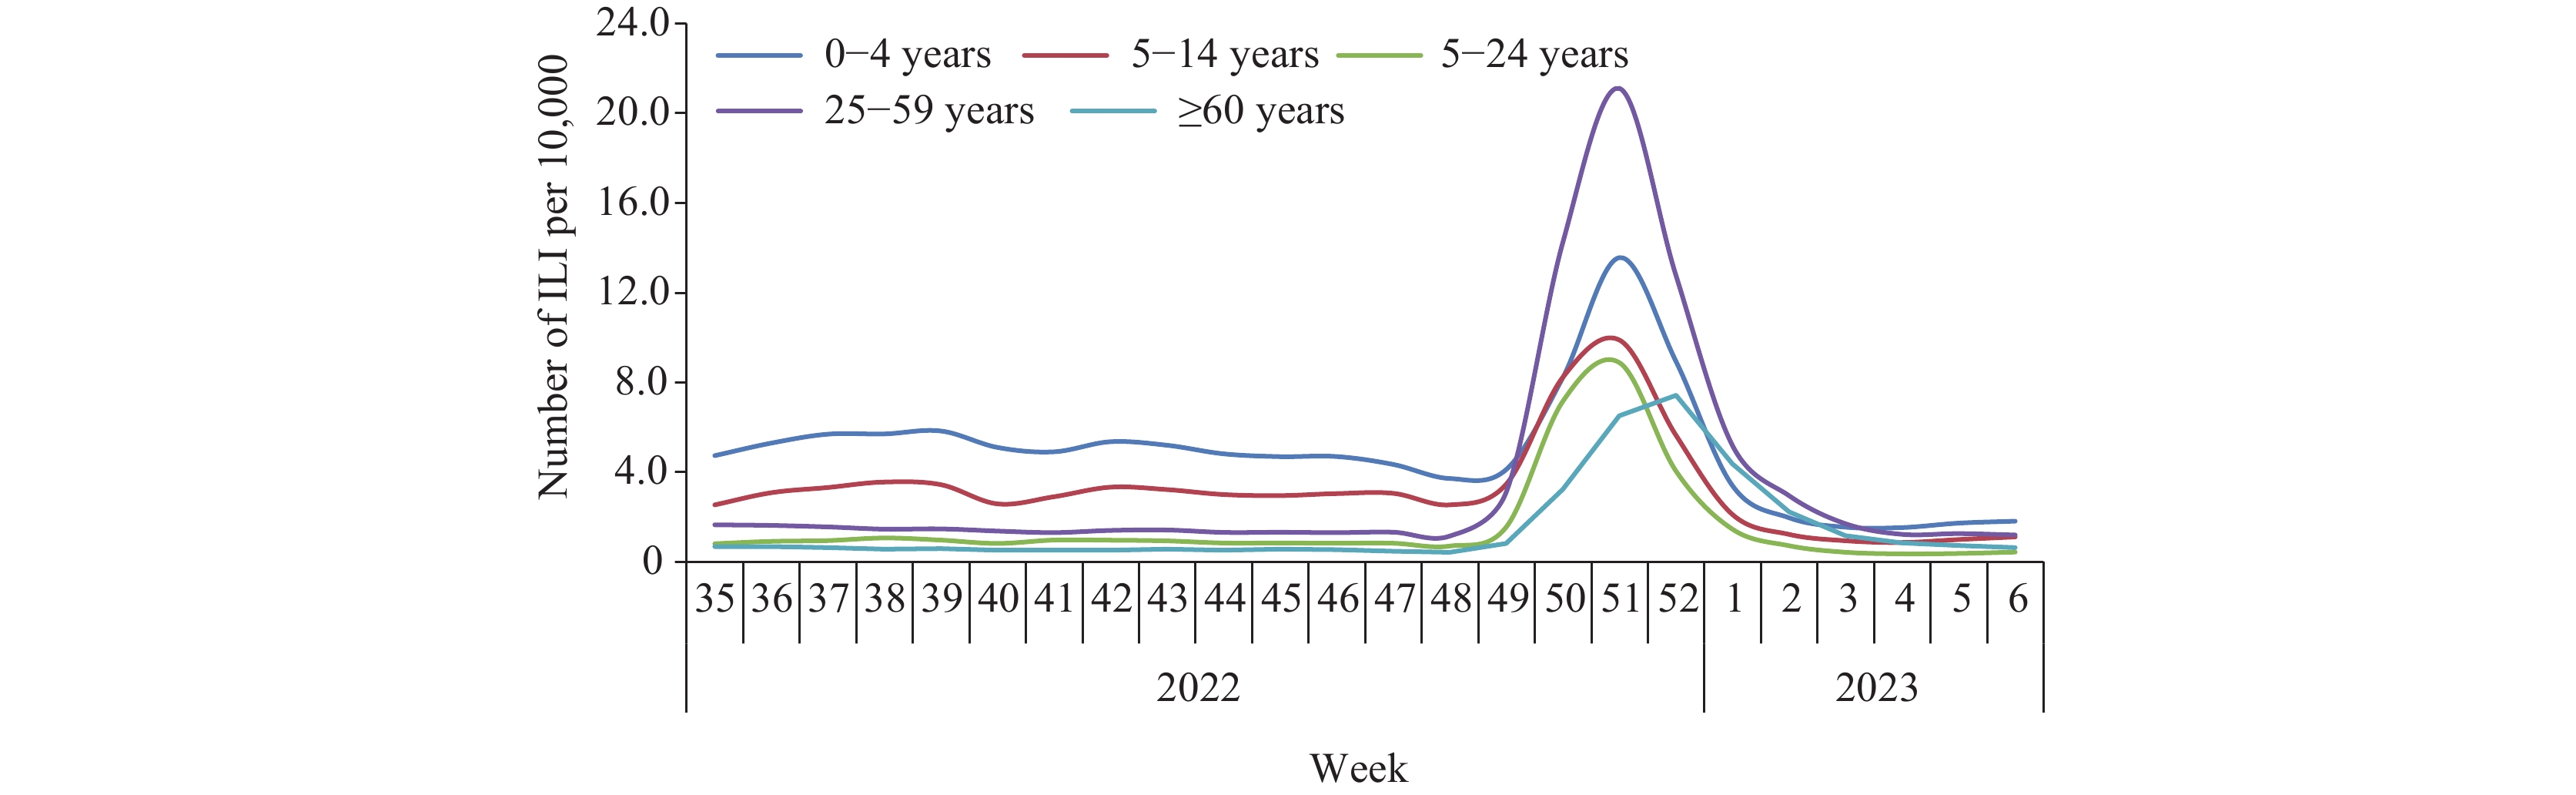 Figure 2.
Influenza-like illness (ILI) and ILI% reported by sentinel hospitals in different ages from September 4, 2022 to February 12, 2023.
Virologic Surveillance: rRT-PCR Testing of SARS-CoV-2 and Influenza Virus in Network Laboratories
From December 1, 2022 to February 12, 2023 (sample collection date), 402 national influenza surveillance network laboratories reported simultaneous test results of SARS-CoV-2 and influenza virus to CNIISIS. During this period, the network laboratories tested 115,844 specimens, with 30,381 (26.2%) positive detections for SARS-CoV-2 and 1,763 (1.5%) positive detections for influenza virus (Figures 3A and 3B).
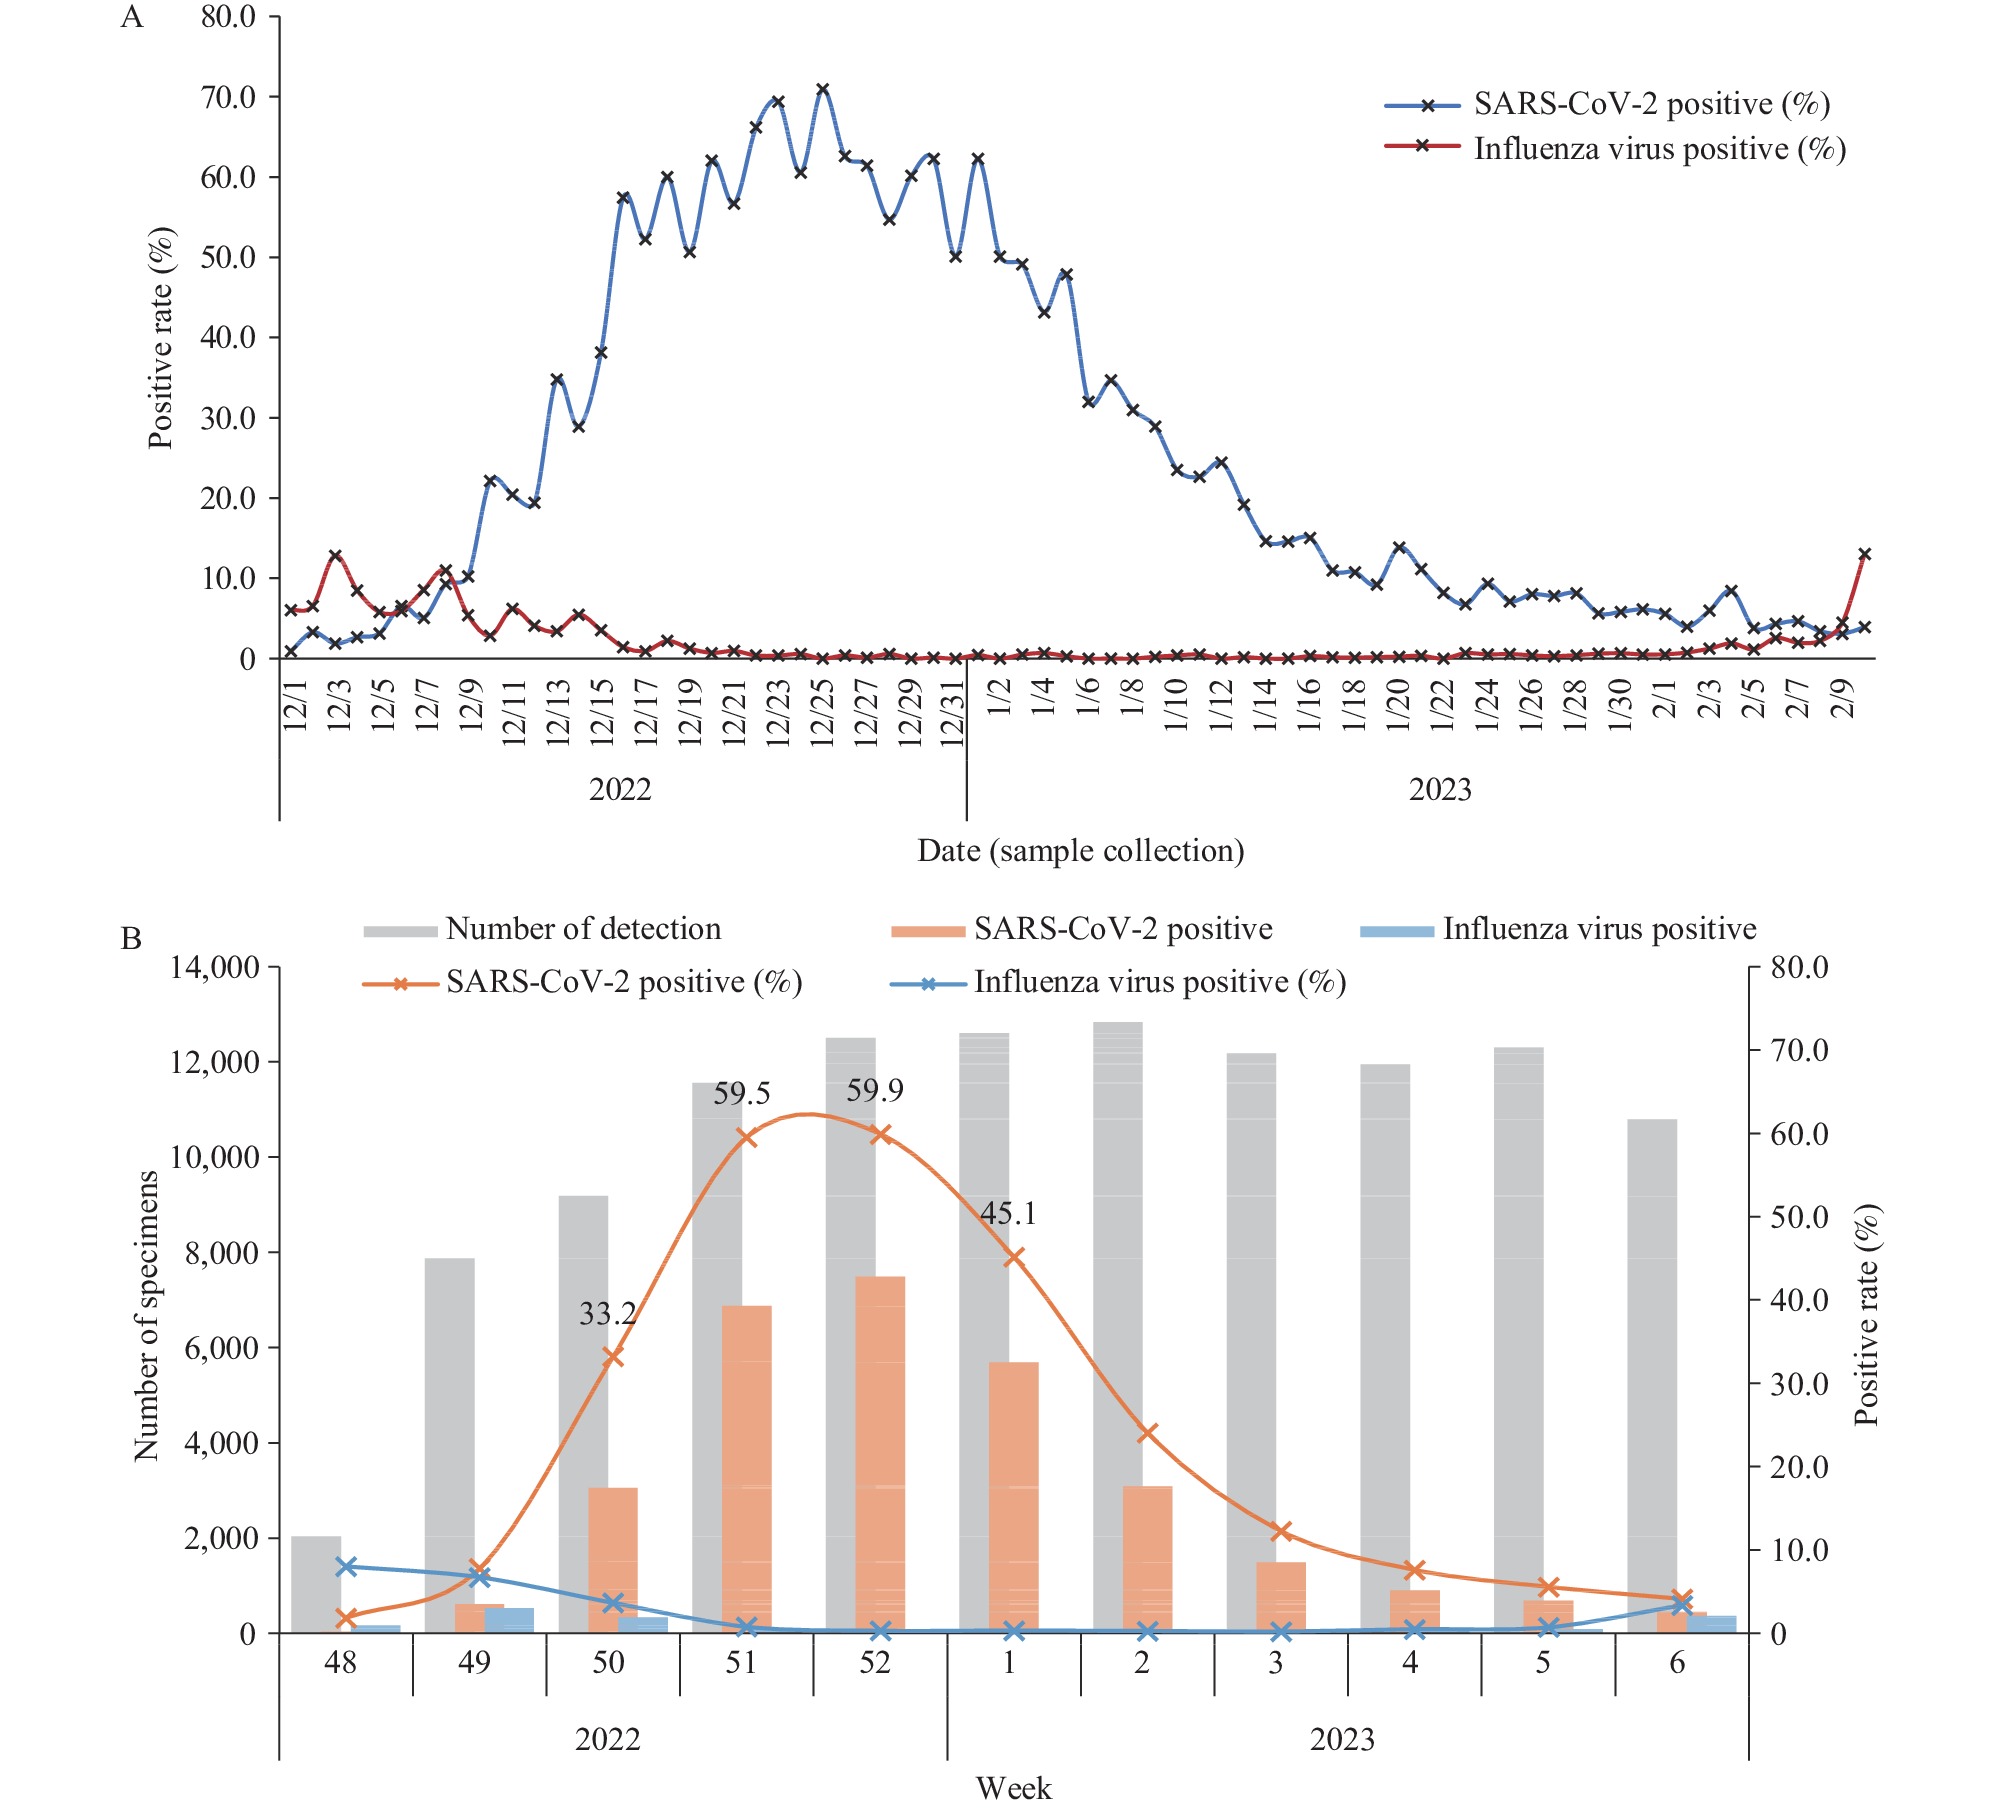 Figure 3.
SARS-CoV-2 and influenza virus positive tests reported by influenza network laboratories from December 1, 2022 to February 12, 2023. (A) Daily analysis; (B) Weekly analysis.
According to daily detection, the positive rate of SARS-CoV-2 tests increased from mid-December 2022, reaching a peak of 74.1% around December 23–25, before declining with minor fluctuations. During Week 2 of 2023 (January 9–15), the positive rate of SARS-CoV-2 ranged from 14.3% to 29.1% each day, further fell to as low as 3.4% in February 8 of Week 6 (Figures 3B and 4). During the same period, influenza virus detections remained at a low level, decreasing further since mid-December. The weekly positive rate of influenza virus detections was below 1% from late December until Week 5 of 2023, before increasing in Week 6, which is worthy of attention.
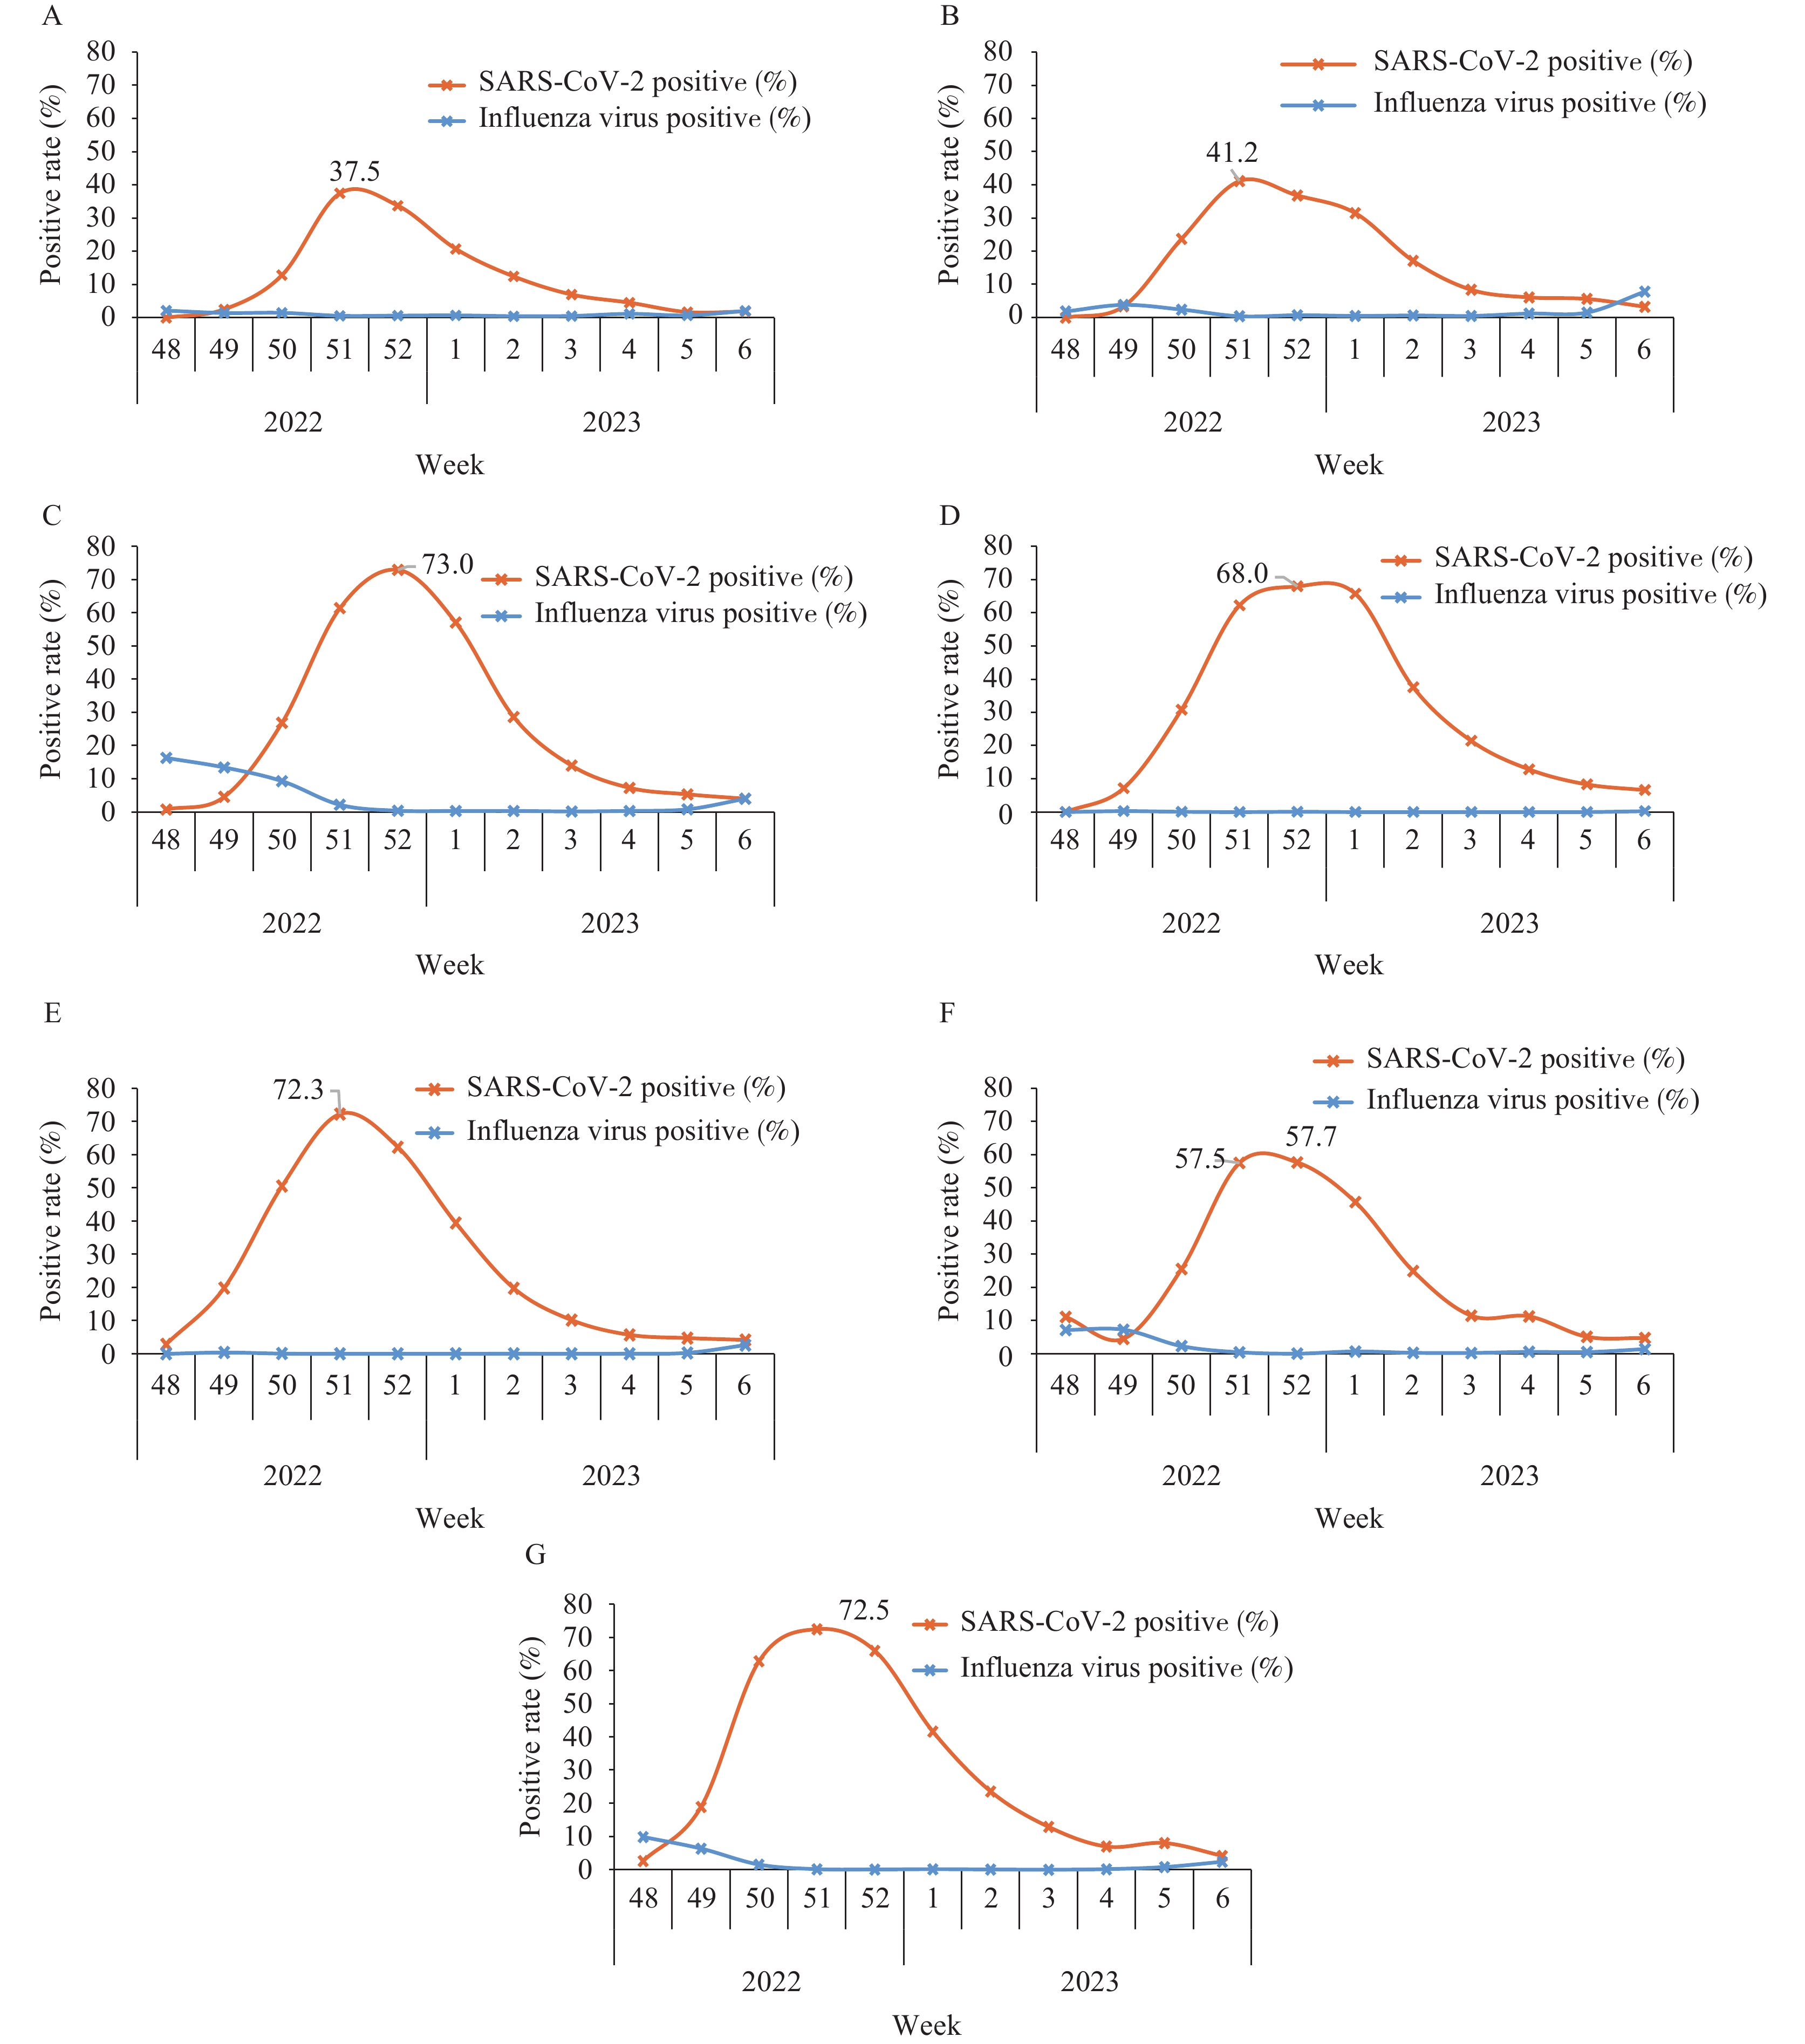 Figure 4.
The positive rate of SARS-CoV-2 and influenza virus in ILI samples from sentinel hospitals in seven regions of Chinese mainland from December 1, 2022 to February 12, 2023. (A) Northeast China; (B) North China; (C) East China; (D) South China; (E) Central China; (F) Northwest China; (G) Southwest China. Note: Northeast China: Heilongjiang, Jilin, Liaoning; North China: Beijing, Hebei, Inner Mongolia, Shanxi, Tianjin; East China: Anhui, Fujian, Jiangsu, Jiangxi, Shandong, Shanghai, Zhejiang; South China: Guangdong, Guangxi, Hainan; Central China: Henan, Hubei, Hunan; Northwest China: Gansu, Xinjiang Production and Construction Corps, Ningxia, Qinghai, Shaanxi, Xinjiang; Southwest China: Guizhou, Sichuan, Xizang (Tibet), Yunnan, Chongqing. The population of each region was 98,514,948, 169,334,110, 423,469,844, 186,220,546, 223,562,940, 103,527,786, 205,148,550 (Data of the 7th National Population Census in 2020), respectively.
Data analysis of different regions showed that the peak time of the SARS-CoV-2 positive rate was very close. In Southwest, Central, North, and Northeast China, the SARS-CoV-2 positive rate peaked in Week 51 (72.5%, 72.3%, 41.2%, and 37.5%, respectively). In East, South, and Northwest China, the SARS-CoV-2 positive rate peaked in Week 52 (73.0%, 68.0%, and 57.7%, respectively). The positive rate began to decline thereafter (Figure 4).
-
The influenza surveillance network, which was designed to address influenza, also serves as a critical resource for countries responding to non-influenza emergencies. Some of the clinical symptoms in SARS-CoV-2 infection patients meet the definition of an ILI case. Therefore, monitoring the proportion of ILI cases in sentinel hospitals can provide insight into the circulation of SARS-CoV-2 during the COVID-19 outbreaks. The CNISN and CNISIS have been established for many years as well-coordinated and quality-controlled systems. When there is a community-level epidemic, sentinel-based surveillance is a sensitive, convenient, and effective way to conduct SARS-CoV-2 surveillance. Additionally, simultaneous testing of SARS-CoV-2 and influenza virus in ILI patients can assess the risk of SARS-CoV-2 and influenza epidemics.
From December 1, 2022 to February 10, 2023 (sample collection date), 402 of 410 national influenza surveillance network laboratories submitted their rRT-PCR testing results for SARS-CoV-2 and influenza virus. The proportion of SARS-CoV-2 was significantly higher than that of influenza virus, and influenza activity in the Chinese mainland was at a very low level (10–11). Combined with the number of ILI, ILI%, and virologic surveillance results, it suggested that the increase of ILI in December was mainly caused by SARS-CoV-2 infection. Although it was the influenza season during the study period, our data indicated that influenza virus and SARS-CoV-2 did not peak and circulate together, which was consistent with other studies (12). However, the rise of influenza activity may occur after the COVID-19 epidemic, so it is essential to continuously strengthen surveillance and improve the capacity of early warning of infectious diseases.
Compared to other age groups, the increase and decrease of ILI cases in the elderly group was relatively slow. This may be attributed to the fact that elderly people tend to have fewer social activities and fewer opportunities to come into contact with infected individuals, resulting in a slower spread of SARS-Cov-2 in this age group and a later onset and flatter peak of infection. It is important to note, however, that our study was based on outpatients; the age group characteristics of inpatients may differ.
In this study, it is evident that even when SARS-CoV-2 was highly prevalent, there was still a proportion of both SARS-CoV-2 and influenza virus negative ILI samples, suggesting that other pathogens may also be present. Surveillance of respiratory samples for multiple pathogens can provide information on the epidemic trend and disease burden of different pathogens.
This study had some limitations. We did not compare sentinel-based ILI surveillance with the prevalence of SARS-CoV-2 from other surveillance systems. The sentinel surveillance was based on ILI cases in departments of outpatient, emergency, and fever clinics, so the data cannot directly predict the number of SARS-CoV-2 infections in the entire population.
-
No conflicts of interest.
HTML
Indicator Description
Data Resources
Surveillance of Outpatient or Emergency Visits for ILI at Sentinel Hospitals
| Citation: |

|