
 Download:


-
After the first wave of coronavirus disease 2019 (COVID-19) in China in early 2020, social distancing policies were gradually relaxed. A series of studies were conducted to quantify the changes in contact patterns under different interventions, whose intensity and type varied over time, and to estimate their impact on the epidemic spread (1-3). Previous studies have shown a dramatic decrease in the number of social interactions in China during the early phase of the pandemic (1). This was followed by a moderate increase in social contacts after strict non-pharmaceutical interventions (NPIs) were relaxed from March to May 2020 (2-3). As of the fourth quarter of 2020, almost all schools and workplaces had been opened (4-5), and daily life had gradually resumed to a normal status. It is still unknown to what extent social interactions had resumed by the end of 2020 and how age-specific contact patterns had affected severe acute respiratory syndrome coronavirus 2 (SARS-CoV-2) transmission in China. The purpose of this study was to estimate changes in contact patterns by age in Chinese mainland over the course of the first year of the COVID-19 pandemic. This study aimed to provide valuable information about the risk of transmission and transmission patterns by age in a post-COVID-19-intervention context.
HTML
-
To estimate changes in contact patterns by age in the post-epidemic period, we conducted diary-based contact surveys in Wuhan, Shanghai, Shenzhen, and Changsha between September 16 and November 8, 2020 (Figure 1). The design of the survey (
Supplementary Material ) was similar to that of our previous work (1-2,6), where contact patterns during the pre-pandemic (prior to 2020), outbreak (February 2020), and post-lockdown (March to May 2020) periods were investigated (Figure 1). A contact was defined as either a two-way conversation involving three or more words in the physical presence of another person or direct physical contact (e.g., a handshake). We further divided direct interpersonal contact into three types: 1) physical contact, 2) non-physical contact at a distance of 1 meter or less, and 3) non-physical contact at a distance of more than 1 meter. We also recorded whether the participant and contact were wearing face masks (i.e., both wore, neither wore, or one wore), and the contact environment (i.e., indoor, outdoor, or both).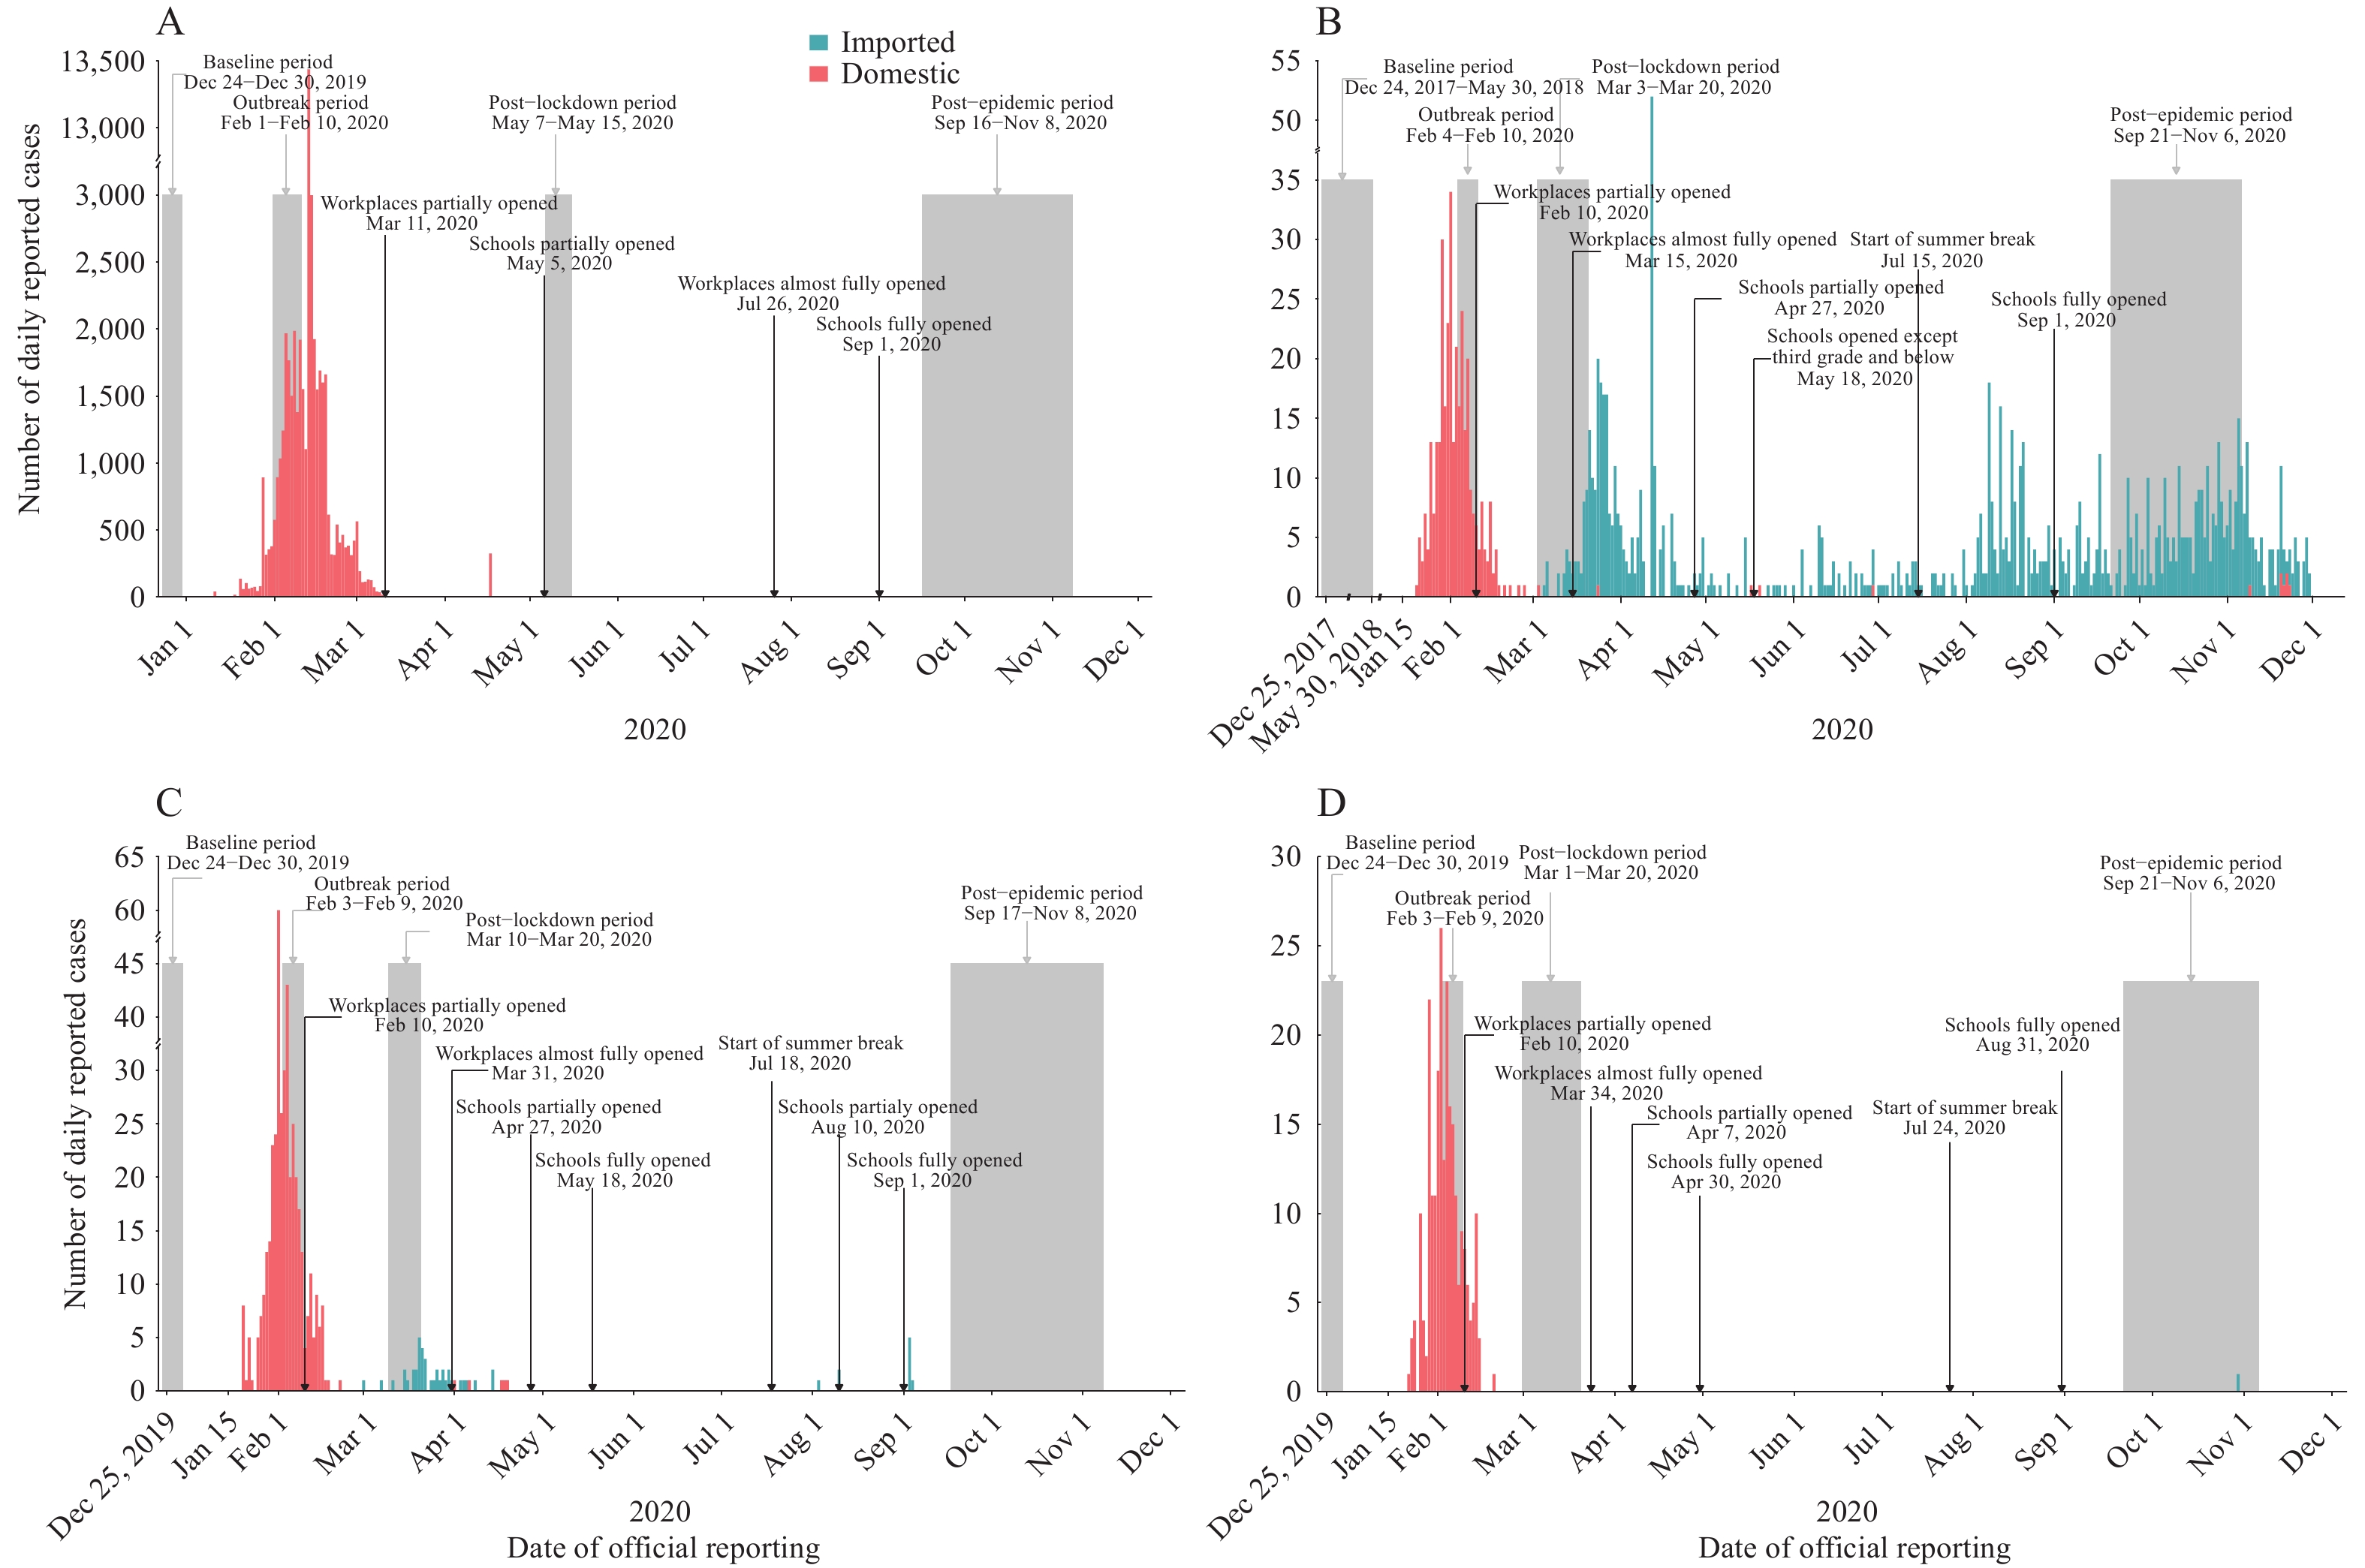 Figure 1.
Number of reported locally transmitted (red) and imported (green) COVID-19 cases, summary of the main interventions performed over time, and timeline of the surveys in Wuhan (A), Shanghai (B), Shenzhen (C), and Changsha (D).
We estimated contact matrices by age, dividing participants into 16 age groups (0–4 years, 5–9 years, ... , 70–74 years, and 75 years and older). We relied on data collected from this survey and three other surveys conducted during the pre-pandemic, outbreak, and post-lockdown periods to estimate contact matrices representing mixing patterns for the four cities (1-2,6).
We estimated the impact of daily life resumption on the potential reproduction number (R) of a COVID-19 outbreak by relying on the mixing patterns estimated in contact surveys. The next-generation matrix approach was used to estimate R. To evaluate the impact on transmission dynamics of reducing school, workplace, and community contacts, we simulated a possible outbreak of SARS-CoV-2 Omicron BA.5 or another highly transmissible variant using an ordinary differential equation Susceptible-Infectious-Removed (SIR) model (
Supplementary Material ). We used Shanghai as a case study, based on the baseline contact matrix by setting. We assumed that eliminating contacts in a certain setting while keeping the contacts in other settings the same as the baseline period would indicate closure of that setting. We designed four scenarios to estimate the effect of different social distancing strategies: 1) Baseline scenario (no interventions): workplace, school, and community contacts were at pre-COVID levels; 2) Scenario 1: no contacts at school, while all other contacts were at pre-COVID levels; 3) Scenario 2: no contacts at school and a 75% reduction of contacts at the workplace, while all other contacts were at pre-COVID levels; and 4) Scenario 3: no contacts at school, a 75% reduction of contacts at the workplace, and a 90% reduction of contacts in the community. Scenarios 2 and 3 simulated a 75% and 90% reduction of contacts in the workplace and community, respectively. During the first COVID-19 lockdown in Shanghai, we estimated a nearly 90% reduction of workplace contacts and a 95% reduction of contacts in the community (1). As achieving such a high level of reduction may be difficult without imposing a strict lockdown, we used more conservative estimates of a 75% and 90% reduction of workplace and community contacts, respectively.All the analyses were performed in R (version 4.0.3, R Foundation for Statistical Computing, Vienna, Austria).
-
A total of 3,281 participants (858 from Wuhan, 832 from Shanghai, 797 from Shenzhen, and 794 from Changsha) were recruited for the post-epidemic survey, and 16,533 contacts were recorded in total. Compared with the outbreak period, the average number of contacts during the post-epidemic period significantly increased by a factor of 1.9 (P<0.001), 0.5 (P<0.001), 1.5 (P<0.001), and 2.0 (P<0.001) in Wuhan, Shanghai, Shenzhen, and Changsha, respectively (
Supplementary Table S1 ). The largest resumption of contacts was observed for school-age individuals (Supplementary Figure S1 ). In Wuhan, 18.9% of contacts were non-physical contacts at a distance of at least 1 meter, 39.6% of contacts occurred with both or either the participant or the contactee wearing a face mask, and 9.6% of contacts occurred outdoors. Similar contact patterns were observed in Shanghai, Shenzhen, and Changsha (Supplementary Figure S2 ).The pre-pandemic (baseline) contact matrices revealed the typical age-mixing patterns observed in previous studies (7) (Figure 2A–2D). During the lockdown, most of the classic age-specific features were absent, as the main contributor to contact patterns was the mixing between household members (Figure 2E–2H). Compared to the outbreak period, more contacts gradually occurred among school-age and working-age individuals during the post-lockdown and post-epidemic periods (Figure 2I–2P). During the post-epidemic period, the proportion of household contacts was still remarkably high compared to the pre-COVID era (Figure 2), with household contacts representing approximately half of the total number of recorded contacts (i.e., 48.7% in Wuhan, 53.6% in Shanghai, 43.2% in Shenzhen, and 47.6% in Changsha); the proportion of community contacts was still lower than 20% in the four study locations (i.e., 7.7% in Wuhan, 10.7% in Shanghai, 18.9% in Shenzhen, and 9.5% in Changsha) (
Supplementary Table S2 ).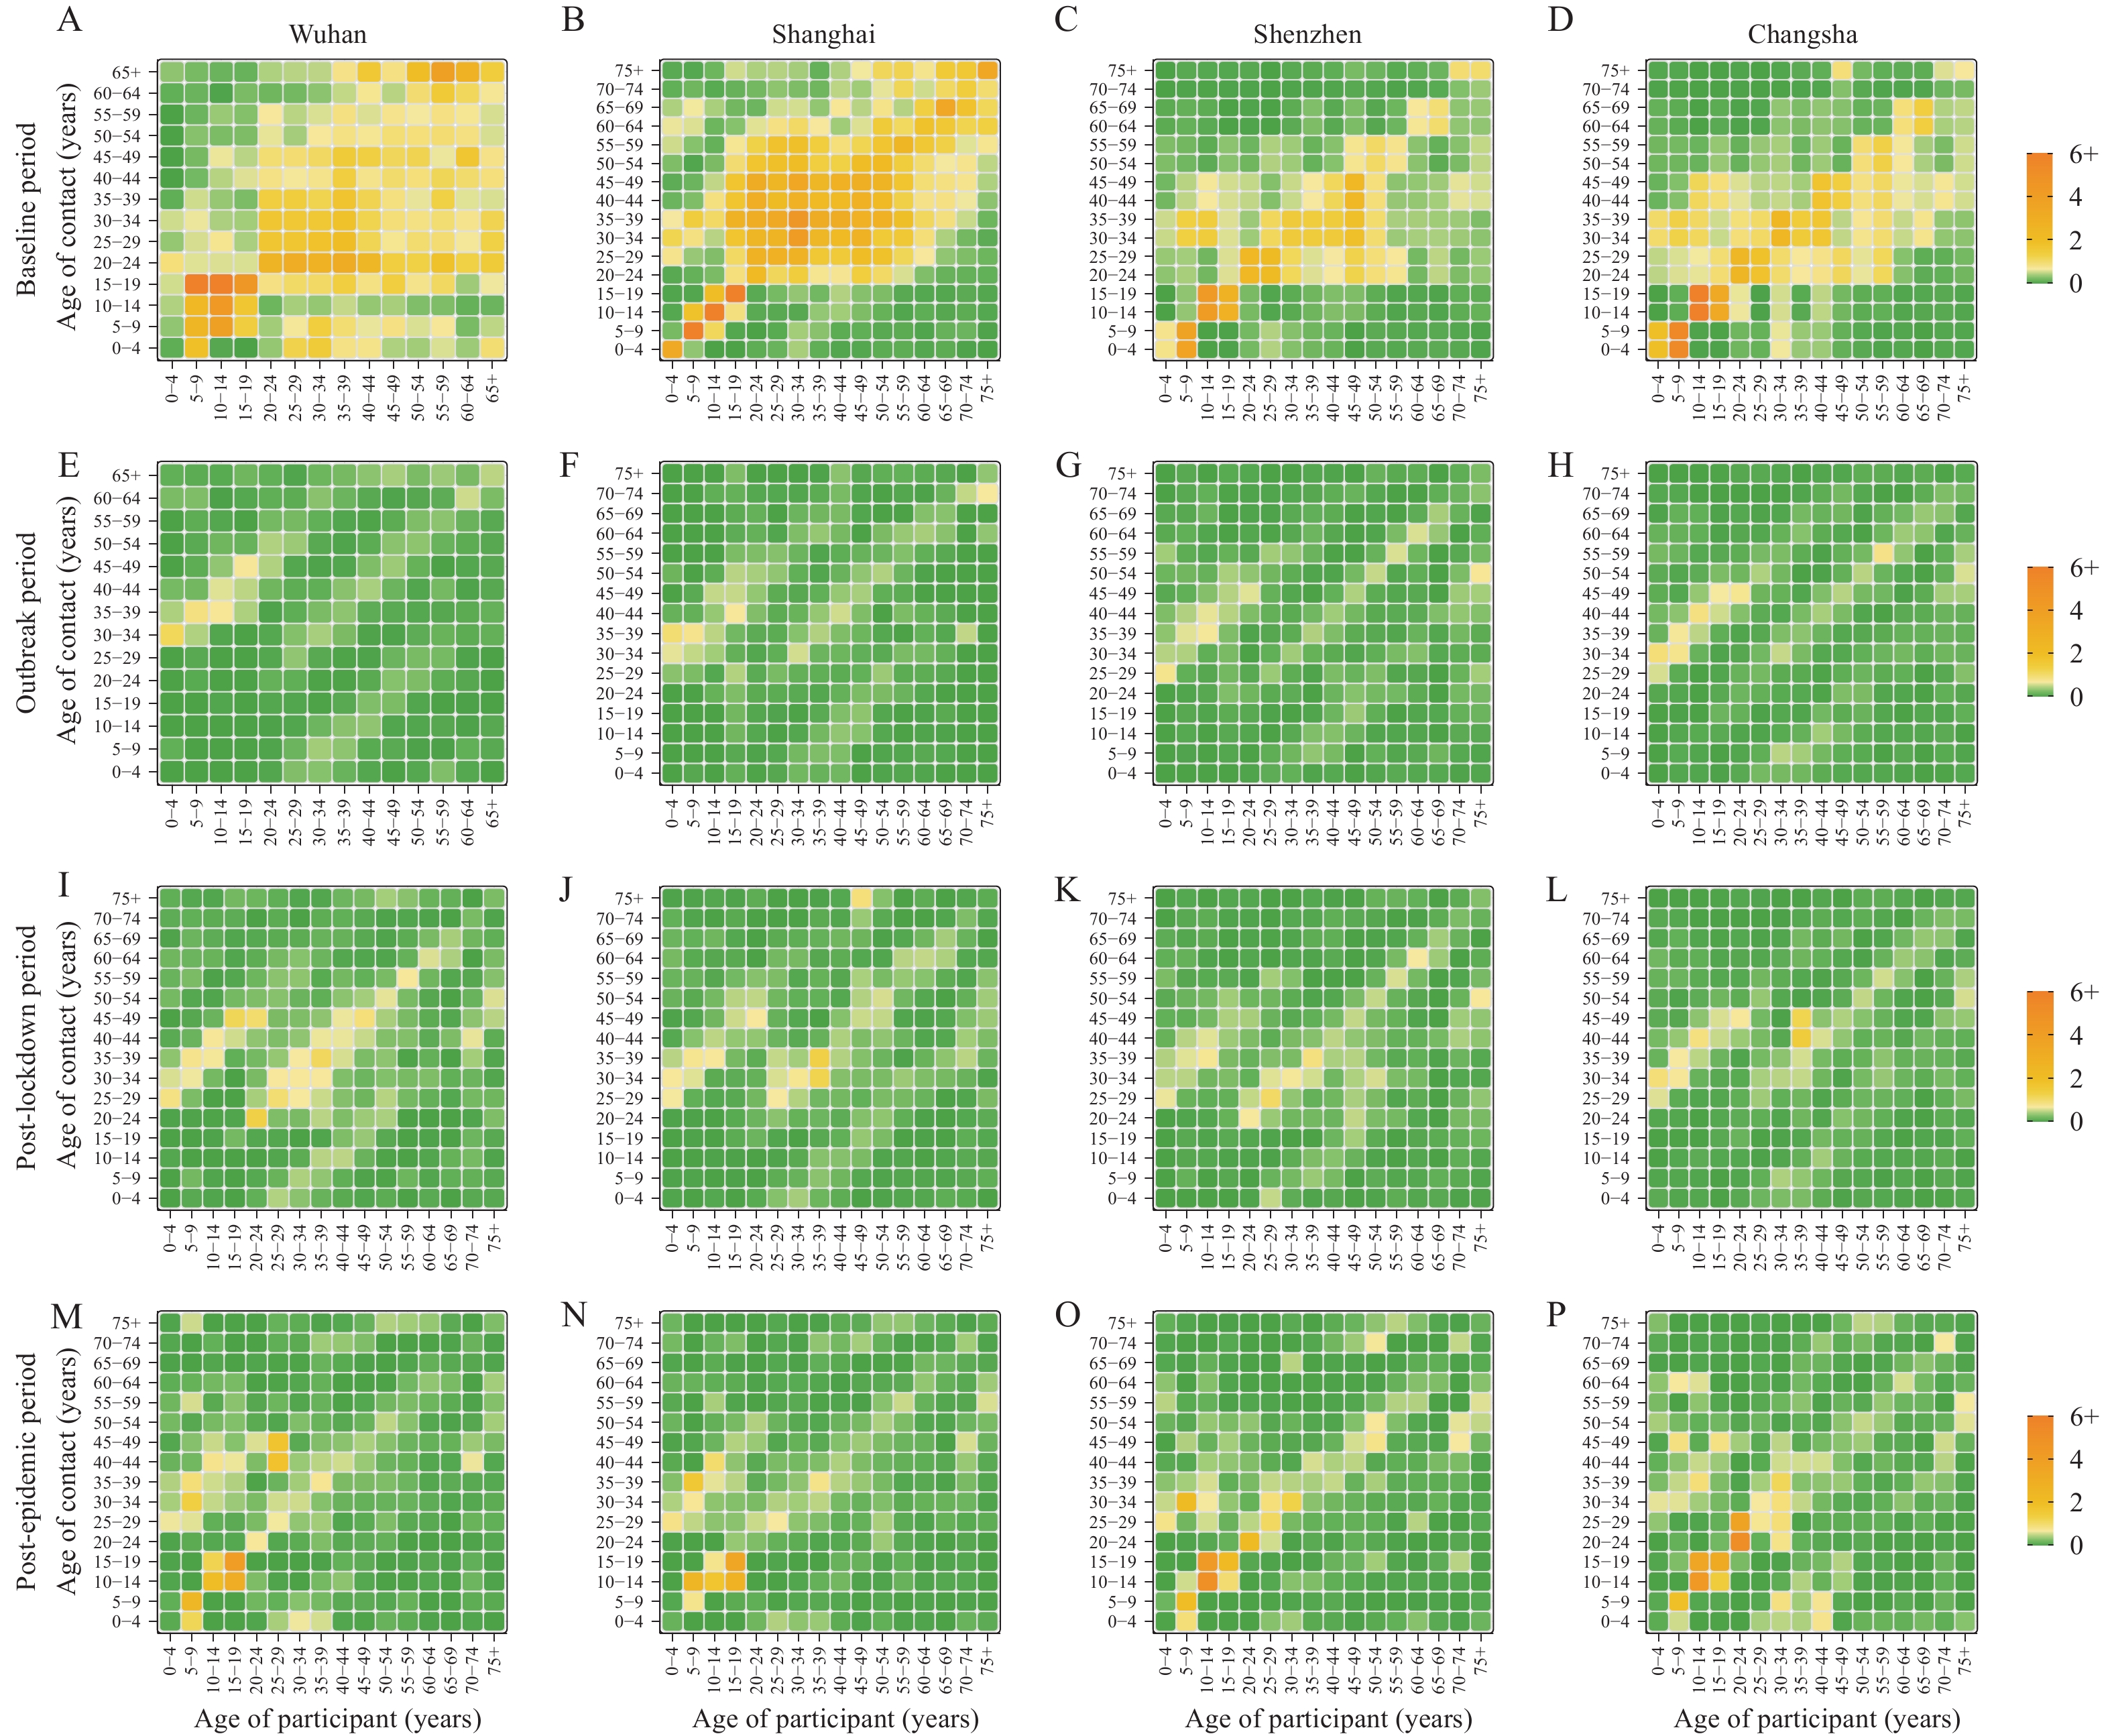 Figure 2.
Contact matrices by age group for the four study locations for the baseline period in (A–D), outbreak period (E–H), post-lockdown period (I–L), and post-epidemic period (M–P). Each cell of the matrix represents the mean number of contacts that an individual in a given age group has with other individuals, stratified by age groups. The color intensity represents the number of contacts.
Assuming a baseline reproduction number of between 1.5 and 3.5 for SARS-CoV-2 considering pre-COVID contact patterns, we used the next-generation matrix approach to investigate the risk of a new epidemic outbreak under the estimated contact patterns during different epidemic phases. Our results show that in the post-epidemic phase, contacts had increased to an extent that would have allowed the emergence of new epidemic outbreaks in fully susceptible populations (as was the case in China at the time of the last survey — November 2020) for R0 values around 2.5 in Wuhan, Shenzhen, and Changsha, while the risk of resurgence would have been low in Shanghai (Figure 3).
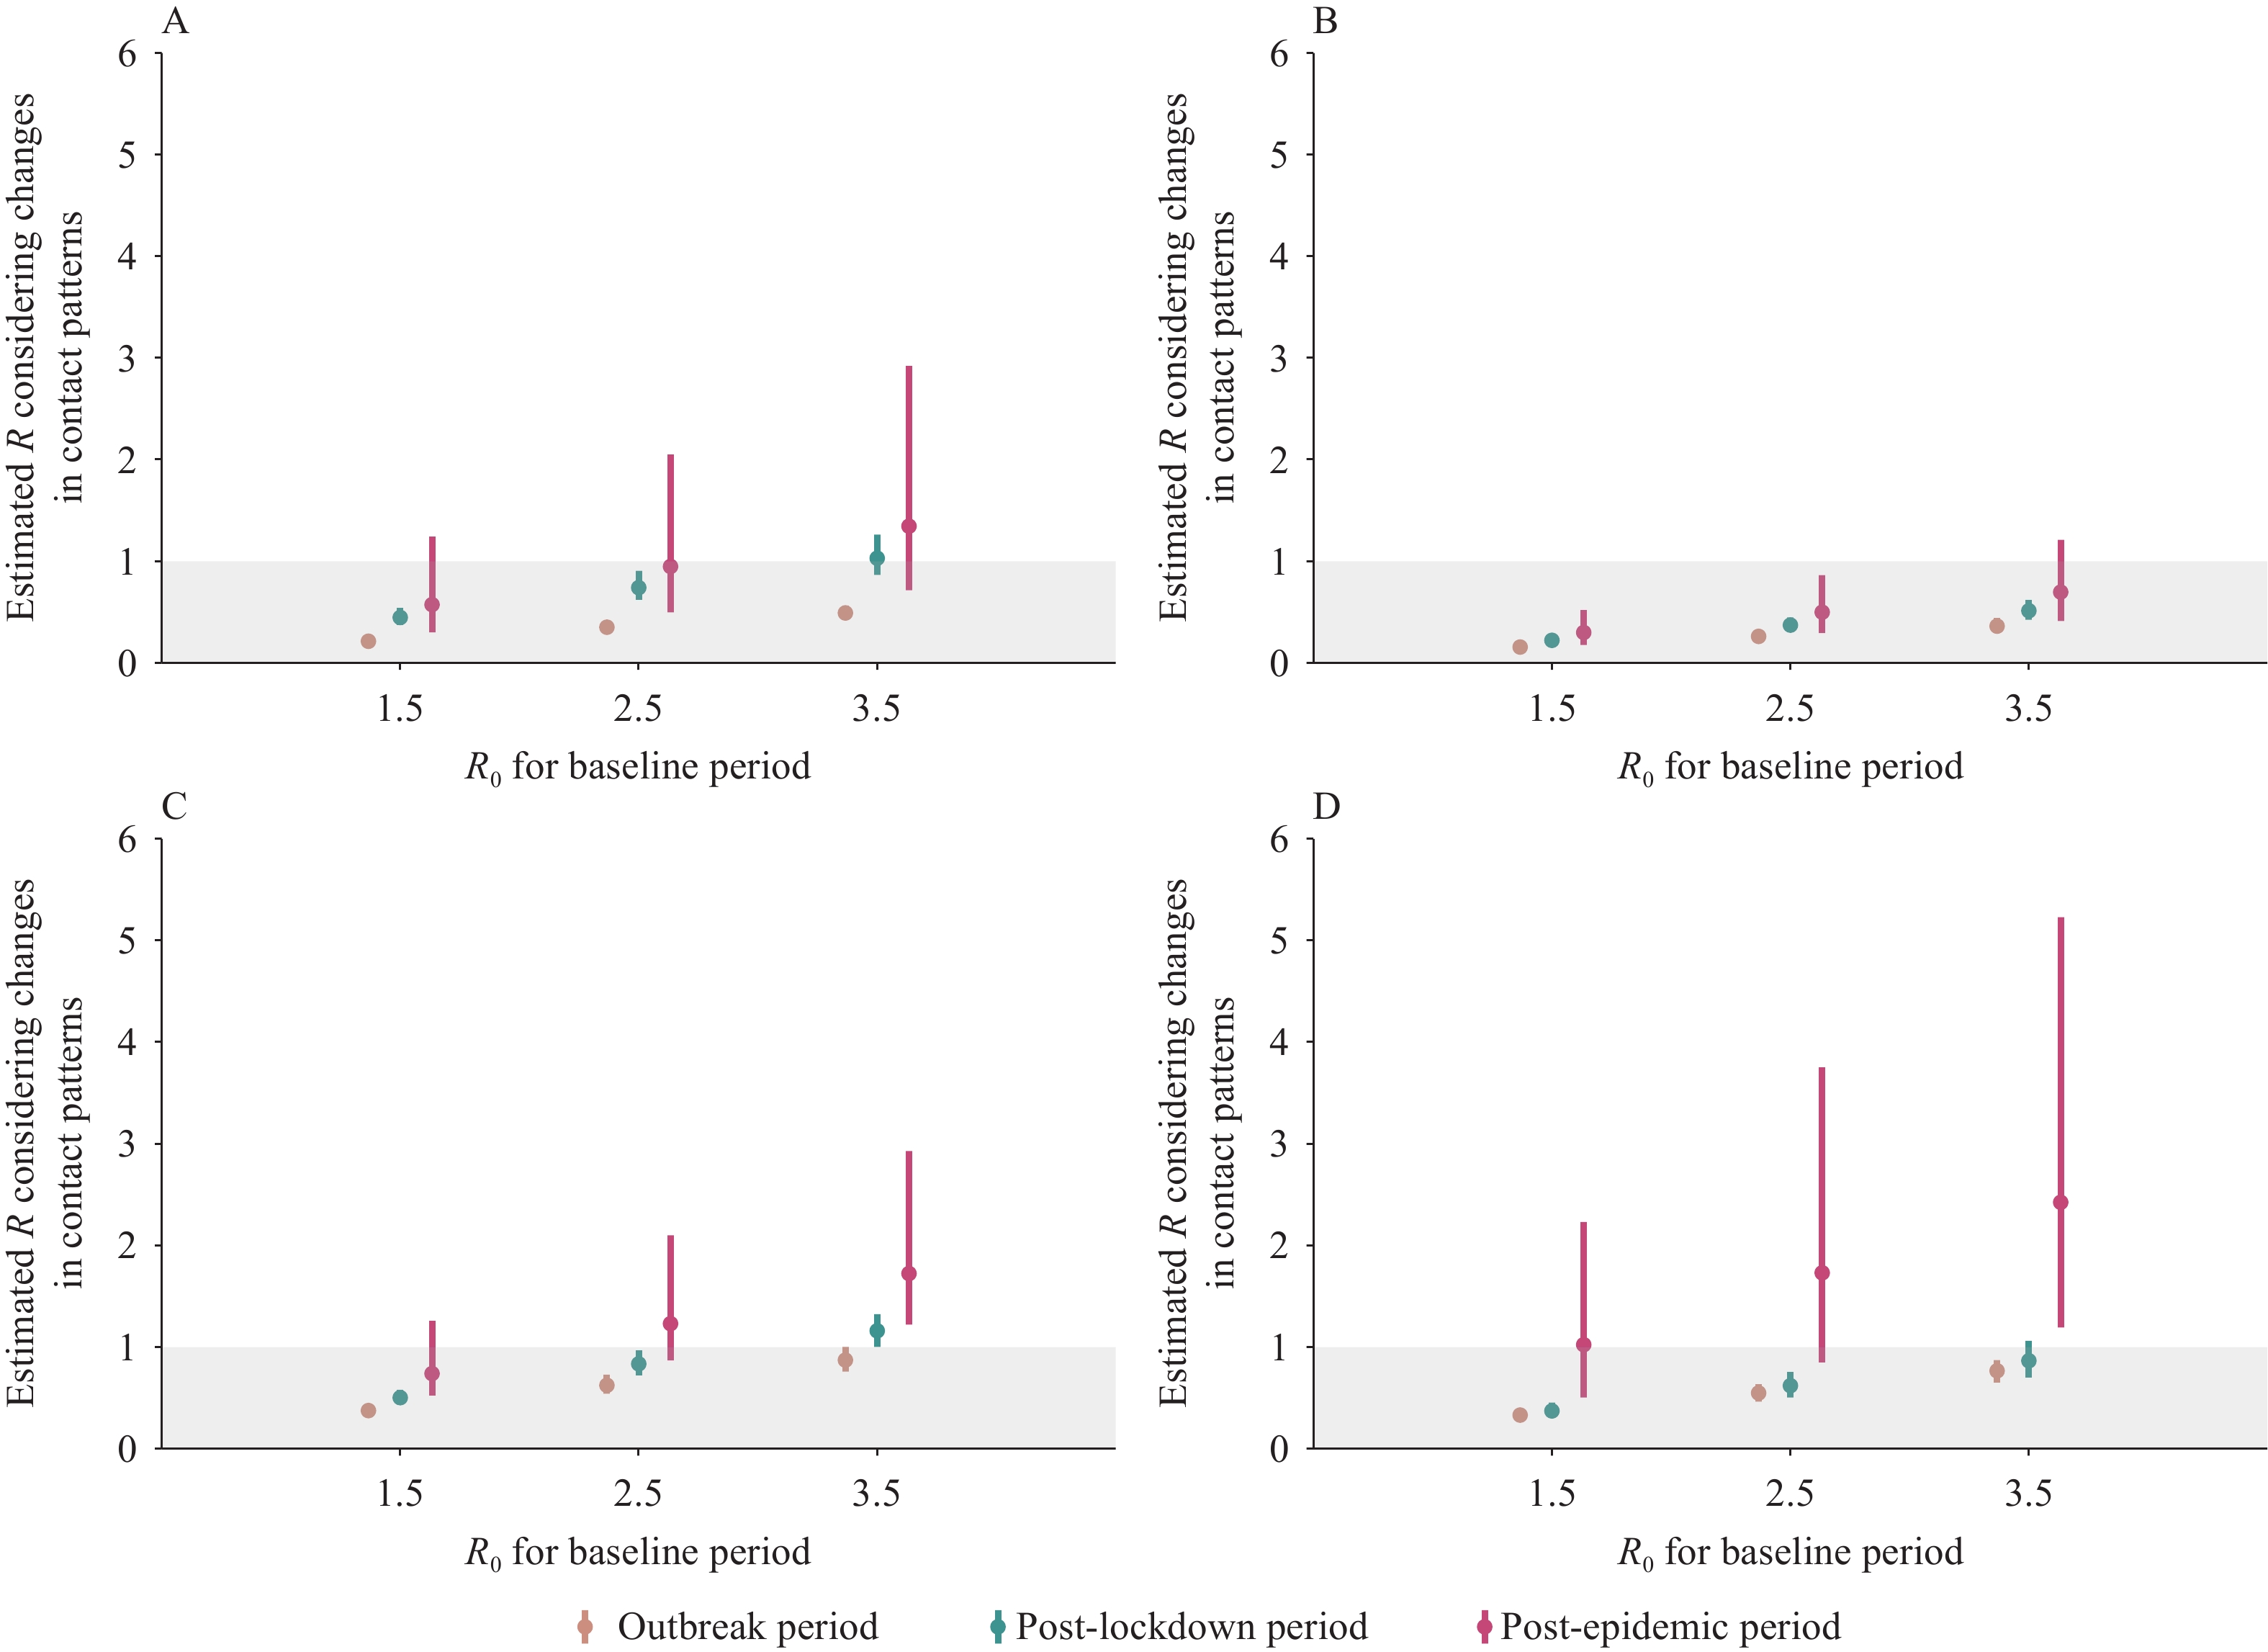 Figure 3.
Changes in the reproduction number (mean and 95% confidence interval) considering the estimated contact patterns in the different periods in Wuhan (A), Shanghai (B), Shenzhen (C), and Changsha (D).
To estimate the effect of social distancing on a possible outbreak of SARS-CoV-2 Omicron BA.5 or another highly transmissible variant, we considered the Shanghai population and assumed an effective reproduction number of 4 [about 20% larger than what was estimated at the onset of the 2022 Omicron BA.2 outbreak in Shanghai (8)]. Compared with the baseline scenario considering baseline (pre-COVID) contact patterns, we found that a combination of school closures with a 75% reduction of contacts at the workplace could reduce the infection attack rate by 16.8%; an additional 90% reduction of contacts in the community was estimated to be sufficient to control an outbreak (Figure 4).
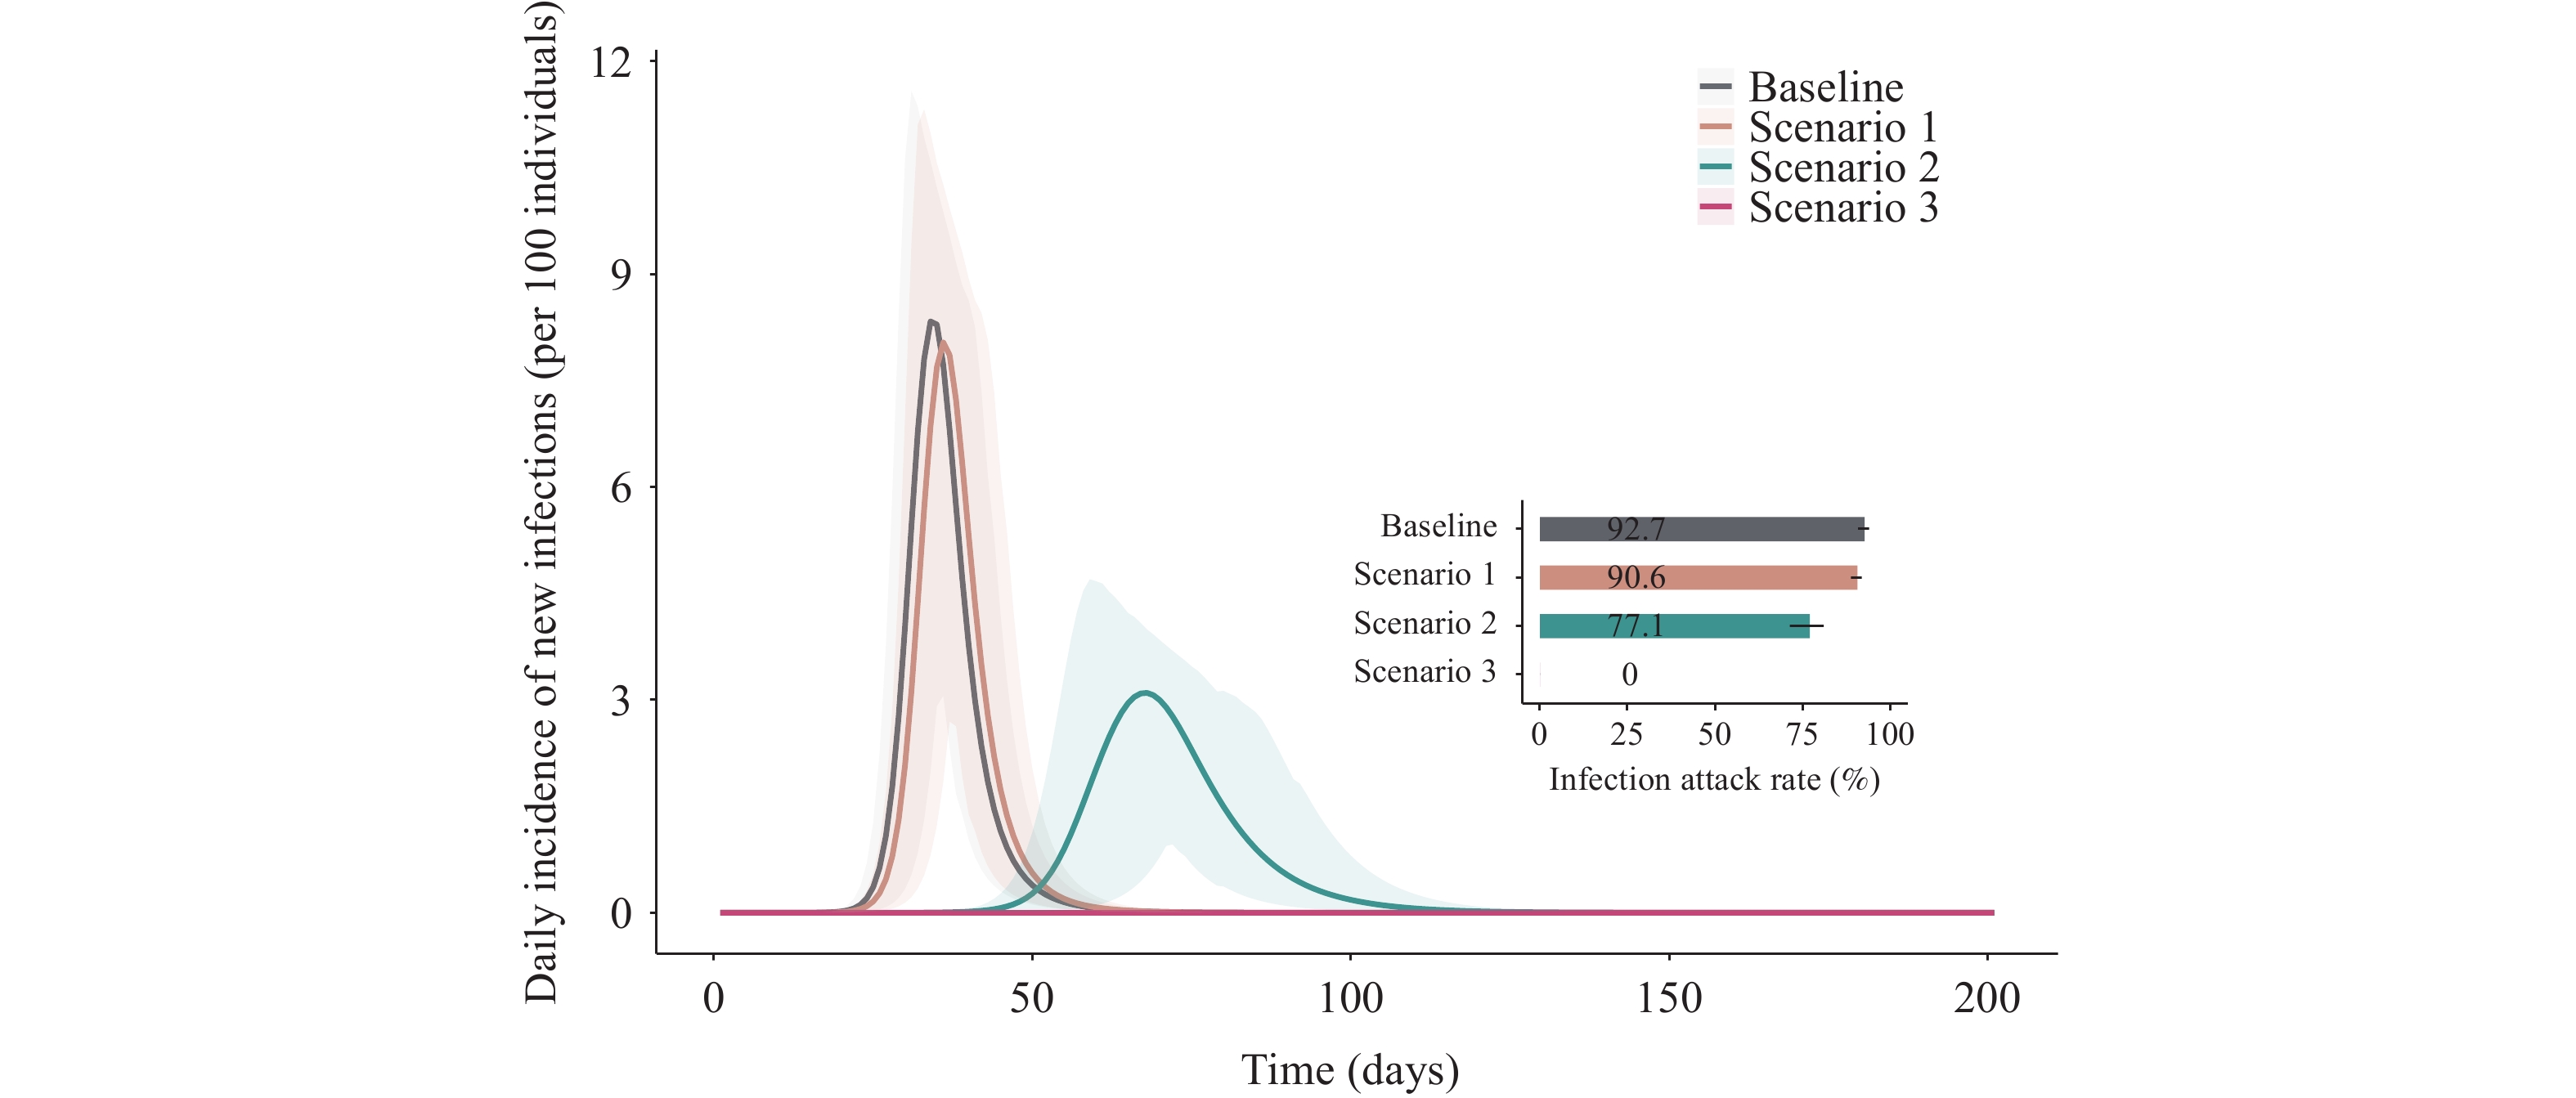 Figure 4.
The effect of social distancing on the spread of SARS-CoV-2 in Shanghai was examined, assuming an effective reproduction number of 4 and considering baseline (pre-COVID) contact patterns.
Note: The curves show the daily incidence of new infections per 100 individuals (mean and 95% confidence interval) under different social distancing policies. The inset curve shows the infection attack rate (mean and 95% confidence interval) 200 days after the first COVID-19 case. Baseline scenario (no interventions): workplace, school, and community contacts are back to the pre-COVID era; Scenario 1: no contacts at school, while all other contacts are back to the pre-COVID era; Scenario 2: no contacts at school and 75% reduction of contacts at the workplace, while all other contacts are back to the pre-COVID era; Scenario 3: no contacts at school, 75% reduction of contacts at the workplace, and 90% reduction of contacts in the community.
-
In this study, we quantitatively estimated how human contact patterns by age changed in four Chinese cities during the first year of the COVID-19 pandemic. We found that, although the number of contacts increased in the post-epidemic period (approximately six months after the end of the first COVID-19 wave), the average number of contacts per day remained far from the baseline (pre-COVID) level. In addition to the marked reduction in the mean number of contacts per day, the age of the contacted individuals had markedly changed, highlighting a drop in social interactions with work colleagues and in the community. However, we estimated that the increase in mixing patterns was not sufficient to sustain local transmission in Shanghai, while the risk of an epidemic recurrence in the other three cities remained moderate as of November 2020. During the period of our post-epidemic survey (September 16 to November 8, 2020), fewer than 100 local cases were reported in Chinese mainland, and no local cases were reported in the four study locations, which is consistent with our estimates of the potential reproduction number. Finally, we performed a modeling analysis to evaluate the impact of social distancing in the event of a new SARS-CoV-2 outbreak of Omicron BA.5 or another highly transmissible variant. Our findings support that, although vaccination campaigns conducted in China with current vaccine products (as of 2022) are key to mitigating COVID-19 burden, if policymakers aim to prevent SARS-CoV-2 transmission altogether, social distancing measures are still essential.
Although workplaces, schools, and other public places gradually reopened from February to November 2020, many restrictions were still in place to prevent the resurgence of COVID-19. For example, 1) masks were mandated and body temperature was measured to enter indoor public places (9-10); 2) indoor mass gatherings were limited in schools (11); and 3) cinemas and theaters were operating at 75% or lower capacity, with the audience required to wear face masks and maintain a distance of at least one meter (12). From April to August 2020, China experienced several small-scale local outbreaks (13). The interventions adopted as well as the fear of infection may explain the slow resumption of contacts highlighted by our surveys in 2020.
Our results are comparable to those obtained in other studies that have assessed changes in contact patterns linked to the relaxation of COVID-19 control measures (2,14-17). After lifting stay-at-home orders and reopening workplaces in China, the United States, and several European countries, the mean number of contacts varied from two to nine per day, which is consistently higher than the number of contacts during lockdowns but significantly lower than the pre-pandemic level. Moreover, similar to Jarvis et al. (14), we found a larger proportion of indoor contacts than what was observed in the pre-COVID era.
Our study suffers from the traditional limitations of self-reported contact surveys, including recall, self-reporting, and selection biases, which may have affected our results. Although we explained the anonymity and confidentiality of the survey to study participants, we cannot rule out that the number of contacts may have been underreported during the post-epidemic period, when social distancing and other precautions were still in place. Our modeling analysis is intended to provide only general insights and is based on a set of approximations. For instance, the model does not explicitly consider symptomatic and asymptomatic individuals, pre-symptomatic transmission, the effect of individual-level interventions (e.g., test-trace-isolate, mask wearing), or the level of immunity provided by the primary vaccination cycle. Instead, we combine the effects of all these aspects into a single indicator: the effective reproduction number. Although this allowed us to provide a first-level approximation of the reduction of social contacts, more refined analyses are needed to identify the proper interventions required to contain a novel SARS-CoV-2 outbreak and/or mitigate the COVID-19 burden and pressure on the healthcare system.
Our study quantified contact patterns at different time points during the first year of the COVID-19 pandemic in Chinese mainland and provided evidence of a gradual recovery of contact patterns while social distancing measures were gradually relaxed. Moving forward, monitoring mixing patterns could inform authorities about the risk of resurgence of novel outbreaks caused by highly transmissible SARS-CoV-2 variants, and, in the event of an outbreak, social distancing is likely to play a key role in limiting SARS-CoV-2 transmission and mitigating the burden of COVID-19.
-
Allisandra G. Kummer from Indiana University.
| Citation: |

|