
 Download:


-
Life expectancy (LE) is an important indicator for the overall health of a population, usually refers to the total number of years a group of people at birth can expect to live, given existing age-specific mortality rates (1). Healthy China 2030, the national strategic health plan released in 2016, set a goal that by 2030, the average LE of Chinese residents should reach 79 years. To examine the success of the plan at its midterm stage, it is necessary to evaluate its achievements so far, and assess if the goal can be realized by 2030 in each provincial-level administrative division (PLAD) separately. This study used the data of the Global Burden of Diseases Study (GBD) 2019 to describe the LE changes from 1990 to 2019 in the mainland of China with 31 PLADs, and applied an ensemble of models to project national and subnational attainment of the LE goal through 2030. Findings showed that LE in China increased from 68.0 years in 1990 to 77.6 years in 2019, with significant sex and regional disparities. China as a whole will achieve the LE goal of 79 by 2030, based on the trend from 1990–2019. About 45% of PLADs may not reach the goal, most of which are western PLADs with lower socioeconomic levels. Enhanced policies and actions should be adopted in PLADs that may not achieve the LE goal.
Data for LE at birth and age-sex-specific mortality of China, and its 31 PLAD units (Hong Kong Special Administrative Region, Macao Special Administrative Region, and Taiwan, China were not included in this study) from 1990 to 2019, were obtained from GBD 2019, which used standardized and comparable methods to estimate national and subnational disease burden from 1990 to 2019, making it possible to examine the long-term trend of LE in China and its PLADs. Primary data sources for China include surveillance data from the China Disease Surveillance Points system, censuses, the Maternal and Child Health Surveillance system and national surveys (2). For the calculation of LE, the estimation of the probability of death between birth and the age of 5 years, and between ages 15 and 60 years was produced and then input into the GBD model life table system, to generate a complete set of age-sex-specific mortality rates and then develop the complete life tables for all PLADs and years (3). Details of the method have been published elsewhere (1,3–4).
A probabilistic Bayesian model average (BMA) was used to combine 21 individual models to make LE projections. These models took into account the features of mortalities related to age, period, and cohort, as well as statistical features such as giving more weight to recent data points (5). This approach more completely captured the uncertainty about future trends in LE, and the projection error was smaller than a single model (5). Details of the method were referred to a previous study (5).
In this study, 31 PLADs were divided into four categories based on the achievement of LE goals for both sexes combined, and the LE gains since 2015, the baseline year for Healthy China 2030 goals. Substantial gains were defined as LE changes ≥3 years and moderate gains as LE changes <3 years. We also assessed the contributions of mortality decline in three age groups (0–29 years, 30–64 years, and 65 years and older) toward the projected increase in LE at birth, by calculating LE at birth, at 30 years, and at 65 years in 2015 and 2030 for each PLAD, and then estimating the changes in LE of each age group and calculating its proportion in the total gains in LE at birth. All the analyses were carried out in the software R (version 4.0.3, R Core Team, Vienna, Austria) using the package “maple” (5).
In the mainland of China, LE at birth was 77.6 years in 2019, which marked a 9.6 year-increase since 1990. Women’s LE was higher than men’s, with a gap of 4.1 years in 1990 and 6.0 years in 2019. Generally, LE in eastern PLADs was higher than in central and western PLADs. In 2019, seven eastern PLADs already reached 79 years of LE, including Beijing Municipality, Shanghai Municipality, Zhejiang Province, Guangdong Province, etc. The lowest LE was in western PLADs like Xizang (Tibet) Autonomous Region (70.1 years), Xinjiang Uygur Autonomous Region (71.9 years), and Qinghai Province (72.1 years). LE has increased in all PLADs from 1990 to 2019. The three PLADs with the largest gains in LE were Xizang (Tibet) Autonomous Region (15.2 years), Jiangxi Province (14.2 years), and Guizhou Province (13.0 years), while the ones with the smallest gains were Hebei Province (5.7 years), Liaoning Province (6.2 years), and Tianjin Municipality (6.3 years) (Table 1).
Regions LE in 1990 (years) LE in 2019 (years) LE Change (years) Both Men Women Both Men Women Both Men Women The mainland of China 68.0 66.1 70.2 77.6 74.7 80.7 9.6 8.6 10.5 Eastern PLADs Beijing 73.6 71.4 76.2 82.7 79.6 85.9 9.1 8.2 9.7 Shanghai 74.5 72.4 76.6 82.7 80.3 85.0 8.2 7.9 8.4 Zhejiang 72.0 69.9 74.3 81.5 78.8 84.5 9.5 8.9 10.2 Guangdong 70.9 68.2 73.8 81.1 77.8 84.7 10.2 9.6 10.9 Jiangsu 71.9 69.5 74.4 80.8 77.9 83.8 8.9 8.4 9.4 Fujian 68.7 66.1 71.6 79.7 76.6 83.1 11.0 10.5 11.5 Tianjin 73.2 71.0 75.8 79.5 76.8 82.7 6.3 5.8 6.9 Shandong 70.5 68.3 72.8 78.7 75.7 81.9 8.2 7.4 9.1 Liaoning 71.0 68.6 73.8 77.2 73.8 81.0 6.2 5.2 7.2 Hainan 68.5 66.3 70.8 77.0 74.6 79.7 8.5 8.3 8.9 Hebei 70.0 68.0 72.3 75.7 72.6 79.1 5.7 4.6 6.8 Central PLADs Anhui 67.4 66.0 68.9 78.0 75.3 81.1 10.6 9.3 12.2 Jiangxi 63.4 61.4 65.5 77.6 74.8 80.6 14.2 13.4 15.1 Henan 69.0 66.7 71.3 77.5 74.4 80.7 8.5 7.7 9.4 Hubei 67.9 65.8 70.3 77.5 75.0 80.3 9.6 9.2 10.0 Jilin 67.0 64.3 70.4 77.1 75.8 78.4 10.1 11.5 8.0 Hunan 67.3 68.0 66.6 76.6 73.6 80.1 9.3 5.6 13.5 Shanxi 68.8 66.7 71.3 76.4 73.9 79.3 7.6 7.2 8.0 Heilongjiang 67.3 65.3 69.8 75.5 72.5 79.0 8.2 7.2 9.2 Western PLADs Shaanxi 65.0 63.3 67.1 76.7 74.4 79.4 11.7 11.1 12.3 Chongqing 65.8 63.4 68.8 76.5 73.8 79.5 10.7 10.4 10.7 Inner Mongolia 66.9 65.1 69.3 76.3 73.5 79.7 9.4 8.4 10.4 Gansu 66.0 63.7 68.6 76.1 73.6 78.9 10.1 9.9 10.3 Guangxi 68.3 66.0 70.9 76.1 72.6 80.2 7.8 6.6 9.3 Ningxia 65.2 63.3 67.5 75.9 73.4 78.6 10.7 10.1 11.1 Sichuan 66.1 64.3 68.1 75.5 72.5 79.0 9.4 8.2 10.9 Guizhou 61.8 60.0 63.9 74.8 72.1 77.8 13.0 12.1 13.9 Yunnan 62.6 60.3 65.2 74.2 71.1 77.9 11.6 10.8 12.7 Qinghai 62.5 60.6 64.7 72.1 70.1 74.4 9.6 9.5 9.7 Xinjiang 60.6 59.0 62.6 71.9 70.0 74.2 11.3 11.0 11.6 Tibet 54.9 52.2 57.8 70.1 67.6 72.9 15.2 15.4 15.1 Abbreviation: PLADs=provincial-level administrative divisions; LE=life expectancy. Table 1. Life expectancy at birth by sex in China, 1990 and 2019.
Based on the trend from 1990 to 2019, LE in China will reach 80.2 years [95% credible interval (CI): 78.7, 82.4] by 2030 for both sexes combined, with an increase of 3.5 years (95% CI: 2.0, 5.7) compared to 2015. Women’s LE will reach 83.8 years (95% CI: 81.6, 86.9) by 2030, while men’s LE will be 77.1 years (95% CI: 75.7, 79.4) (Table 2).
Regions LE in 2030
years (95% CI)Changes of LE from 2015 to 2030
years (95% CI)Both Men Women Both Men Women The mainland of China 80.2 (78.7, 82.4) 77.1 (75.7, 79.4) 83.8 (81.6, 86.9) 3.5 (2.0, 5.7) 3.4 (2.0, 5.6) 3.6 (1.4, 6.7) Group 1* Beijing 86.1 (82.7, 88.8) 82.4 (79.4, 84.8) 90.6 (85.8, 95.4) 3.4 (0.0, 6.2) 3.2 (0.3, 5.7) 4.0 (−0.9, 8.7) Guangdong 84.8 (82.5, 87.6) 80.9 (790., 83.6) 89.5 (86.0, 94.0) 4.3 (2.0, 7.0) 4.0 (2.0, 6.6) 4.9 (1.4, 9.4) Zhejiang 84.7 (82.6, 87.2) 81.4 (79.5, 83.6) 88.7 (85.9, 93.2) 3.8 (1.7, 6.4) 3.4 (1.5, 5.6) 4.6 (1.6, 8.9) Jiangsu 83.9 (81.7, 86.5) 80.5 (78.9, 82.9) 87.5 (84.0, 91.5) 3.7 (1.5, 6.3) 3.4 (1.8, 5.8) 3.9 (0.3, 7.8) Fujian 83.0 (81.1, 86.1) 79.7 (78.0, 82.4) 86.9 (84.4, 91.5) 4.2 (2.3, 7.2) 4.1 (2.4, 6.8) 4.3 (1.8, 8.9) Tianjin 82.0 (80.1, 84.3) 78.9 (77.3, 81.4) 85.7 (83.5, 88.8) 3.1 (1.1, 5.3) 3.0 (1.3, 5.4) 3.1 (0.8, 6.1) Shandong 81.2 (79.7, 82.9) 77.7 (76.5, 79.3) 85.1 (82.5, 88.2) 3.3 (1.6, 4.9) 2.9 (1.7, 4.4) 3.6 (1.0, 6.6) Anhui 80.9 (79.6, 82.9) 77.7 (76.5, 79.9) 84.4 (82.6, 87.4) 3.9 (2.6, 5.9) 3.5 (2.3, 5.7) 4.3 (2.5, 7.2) Jiangxi 80.7 (78.8, 83.4) 77.8 (75.8, 80.2) 83.8 (81.4, 87.0) 4.1 (2.2, 6.8) 4.1 (2.1, 6.5) 4.0 (1.5, 7.2) Hubei 80.0 (78.8, 82.0) 77.2 (75.7, 79.1) 83.1 (81.1, 86.5) 3.6 (2.4, 5.6) 3.4 (1.9, 5.2) 3.7 (1.7, 7.1) Jilin 79.8 (77.6, 81.7) 78.7 (75.9, 80.8) 80.9 (78.9, 82.9) 3.4 (1.2, 5.3) 3.7 (0.9, 5.8) 2.9 (0.9, 4.9) Shaanxi 79.2 (77.9, 81.2) 76.8 (75.5, 79.0) 82.0 (80.2, 84.8) 3.5 (2.1, 5.5) 3.5 (2.2, 5.7) 3.5 (1.6, 6.2) Chongqing 79.0 (78.1, 80.7) 76.2 (75.1, 78.1) 82.1 (80.6, 84.5) 3.7 (2.8, 5.5) 3.7 (2.6, 5.6) 3.6 (2.1, 6.0) Group 2† Shanghai 85.5 (82.8, 87.4) 82.8 (80.7, 84.4) 88.7 (84.5, 92.3) 2.9 (0.2, 4.9) 2.9 (0.8, 4.5) 3.2 (−0.9, 6.9) Henan 79.4 (78.1, 81.7) 76.2 (74.9, 78.2) 82.9 (80.9, 86.0) 2.8 (1.4, 5.0) 2.7 (1.5, 4.7) 2.9 (0.8, 5.9) Liaoning 79.3 (78.0, 81.4) 75.4 (74.1, 77.9) 83.8 (81.8, 86.5) 2.8 (1.4, 4.9) 2.5 (1.1, 4.9) 3.1 (1.0, 5.7) Hainan 79.0 (78.0, 80.5) 76.7 (75.7, 78.2) 81.9 (80.1, 84.0) 2.9 (2.0, 4.5) 3.0 (2.1, 4.6) 3.0 (1.3, 5.2) Group 3§ Inner Mongolia 78.9 (77.6, 81.2) 75.9 (74.5, 78.5) 82.5 (80.5, 85.7) 3.5 (2.2, 5.9) 3.5 (2.1, 6.1) 3.5 (1.5, 6.7) Hunan 78.9 (77.6, 80.9) 75.4 (73.2, 77.7) 83.4 (80.4, 86.4) 3.3 (1.9, 5.2) 2.9 (0.9, 5.2) 4.0 (0.9, 6.9) Gansu 78.3 (77.0, 80.6) 75.8 (74.4, 78.2) 81.3 (79.4, 84.2) 3.3 (2.1, 5.6) 3.4 (1.9, 5.8) 3.4 (1.5, 6.3) Ningxia 78.1 (77.1, 79.7) 75.6 (74.6, 77.5) 81.0 (79.5, 83.1) 3.2 (2.3, 4.8) 3.2 (2.3, 5.2) 3.2 (1.6, 5.3) Heilongjiang 77.9 (76.6, 79.1) 74.6 (73.3, 76.1) 81.7 (79.9, 83.6) 3.1 (1.8, 4.3) 2.9 (1.6, 4.4) 3.2 (1.3, 5.1) Sichuan 77.7 (76.4, 80.1) 74.4 (73.3, 76.6) 81.5 (79.3, 84.8) 3.3 (2.0, 5.6) 3.0 (1.9, 5.3) 3.3 (1.1, 6.7) Guizhou 77.4 (76.2, 79.3) 74.7 (73.5, 76.7) 80.3 (78.6, 82.7) 3.8 (2.6, 5.7) 3.7 (2.6, 5.8) 3.5 (1.9, 5.9) Yunnan 76.5 (75.3, 78.1) 73.2 (72.0, 75.1) 80.2 (78.3, 82.3) 3.3 (2.1, 4.9) 3.2 (2.0, 5.2) 3.1 (1.1, 5.2) Xinjiang 74.6 (73.1, 76.3) 72.5 (70.9, 74.6) 76.8 (75.0, 78.7) 3.8 (2.4, 5.6) 3.9 (2.3, 6.0) 3.5 (1.7, 5.4) Qinghai 74.4 (73.2, 76.3) 72.3 (71.2, 74.4) 76.7 (74.9, 78.8) 3.4 (2.3, 5.4) 3.5 (2.4, 5.6) 3.3 (1.5, 5.4) Tibet 73.5 (70.4, 76.2) 71.1 (68.0, 73.8) 76.1 (72.8, 78.8) 4.4 (1.4, 7.2) 4.9 (1.8, 7.6) 3.9 (0.7, 6.7) Group 4¶ Shanxi 78.5 (77.2, 79.7) 75.8 (74.7, 77.3) 81.6 (79.6, 83.6) 2.9 (1.6, 4.1) 2.8 (1.7, 4.3) 2.9 (0.9, 4.8) Guangxi 77.9 (76.6, 79.9) 74.0 (72.7, 76.0) 82.5 (80.4, 85.1) 2.7 (1.4, 4.6) 2.4 (1.1, 4.4) 2.9 (0.7, 5.4) Hebei 77.7 (75.9, 80.6) 74.5 (72.6, 77.1) 81.3 (79.0, 84.4) 2.9 (1.1, 5.8) 2.8 (1.0, 5.5) 2.8 (0.4, 5.8) Abbreviation: CI=credible interval; LE=life expectancy.
* Group 1: LE ≥79 years by 2030, and changes ≥3 years (goal achieved, substantial gains).
† Group 2: LE ≥79 years by 2030, and changes <3 years (goal achieved, moderate gains).
§ Group 3: LE <79 years by 2030, and changes ≥3 years (goal not achieved, substantial gains).
¶ Group 4: LE <79 years by 2030, and changes <3 years (goal not achieved, moderate gains).Table 2. Forecasted life expectancy at birth by sex in China, 2030.
It’s estimated that 17 PLADs will achieve the LE goal by 2030, and 14 PLADs may not. We divided 31 PLADs into four categories. Group 1 includes 13 PLADs, which will achieve the goal and substantially increase LE by 2030. Seven are from the eastern area, with Beijing Municipality having the nationwide highest LE at 86.1 years (95% CI: 82.7, 88.8). Shaanxi Province and Chongqing Municipality are the only two western PLADs that will achieve the goal. Group 2 includes four PLADs, three from the eastern area and one from the central area, which will achieve the goal but with a moderate increase in LE (Table 2).
Group 3 includes 11 PLADs that may not achieve the goal but with a substantial increase in LE, nine from the western area and two from the central area. Tibet is projected to have the nationwide lowest LE at 73.5 years (95% CI: 70.4, 76.2) by 2030 but with the largest gain at 4.4 years (95% CI: 1.4, 7.2). Group 4 has three PLADs, which may not meet the goal and only have moderate increases in LE. Notably, Hebei Province is the only eastern PLAD that may not achieve the LE goal (Table 2).
In most PLADs, over half of the projected gains in LE among women from 2015–2030 will be due to mortality declines in the age group above 65 years. However, the contribution in the same age group will be much less among men. For most western PLADs, more than half of the gains in LE will be due to mortality declines in age groups below 65 years (Figure 1).
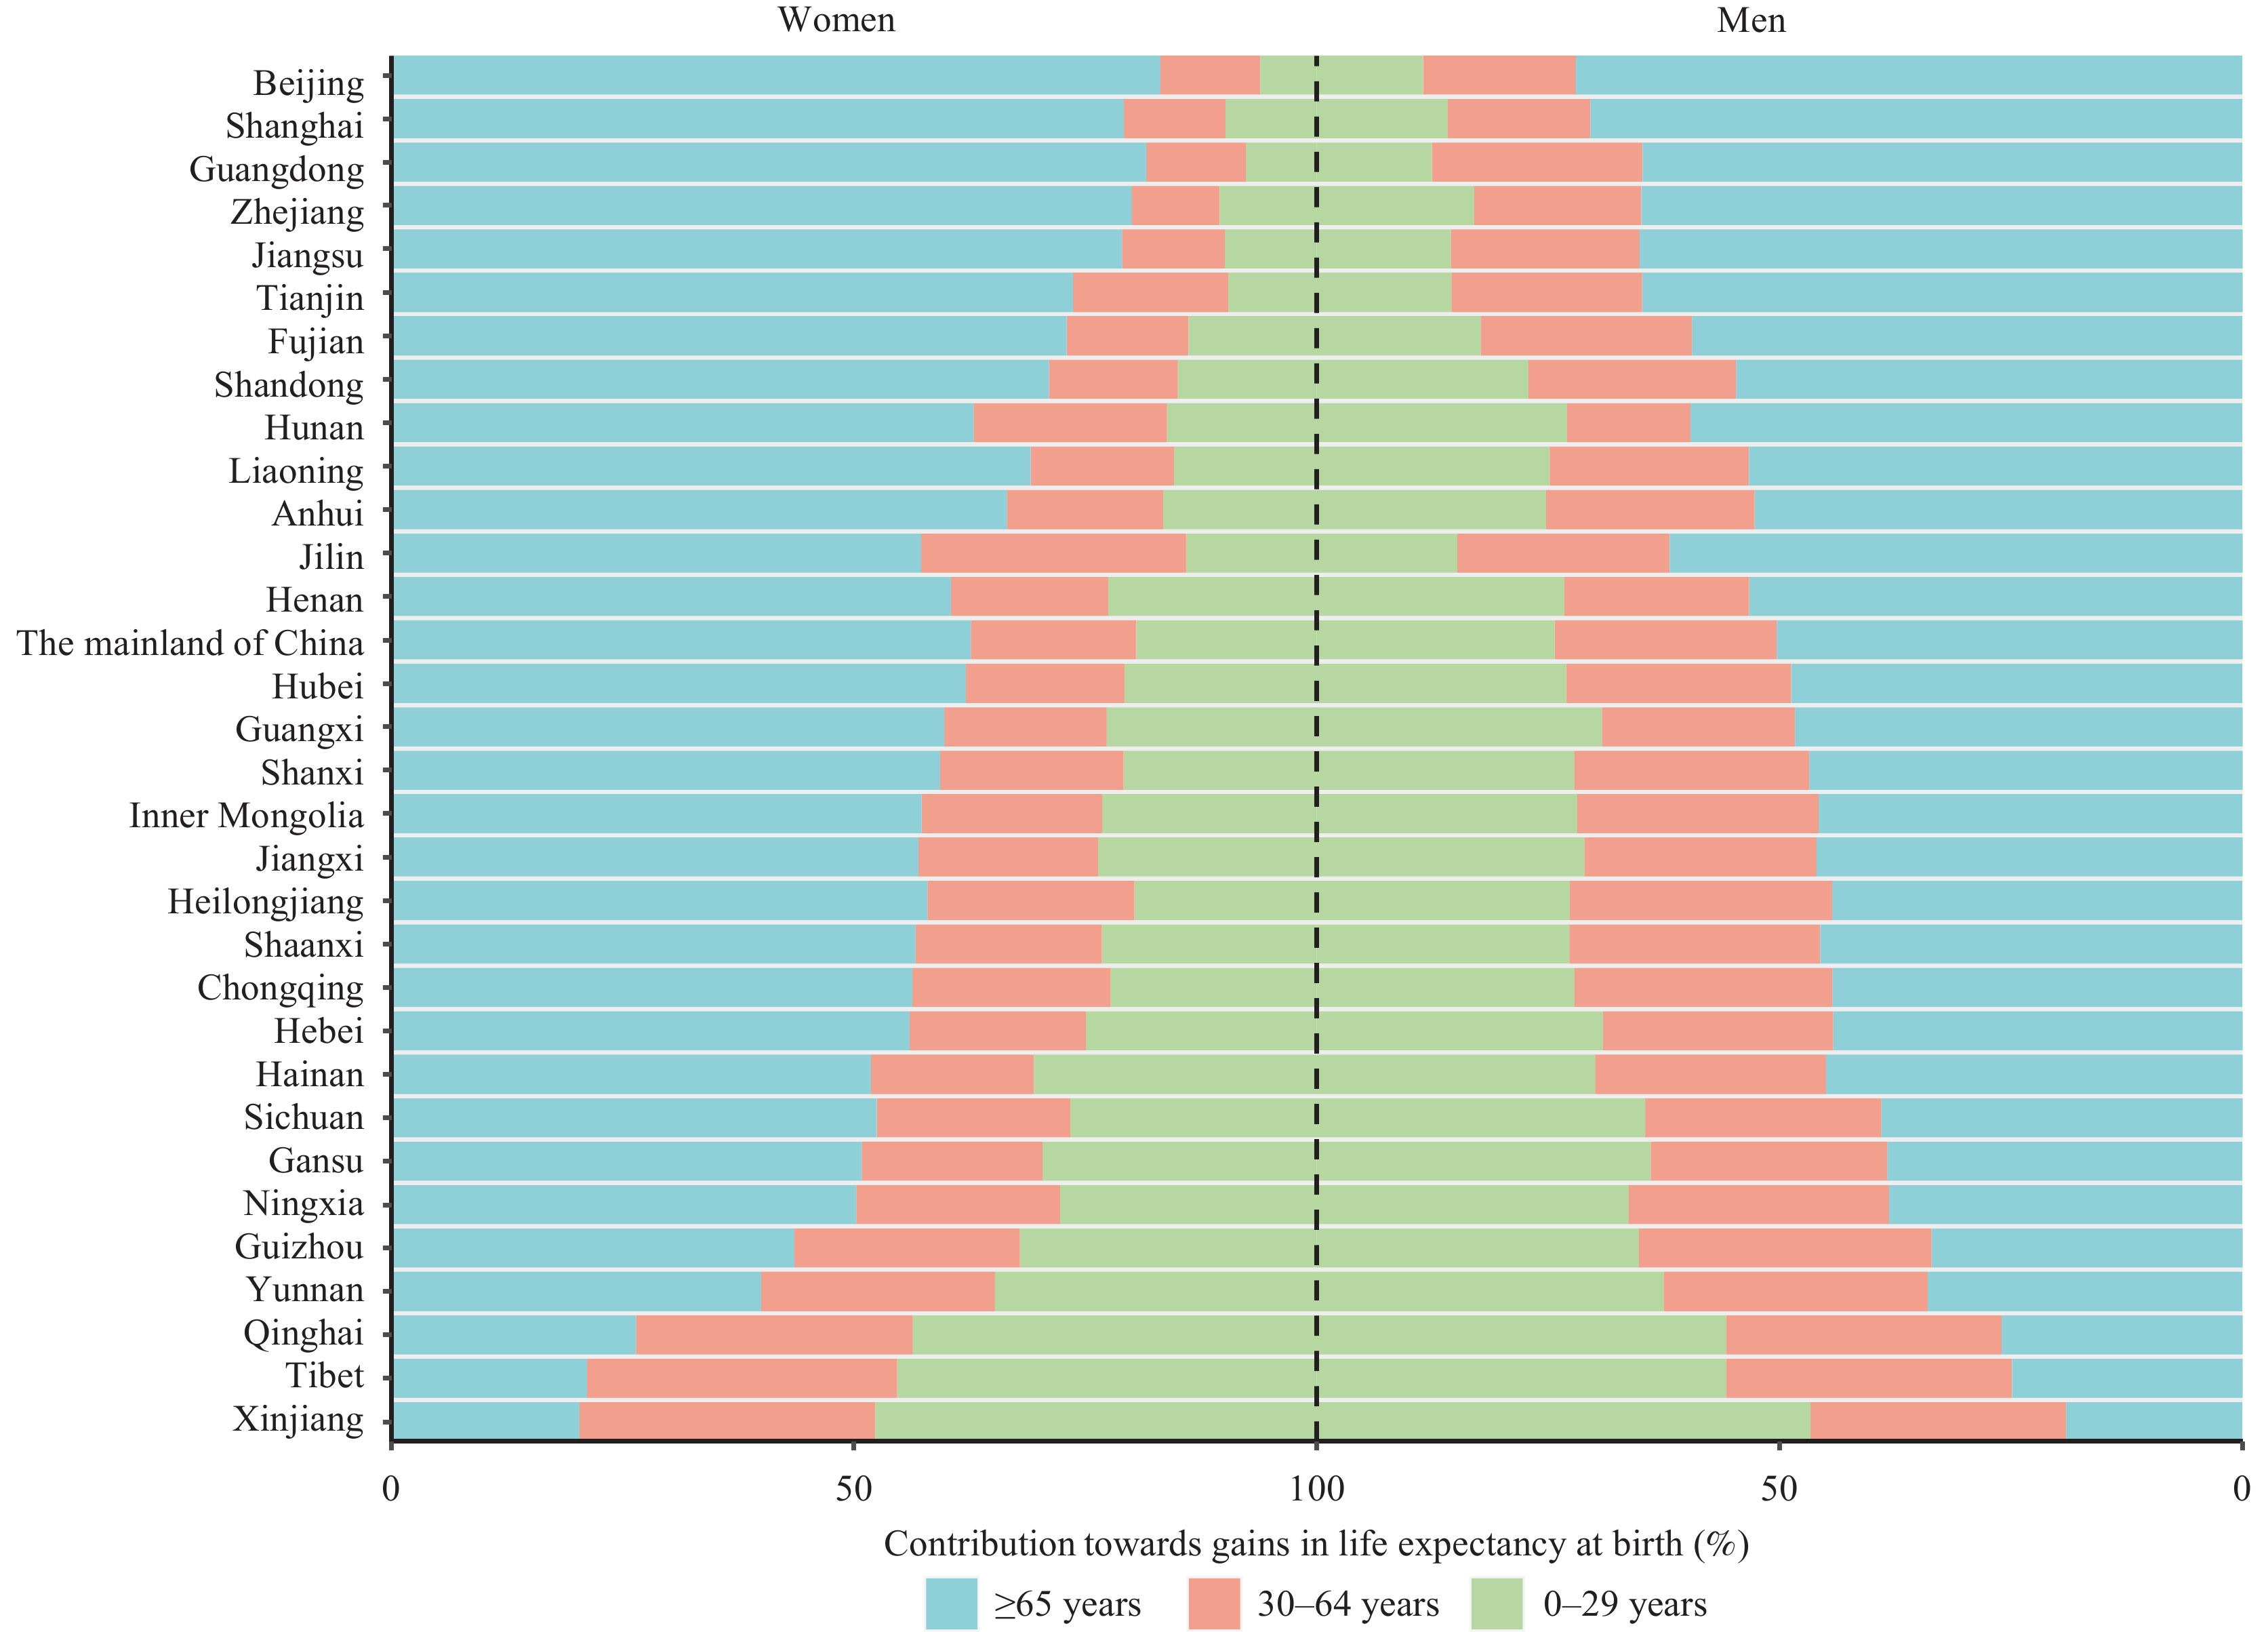 Figure 1.
Contribution of the projected decline in mortality in three age groups toward the gains in life expectancy at birth in China, 2015‒2030.
-
Consistent with other studies (1,6), this study found that LE at birth in the mainland of China increased remarkably from 1990 to 2019, but with significant sex and regional disparities. Generally, women and residents in eastern PLADs have higher LE than men and ones from central and western PLADs. LE in PLADs such as Beijing Municipality, Shanghai Municipality, and Zhejiang Province has reached the level of high-income countries (1). While western PLADs such as Xizang (Tibet) Autonomous Region and Xinjiang Uygur Autonomous Region, although with significant increases in LE, still have a huge gap with the PLADs having the highest LE. Differences in social determinants of health, like economic development, urbanization, education attainment, income equality, and healthcare provision, may explain the spatial variations in LE (7).
Overall, based on the trends from 1990 to 2019, China will be able to achieve the LE goal of 79 by 2030. However, about 45% of PLADs may not reach the goal, most of which are located in western PLADs with communities in lower socioeconomic strata. Previous study showed that since 1990, the main contributors to the increase of LE in China have shifted from children to older adults, and from infectious diseases and neonatal disorders to chronic diseases (8). While in most western PLADs, the transition seemed incomplete yet, where mortality declines among the elderly would contribute a relatively small part to the LE improvement. In addition, special attention should be given to those PLADs that may not meet the goal and have limited gains in LE, like Hebei Province, which had the lowest increase in LE from 1990 to 2019 and a high burden of cardiovascular diseases, including a high stroke burden not matched with its socio-demographic condition (2), indicating strengthened measures should be taken.
This study has at least two limitations. One is that the study was based on GBD data, and bias in the estimation of deaths in GBD would affect the final projection results. The other limitation is that the possible impact of COVID-19 was not ccounted in the projection. Evidence showed that the epidemic seemingly had no significant impact on LE from 2020–2021 in China (9) due to the strict dynamic zero-COVID policy for outbreak containment. However, with the relaxation of the policy since the end of 2022, the impact of COVID-19 needs further monitoring and evaluation.
While the country is making headway toward the LE goal, there is still uncertainty about the future. The findings of this study would support efforts for monitoring Healthy China 2030, and help to inform policies and decision-making at both national and subnational levels. Enhanced policies and actions should be adopted in PLADs that may not achieve the LE goal or make slow progress.
-
No conflicts of interest.
HTML
| Citation: |

|