

 Download:


-
Human brucellosis is one of the most important zoonotic diseases caused by bacteria of genus Brucella (1). Human brucellosis is primarily acquired through contact with infected animals or their products and the consumption of contaminated animal food. Human brucellosis reemerged in the mainland of China during the mid-1990s, reaching a historically high record of 57,222 cases reported in 2014, slowly decreasing to 37,947 in 2016, and rebounding to 44,036 in 2019 (2-3). It is important to explore the recent epidemic pattern and hotspot areas using temporal-spatial analysis to precisely provide policy recommendations for brucellosis control on the county (district) level. At present, the spatiotemporal analysis of brucellosis in China is mainly based on provincial or prefecture polygons (2-3), or only focused on certain northern China (3-5), especially Inner Mongolia (IM). There is a gap in the literature examining spatial-temporal patterns of county polygons in human brucellosis. Therefore, this study aimed to explore the epidemiological characteristics, spatial-temporal distribution patterns, and detect high-risk areas for human brucellosis from 2020 to 2021 nationwide at the county level in China.
-
The human brucellosis data were extracted from the Chinese National Notifiable Disease Reporting System (NNDRS). Descriptive epidemiology was used to analyze the epidemiological characteristics. The research described the annual incidence (AI) and seasonality by stratifying the country into southern and northern regions using the same definition as in previous studies (5). SAS (version 9.4, SAS Institute Inc., Cary, USA) and Excel 2010 (Microsoft Corp., Redmond, WA., USA) were used to analyze and draw statistical figures. Disease maps of human brucellosis from 2020 to 2021 in China were visualized with annual incidence using ArcGIS Desktop software (version 10.6; Esri; Redlands, California, USA), based on county boundaries.
The space-time scan statistic (STSS) based on spatial dynamic window scanning statistics was used to explore the spatial-temporal clustering of human brucellosis. Monte Carlo simulations were performed to access P-values using a Poisson model. The log-likelihood ratio (LLR) and relative risk (RR) were calculated to test the hypotheses for each scanning window. The cluster with the maximum LLR is the primary cluster, and the other clusters are secondary (6). This research explored the space-time clusters for each year and used 10% of the studied population as the maximum cluster size, setting the time interval as half a year.
-
From 2020 to 2021, a total of 117,012 human brucellosis cases were reported from 31 provincial-level administrative divisions (PLADs). The annual number of cases reported nationwide was 47,245 (3.4/100,000) in 2020 and increased to 69,767 (5.0/100,000) in 2021. The number of cases in 2021 increased by 47.7% compared to that in 2020; the incidence increased by 46.9% from 2020 to 2021. The peak season for human infections is from March to August, accounting for 66.0% of the total cases nationwide. The northern and southern regions had similar seasonal distributions (Figure 1).
 Figure 1.
Monthly distribution of human brucellosis in Northern and Southern China, 2020–2021.
-
Among all the human brucellosis cases nationwide, males accounted for 70.9% and 72.0% in 2020 and 2021, respectively, with a sex ratio of 2.4:1 and 2.6:1 in 2020 and 2021 (χ2=17.432, P<0.001). In 2020, the percentage of persons aged between 25 and 64 years was 81.5%, which was 81.7% in 2021 (χ2=191.058, P<0.001). In 2020, farmers and herders accounted for 84.5% of the total patients, and the proportion in 2021 was 85.5% (χ2=195.219, P<0.001).
-
From 2020 to 2021, 95.5% of the total cases were centralized nationwide in Northern China. IM reported the most cases (37,257 cases; 31.8% of the total nationwide) and had an average annual incidence (AAI) of 75.7/100,000. The other 10 PLADs with the highest number of cases were located in northern China (Liaoning, Shanxi, Henan, Ningxia, Xinjiang, Hebei, Gansu, Heilongjiang, Shandong, and Jilin), with AAI ranging from 2.8/100,000 to 55.4/100,000, and the increasing amplitude in AI ranging from 24.4% to 194.7% (Table 1). In Southern China, the AAI ranged from 0.2/100,000 to 1.1/100,000, and the increasing amplitude in AI ranged from 16.1% to 109.1% in the 10 PLADs with the highest number of cases. In Yunnan, the incidence exceeded 1.0/100,000 (Table 1).
PLADs 2020 2021 Increasing amplitude in incidence (%) Case (n) Incidence (per 100,000) Case (n) Incidence (per 100,000) Northern China Inner Mongolia 15,944 62.8 21,313 88.6 41.2 Liaoning 2,965 6.8 5,449 12.8 87.8 Shanxi 3,365 9.0 4,823 13.8 53.1 Henan 3,110 3.2 4,888 4.9 52.3 Ningxia 2,934 42.2 4,943 68.6 62.5 Xinjiang 3,010 11.9 4,780 18.5 55.0 Hebei 2,968 3.9 4,664 6.3 59.8 Gansu 2,956 11.2 4,562 18.2 63.2 Heilongjiang 2,884 7.7 4,048 12.7 65.3 Shandong 2,372 2.4 3,323 3.3 38.6 Jilin 1,136 4.2 1,265 5.3 24.4 Qinghai 263 4.3 756 12.8 194.7 Southern China Yunnan 381 0.78 699 1.48 89.7 Guangdong 355 0.31 455 0.36 16.1 Anhui 231 0.36 340 0.56 55.6 Jiangsu 166 0.21 285 0.34 61.9 Hunan 161 0.23 239 0.36 56.5 Sichuan 129 0.15 199 0.24 60.0 Zhejiang 123 0.21 178 0.28 33.3 Guangxi 120 0.24 224 0.45 87.5 Fujian 110 0.28 182 0.44 57.1 Jiangxi 49 0.11 103 0.23 109.1 Abbreviation: PLADs=provincial-level administrative divisions. Table 1. Human brucellosis reported cases and incidence in the PLADs of Northern and Southern China from 2020 to 2021.
-
The number of districts and counties with reported cases increased from 1,888 in 2020 to 2,083 in 2021, an increase of 10.4%. The number of counties with an incidence above 100.00 per 100,000 was 34 in 2020 and 65 in 2021, the majority of which were located in IM (31, 88.6% in 2020, and 46, 70.8% in 2021). In 2021, Ningxia, Xinjiang, and Gansu had the number of counties with an incidence above 100.00 per 100,000 was 6, 5, 5, respectively. In 2020, the number of counties with an incidence exceeding 10.00 per 100,000 was 344; 83 were located in IM, and the others were located in Xinjiang (53), Shanxi (49), Heilongjiang (34), Gansu (29), and Ningxia (20) (Figure 2A). In 2021, the number of counties with an incidence of more than 10.00 per 100,000 was 517; these counties were located in IM (95), Shanxi (79), Xinjiang (67), Heilongjiang (56), Hebei (38), Gansu (37) (Figure 2B). Counties affected by human brucellosis spread from IM to neighboring PLADs (Figure 2A, 2B).
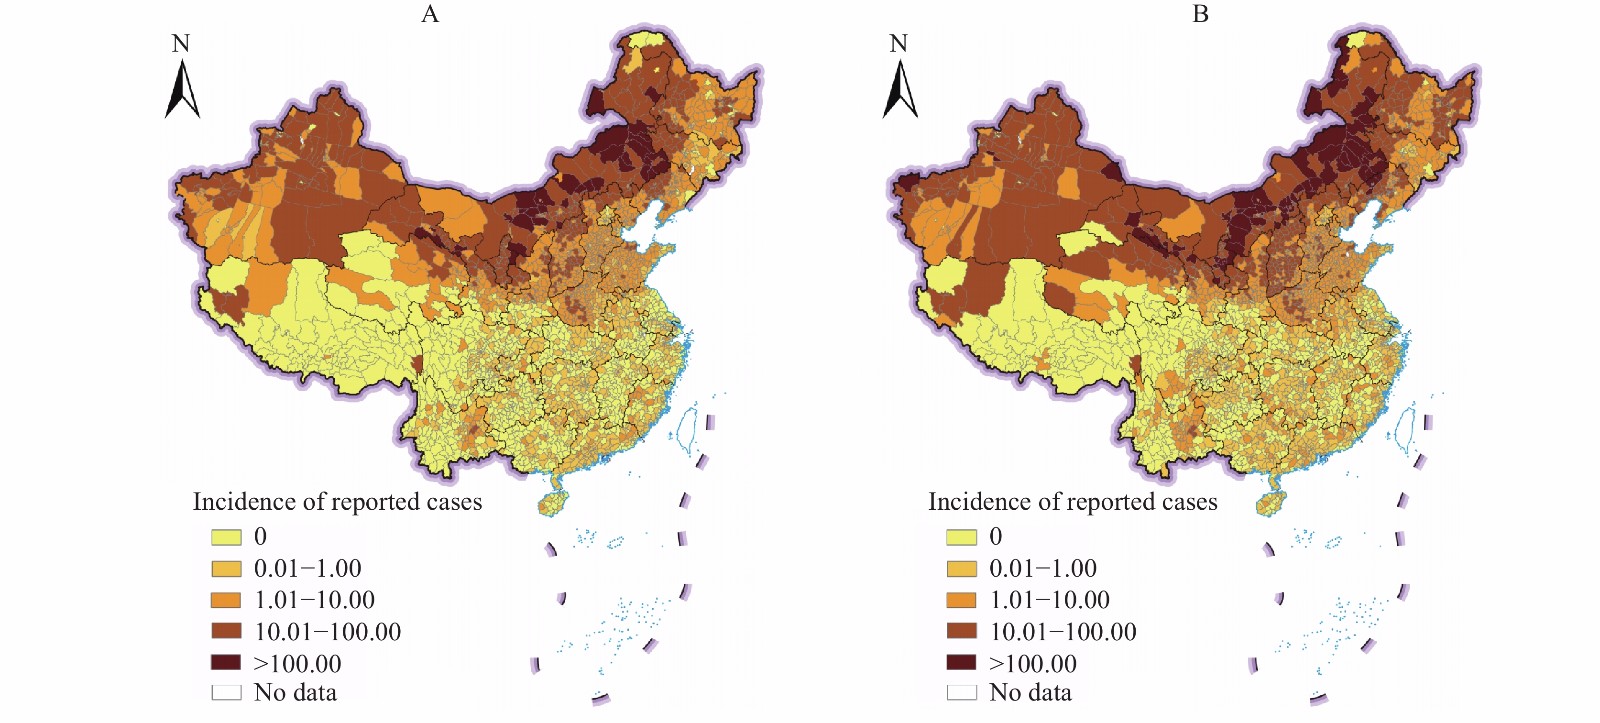 Figure 2.
Geographical distribution of the reported human brucellosis in 31 PLADs of China, 2020–2021. (A) Incidence of reported cases in 2020. (B) Incidence of reported cases in 2021.
Abbreviation: PLADs=provincial-level administrative divisions. -
In a total of 24 space-time clusters of human brucellosis were detected over the past two years, including two primary clustering areas and twenty-two secondary clustering areas. The coverage center of the primary clustering area was located in the Ulgai management (45.7N, 118.8E), Xilin Gol League, northeast part of the IM. The primary cluster covers 109 counties in 2020 and 2021. The total number of counties covered by the secondary clustering area increased from 208 in 2020 to 297 in 2021. In 2020, the counties covered by secondary clusters were mainly located in IM (54), Shanxi (49), Hebei (24), Henan (21), Ningxia (20), and Shaanxi (20). In 2021, these mainly involved Shanxi (81), Henan (57), IM (55), Hebei (41), Ningxia (20), and Shaanxi (20) (Figure 3). Among the 24 space-time clusters, 18 clusters occurred from February to August, and five clusters occurred from March to September (Table 2).
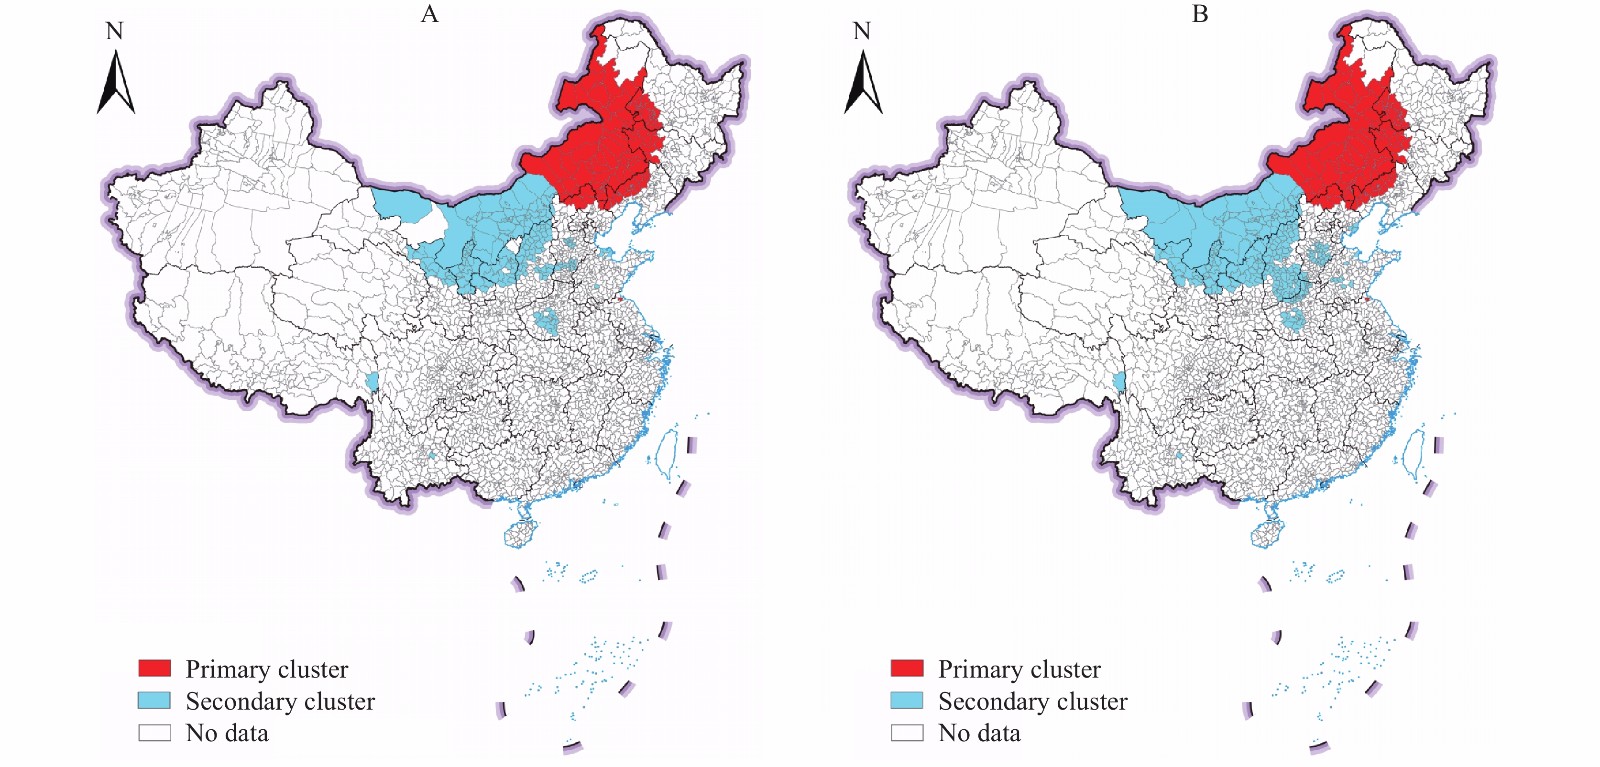 Figure 3.
Spatial clustering of the reported brucellosis cases in 31 PLADs of China from 2020 to 2021. (A) Spatial clustering in 2020; (B) Spatial clustering in 2021.
Scan time frame (year) Cluster time (mm/dd–mm/dd) Centroid (latitude, longitude)/ radius (km) Cluster counties (n) LLR RR P-value 2020 2/20–8/20 (45.7N, 118.8E)/530.6 109 14503.2 13.5 <0.001 2020 3/1–8/28 (45.7N, 118.8E)/584.3 149 9001.7 9.0 <0.001 2020 4/1–9/5 (33.7N, 112.9E)/87.7 20 294.9 3.0 <0.001 2020 2/8–8/25 (37.0N, 113.0E)/72.0 9 248.2 5.5 <0.001 2020 4/12–10/1 (24.8N, 103.3E)/0 1 66.8 8.8 <0.001 2020 4/23–8/17 (37.4N, 115.4 E)/44.5 8 35.4 2.5 <0.001 2020 5/18–8/12 (37.9N, 118.5E)/42.8 3 33.5 4.5 <0.001 2020 4/7–8/10 (35.7N, 117.2 E)/0 1 31.5 4.6 <0.001 2020 5/8–11/2 (32.7N, 113.3E)/0 1 29.5 3.5 <0.001 2020 3/1–8/1 (29.7N, 98.6 E)/0 1 23.2 9.6 <0.001 2020 5/1–7/4 (38.8N, 115.5E)/34.3 10 23.1 2.3 <0.001 2020 4/22–8/20 (37.3N, 114.5E)/323.9 5 19.6 2.4 <0.01 2021 2/1–8/1 (45.7N, 118.8E)/530.6 109 18918.0 14.1 <0.001 2021 2/20–8/20 (41.1N, 107.1E)/586.39 153 17357.7 11.6 <0.001 2021 2/10–8/5 (33.7N, 112.9E)/87.7 22 714.0 3.7 <0.001 2021 2/25–8/15 (36.1N, 112.9E)/150.2 78 424.4 2.2 <0.001 2021 2/24–8/21 (24.8N, 103.3E)/0 1 233.6 16.9 <0.001 2021 3/20–9/15 (38.0N, 115.5E)/85.4 33 155.8 2.0 <0.001 2021 3/28–9/1 (35.7N, 117.3E)/0 1 101.0 6.6 <0.001 2021 2/23–8/23 (35.7N, 117.9 E)/0 1 57.2 4.8 <0.001 2021 3/17–7/23 (39.4N, 118.9E)/38.4 3 54.8 3.3 <0.001 2021 3/24–9/14 (36.2N, 116.8 E)/30.4 3 21.9 1.9 <0.05 2021 5/1–8/29 (29.7N, 8.6E)/0 1 19.9 9.2 <0.05 2021 4/5–8/8 (37.2N, 117.8E)/0 1 18.6 4.2 <0.05 Abbreviation: LLR=log likelihood ratio; RR=relative risk. Table 2. Space-time clusters of human brucellosis in China, 2020–2021.
-
The epidemic of human brucellosis in China from 2020 to 2021 has been on the rise, with a rapidly increasing incidence, and an increase in the number of districts and counties experiencing infection. The incidence of brucellosis is characterized by spatiotemporal aggregation. The majority of space-time clusters occurred from February to August. The high-risk areas for brucellosis spread from IM to neighboring PLADs, and even presented in Xinjang, thereby involving more areas.
There may be several reasons for the rising momentum of human brucellosis in China. First, human brucellosis is mainly transmitted by infected livestock, especially in sheep or goats, and human-to-human transmission is rare. The prevalence of brucellosis in ovine and caprine flocks in China had increased from 1.0% in the 2000–2009 period to 3.2% in the 2010–2018 period (7). However, it seemed that the control measures on animal brucellosis such as vaccination had been relaxed and insufficient. For example, as a PLAD with a developed animal husbandry industry, IM’s annual stock is dominated by ewe with a proportion of 65%, none of the ewes are vaccinated (8). In addition, Chinese demand for livestock products has increased in recent years even in southern China and the price of beef and lamb has been increasing, which contributed to the growth in the number of sheep raised and persons engaged in husbandry. The number of sheep rose from 31010.5 (×10,000 head) in 2018 to 31941.3 (×10,000 head) in 2020 nationwide (9). Frequent trade activity accelerated the flow of livestock products, which may lead to the spread of the disease (10). The inadequate implementation of quarantine measures for trans-regional livestock transport could also act as the driver of the expanding trend (11-12).
Spatiotemporal aggregation was mainly detected in the eastern and central parts of IM and neighboring PLADs, which is consistent with previous reports (5). However, compared in 2010–2018 period to previous studies, the center of the primary space-time clusters shifted to the east and the number of counties involved in the cluster increased. This study suggests that the epidemic is on the rise and spreading east. Other studies also have shown that the brucellosis positivity rate in sheep in the eastern part of China is 7%, which is higher than in other parts of the country (7). IM is an important livestock husbandry center with a suitable climate and high vegetation cover creating optimal conditions for the survival of Bacteria spp (8). Furthermore, farmers and herdsmen primarily conduct production activities at their residences or surrounding areas, which could have caused a high incidence, especially in IM and the adjacent areas in the neighboring provinces (5,12).
The epidemic period of temporal-spatial clusters in the past two years exhibited distinct seasonal characteristics, with peaks in late spring and summer, which was consistent with the incidence of brucellosis. This peak coincided with the lambing season (2). The demographic characteristics of human brucellosis cases from 2020 to 2021 were predominantly young and middle-aged farmers or herdsmen (11-12), which are consistent with those of previous studies. These occupations involve breeding, slaughtering, grazing, fur processing, and trading livestock, and therefore this group was subject to higher exposure and infection opportunities.
This study has several limitations. First, data quality may be affected by the quality of reporting in different regions. Owing to its atypical symptoms and signs, human brucellosis is underreported and misdiagnosed. However, we were able to utilize the most up-to-date and comprehensive dataset. Furthermore, less than one-tenth codes for counties in the case data set could not be matched to those in the map data set, however, given that the proportion is small, the data is still representative.
In general, more resources need to be allocated to high-risk areas, such as IM and its surrounding provinces and Xinjiang, to strengthen the prevention and control of animal brucellosis to mitigate the situation. The animal husbandry department needs to secure more resources and effort control measures on animal brucellosis such as the Quarantine-Slaughter-Immunization. Given that the factors affecting the livestock epidemic are difficult to eliminate in the short term, the Department of Health should continue to promote health education campaigns to reduce the exposure of high-risk populations as well as promoting early diagnosis and prompt treatment.
HTML
Temporal Trend and Seasonality
Social-Demographical Characteristics
Geographical Distribution Stratified by Northern and Southern China
High-Risk Areas Based on Counties (Districts) Polygon
Space-Time Cluster Based on Counties (Districts) Polygon
| Citation: |

|