

 Download:


-
The outbreak of coronavirus disease 2019 (COVID-19) at the end of 2019 has caused a global pandemic and presents a major challenge to human health and survival. Accurately predicting the incidence of the COVID-19 epidemic can help distribute medicine and other health resources, take prompt and effective control measures, and suppress the spread of the epidemic. The compartment model divides the population into different compartments categorized by their epidemiological status. Ordinary differential equations were used to express the continuous dynamic changes among different compartments. Different epidemic processes of infectious diseases were simulated by adjusting the differential equations. The autoregressive integrated moving average (ARIMA) model is a time series prediction method that uses autocorrelation analysis of time series data to identify patterns of change and predict future points in the series. Previous research studies (1-4) have applied these two models in predicting COVID-19 epidemics, but few have compared them. Therefore, this study aims to compare the performance of the two models during the early COVID-19 outbreak in China. According to the timing of intervention measures and their effects, this paper divides the timeline of the epidemic into 3 stages: 1) Stage 1 from December 2, 2019, when the first case was reported, to January 22, 2020, when few interventions were taken during this stage; 2) Stage 2 from January 23 to February 1, 2022, when cordon sanitaire was implemented during this stage; 3) Stage 3 from February 2 to April 8, 2022, when centralized isolation and expanded testing were applied during this stage (details are provided in
Supplementary Materials andSupplementary Figure S1 ). -
The COVID-19 infection data was extracted from the Infectious Disease Reporting System of Chinese Center for Disease Control and Prevention from December 2, 2019 to April 8, 2020. The data included the reported onset date of the infection, which is the date when an infected person reported symptoms such as fever, cough, and other respiratory symptoms, and the clinical severity of each infected person, which ranged from asymptomatic, mild, moderate, severe, and critical. After excluding asymptomatic infections, a total of 81,102 confirmed cases were sorted to obtain the number of daily new cases. This was used to construct time series models and compartment models as well as to evaluate their fit and predictive effects. The population data for the same period were collected from the official website of the National Bureau of Statistics (5).
-
First, this study compared the effects of the two models in fitting the complete transmission process of the epidemic. Second, the study compared the predictions of the number of new cases without cordon sanitaire by the two models. Finally, the study compared predictions without centralized isolation and expanded testing by two models.
-
The coefficient of determination (R2) was used to compare the fitting of the model. The formula is as follows:
$$ {R^2} = 1 - \frac{{\sum {{{(X_i^* - {X_i})}^2}} }}{{\sum {{{(X_i^* - \overline {{X_i}} )}^2}} }} $$ (1) $ {X}_{i}^{*} $ is the true value in moment$ i $ ,$ {X}_{i} $ is the predicted value in moment$ i $ , and$ \stackrel{-}{{X}_{i}} $ is the mean of true values. -
Packages “aTSA,” “forecast,” and “BayesianTools” in the R software (version 4.0.5, R Foundation for Statistical Computing, Vienna, Austria) were used to construct the ARIMA model and the compartment model and to predict new infections. P<0.05 was considered statistically significant (α=0.05).
-
For the compartment model, the parameters of the Stages 1–3 of the model (more details are provided in
Supplementary Materials ,Supplementary Table S1 , andSupplementary Figure S2 ) were used to simulate the complete transmission process of the epidemic. The results are shown in Figure 1A. For the ARIMA model, the unit root test was performed on the onset sequences of Stages 1–3, and the results showed that the sequences were stationary. The autocorrelation coefficient and partial correlation coefficient of the stationary series are shown inSupplementary Figure S3A andS3B . The p=1–3 and q=1–3 of the onset sequence of the Stages 1–3 were preliminarily determined; the results of the residual white noise test on the 9 initially determined alternative models are shown inSupplementary Table S2 . According to the principle of Bayesian Information Criterion (BIC) minimization, ARIMA (1,2,1) was selected as the optimal model for the onset sequence of Stages 1–3. The optimal model was used to simulate complete transmission process of the epidemic and was compared with the compartment model (Figure 1B). The calculated R2 values of the compartment model and the ARIMA model were 0.964 (P<0.001) and 0.933 (P<0.001), respectively.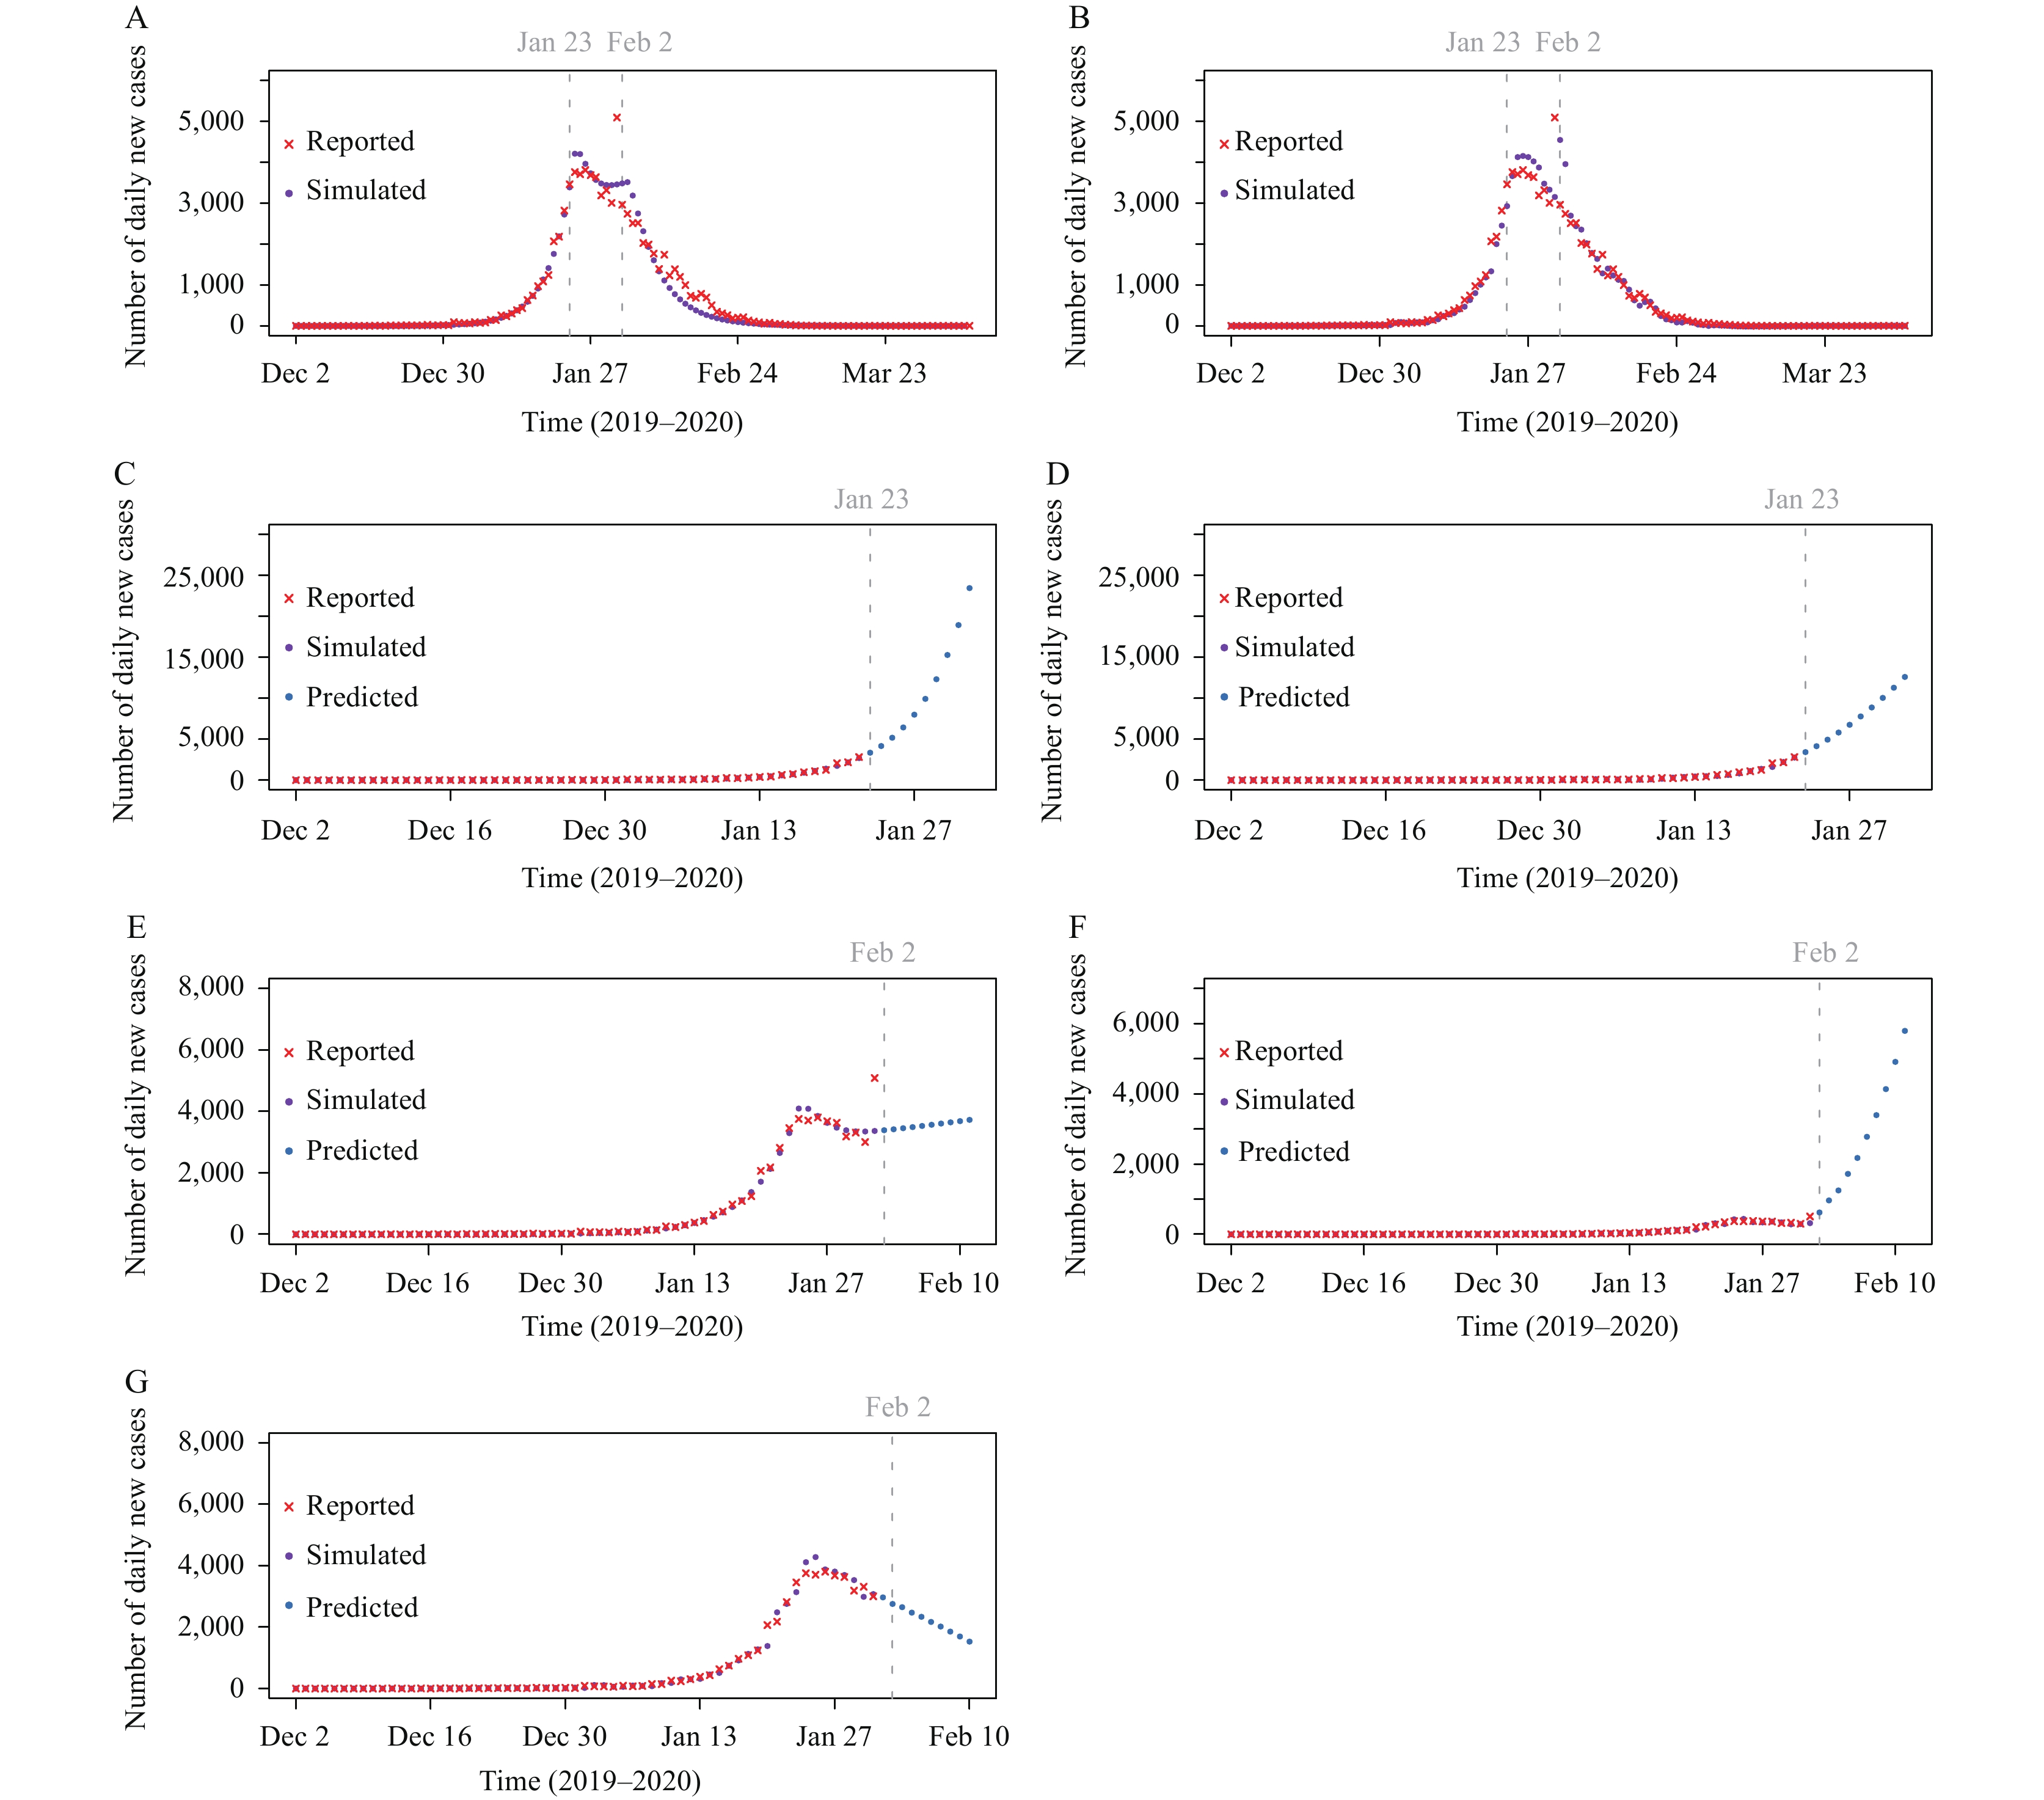 Figure 1.
Comparison of
the two models. (A) The results of the compartment model in fitting the complete transmission process of the epidemic; (B) The results of the ARIMA model in fitting the complete transmission process of the epidemic; (C) The prediction results of the compartment model without cordon sanitaire implemented; (D) The prediction results of the ARIMA model without cordon sanitaire implemented; (E) The prediction results of the compartment model without centralized isolation and expanded testing implemented; (F) The prediction results of the ARIMA model without centralized isolation and expanded testing implemented; (G) The prediction results of the ARIMA model without centralized isolation and expanded testing implemented after excluding outliers. Note: Due to the abnormally high number of daily new cases reported on February 1, 2020, the prediction results of the ARIMA model after February 2, 2020 showed a rapid increase. After excluding the outlier, the prediction of daily new cases will decrease.
Abbreviation: ARIMA=autoregressive integrated moving average.
For the compartment model in Stage 1, the parameters from Stage 1 were used to predict the number of new COVID-19 cases during the 10 days starting from January 23, 2020 (i.e., first 10 days in Stage 2) with the assumption that no cordon sanitaire was implemented in China (Figure 1C). For the ARIMA model, after 3 differences in the Stage 1 incidence sequence, the unit root test showed that the sequence had been stationary. The autocorrelation coefficient and partial correlation coefficient of the stationary series are shown in
Supplementary Figure S3C andS3D . The p=0 and q=1–3 of the first-stage onset sequence were preliminarily determined, and the results of the residual white noise test for the 3 preliminarily determined alternative models are shown inSupplementary Table S2 . According to the principle of minimizing BIC, ARIMA (0,3,3) was chosen as the optimal model of the Stage 1 onset sequence. The optimal model was used to compare the prediction of incidence over the same period of time with that of the compartment model (Figure 1D). The prediction of the two models demonstrated that the number of new COVID-19 cases would increase if no cordon sanitaire was taken after January 23, 2020. The number of daily cases predicted by the compartment model showed an exponential increase. The ARIMA model, however, showed a linear increase, which did not reflect the high transmissibility of the severe acute respiratory syndrome coronavirus 2 (SARS-CoV-2) virus. The R2 of the compartment model and the ARIMA model were 0.990 (P<0.001) and 0.981 (P<0.001), respectively.For the compartment model, the parameters of the Stage 1–2 were applied to predict the number of new cases during the 10 days starting from February 2, 2020 (i.e., first 10 days in Stage 3) with the assumption of no centralized isolation and expanded testing being adopted (Figure 1E). After taking the three differences of the Stage 1–2 onset sequence for the ARIMA model, the unit root test showed that the sequence had been stationary. The autocorrelation coefficient and partial correlation coefficient of the stationary series are shown in
Supplementary Figure S3E andS3F . The p=1–3 and q=0 of the onset sequences of Stage 1–2 were preliminarily determined; the residual white noise test results of the 3 initially determined alternative models are shown inSupplementary Table S2 . According to the principle of BIC minimization, ARIMA (2,3,0) was selected as the optimal model of Stage 1–2 onset sequence. This optimal model was used to predict incidence outside the modeling sequence for the same duration, and the result was compared with the compartment model (Figure 1F). Due to the abnormally high number of cases reported in a single day on February 1, the results of the ARIMA model had a large deviation and showed a rapid increase. After excluding this outlier, the results of re-fitting the ARIMA model are shown in Figure 1G. The R2 values of the compartment model and the ARIMA model, without excluding outliers, were 0.969 (P<0.001) and 0.948 (P<0.001), respectively. After excluding outliers, the R2 of the ARIMA model was 0.937. -
Appropriate predictions can help authorities promptly adjust control strategies and allocate medical resources. The compartment model and the ARIMA model are used by numerous researchers in the prediction of COVID-19. Taking the early COVID-19 epidemic in China as an example, the predictions of the compartment model and the ARIMA model at different stages of the epidemic were compared and both models fit well at different stages of the epidemic. Furthermore, the predictions of the compartment model are in line with the highly contagious transmission characteristics of the COVID-19. In addition, since the ARIMA model is a prediction method that considers the changing trends of past values over time and predicts future values by fitting the mathematical model with historical data, the accuracy of recent historical data has a relatively large impact on the results of model extrapolation. Based on the numbers of daily new cases and parameters supported by existing literature, the compartment model can be calibrated using Markov chain Monte Carlo (MCMC) algorithm, allowing its predictions to be relatively less affected by outliers.
Although the ARIMA model does not perform as well as the compartment model in terms of predicting COVID-19, it is important to consider that the novel coronavirus is still in the process of dynamic evolution in the future. With this in mind, the parameters of the compartment model can also change accordingly and are difficult to obtain. Meanwhile, the accurate simulation of model has high requirements for the selection of parameters. Compared with the compartment model, the ARIMA model only needs time series data to build a forecasting model, which is easy to implement and has high accuracy for short-term forecasting. It can be quickly applied to forecasting COVID-19.
The compartment model divides the population into different compartments, with the dynamics of these compartments described by ordinary differential equations. Researchers can incorporate different compartments and parameters into the model to more accurately simulate transmission patterns and epidemiological characteristics of the novel coronavirus. Compared with the ARIMA model, which replaces various influencing factors with time, the compartment model can analyze the impact of population movement, vaccination, isolation measures, and other interventions on disease transmission. Therefore, when predicting COVID-19, it is necessary to comprehensively consider the advantages of different models and choose the best model based on existing conditions.
This study was subject to at least two limitations. First, there were no real-world values to compare with the models’ predictions on the temporal trends of the numbers of daily new cases in specific hypothetical scenarios. Therefore, the accuracy of predictions could not be compared using mean absolute error (MAE) and root mean squared error (RMSE). Second, as a result of dynamic changes in epidemic-related influencing factors — such as prevention and control measures, medical resources, and viral transmissibility, etc. — neither the compartment model nor the ARIMA model could guarantee the accuracy of their long-term predictions. It is necessary to constantly update data to improve their prediction accuracy.
HTML
Data Source
Comparison Between Two Models
Comparison of Model Fitting


Data Analysis
| Citation: |

|