

 Download:


-
Hospital capacity strain arises when the demand for care resources exceeds supply in hospitals. During the coronavirus disease 2019 (COVID-19) pandemic, tremendous efforts have been made in countries and regions to prevent hospital strain, but there is limited empirical evidence that hospital strain indeed increases COVID-19 deaths. Although a few small studies showed that shortage in intensive care was associated with an increased COVID-19 fatality (1-3), strain may occur in many areas (i.e., hospital beds, drugs, devices, and staff) in the entire healthcare system besides intensive care and they may all add up to increase the risk of death from COVID-19. As any new COVID-19 cases add service demand to normal healthcare capacities, the number of COVID-19 patients currently in hospitals (PIH) can be viewed as an approximate measure of the strain on the healthcare system. Therefore, we conducted this analysis of surveillance data and used the number of PIH as a measure of hospital strain to examine its effects on the risk of death from COVID-19 using data from England before March 11, 2022. We found that the risk of death from COVID-19 was linearly associated with the number of PIH before the Omicron period and could be increased due to hospital strain by a maximum of 188.0%. This suggests that any (additional) effort to reduce hospital strain would be beneficial during early large COVID-19 outbreaks and possibly also others alike. During an Omicron outbreak, vigilance remains necessary to prevent excess deaths caused by hospital strain as happened in Hong Kong Special Administrative Region (SAR), China.
This is an analysis of surveillance data on all 147,276 COVID-19 deaths and 601,084 hospitalized COVID-19 patients in England during the period between April 9, 2020 and March 11, 2022 extracted on a daily basis from the UK Health Security Agency (4). The daily number of COVID-19 PIH was used as a measure of hospital strain, and daily case fatality was expressed as the ratio of the daily number of deaths from COVID-19 to the daily number of COVID-19 PIH and used as a measure of the risk of death from COVID-19. The study was divided into four periods, i.e., the wild, Alpha, Delta, and Omicron waves. The hospital strain-fatality relation in the four different periods was presented separately with a scatter plot and compared using log-linear regressions, controlling for potential confounders including proxy indicators for vaccination effect, severity of illness, error in the number of deaths, variant of the virus, improvement in hospital care, and other factors that changed over the study period. All statistical analyses were performed using R (version 4.1.0, R Development Core Team, Vienna, Austria). Details on the methods are provided in
Supplementary Materials . Summary data including the duration of the study period, the total and median daily number of new cases and deaths, median percentage of the population vaccinated with one, two and three doses, and median daily case fatality are presented according to the four periods of the epidemic in Table 1. Notably, the median daily number of new cases increased steadily from 1,425 cases per day in period 1 to 62,303 cases per day in period 4 (mostly Omicron), a 43.7-fold increase. However, the daily number of PIH did not increase proportionally to the daily new cases diagnosed and showed a maximum of only 1.9-fold difference in the 4 periods. The median daily number of deaths was highest during period 1, resulting in a declining daily case fatality during the 4 periods from the highest 3.4% in period 1 to the lowest 1.2% in period 4, a 64.7% decrease (P=0.0137). The decline in fatality could only partially be explained by vaccination, as there were no or only a few people who completed two doses of vaccines during the first two study periods.
Variable Four periods of the epidemic Total (09/04/2020–
11/03/2022)Period 1 (09/04/2020–
11/07/2020)Period 2 (12/07/2020–
30/04/2021)Period 3 (01/05/2021–
26/11/2021)Period 4 (27/11/2021–
11/03/2022)No. of days in the period 94 293 210 105 702 Total No. of new cases, (%) 186,230
(1.1)3,696,656
(22.4)4,855,376
(29.4)7,760,057
(47.0)16,498,319
(100.0)Total No. of deaths, (%) 36,335
(24.7)83,400
(56.6)14,554
(9.9)12,987
(8.8)147,276
(100.0)Total No. of hospital admission, (%) 68,382
(11.4)287,440
(47.8)111,316
(18.5)133,946
(22.3)601,084
(100.0)Median (quartiles) No. of new cases 1,425
(760, 3,125)7,780
(2,224, 18,197)25,598
(13,505, 31,601)62,303
(39,223, 93,784)15,156
(2,752, 31,327)Median (quartiles) No. of deaths 240
(91, 583)124
(28, 413)78 (18, 106) 111
(94, 156)102
(39, 224)Median (quartiles) of the percentage of deaths outside hospitals (%)* 43.4
(41.2, 46.6)29.5
(25.2, 34.2)20.5 (17.9, 24.3) 30.2 (21.8, 32.3) 28.9
(21.7, 35.1)Median (quartiles) No. of hospital admission 562
(300, 1,058)528
(135, 1,467)636 (196, 751) 1,220 (926, 1,604) 696 (218, 1,232) Median (quartiles) No. of patients in hospital 7,360
(3,717, 12,265)5,976
(1,378, 14,411)5,032
(1,274, 6,066)9,369
(7,114, 13,331)5,996
(2,117, 11,585)Median (quartiles) No. of patients in ventilation beds 764
(299, 1,832)682
(178, 1,339)683
(228, 810)608
(355, 770)674
(247, 910)Percentage of population vaccinated (%) Median (quartiles) completed 1st dose 0.0
(0.0, 0.0)0.0
(0.0, 27.7)82.0
(75.3, 85.0)90.6
(89.7, 91.3)52.0
(0.0, 84.2)Median (quartiles) completed 2nd dose 0.0
(0.0, 0.0)0.0
(0.0, 1.0)69.8
(55.4, 78.0)83.3
(82.0, 84.6)4.8
(0.0, 76.8)Median (quartiles) completed 3rd dose 0.0
(0.0, 0.0)0.0
(0.0, 0.0)0.0
(0.0, 3.2)63.3
(56.1, 65.2)0.0
(0.0, 0.0)Median (quartiles) daily case fatality (%) 3.4
(2.6, 4.9)2.7
(2.1, 3.0)1.6
(1.4, 1.8)1.2
(1.0, 1.4)1.9
(1.5, 2.8)* Data were available on a weekly basis. Table 1. The total number of new cases and death events, average of daily new cases, death events, cases in hospitals, percentage of first, second, and third dose of vaccination, and daily case fatality during the 4 periods of the coronavirus disease 2019 epidemic in England between April 9, 2020, and March 11, 2022.
The 7-day moving average of daily number of new cases, PIH, and deaths, daily case fatality during the 4 periods of the epidemic in relation to the progress of vaccination and changes in lockdowns, public health measures, and variants of the virus were shown graphically in
Supplementary Figure S1 . Patterns similar to those observations described above can be visually observed regarding daily new cases, PIH, deaths, and fatality.Importantly, the association between the daily case fatality and number of PIH, a measure of hospital strain in this study, according to the 4 periods of the epidemic is shown in Figure 1. In periods 1, 2, and 3, the fatality was positively and linearly associated with the number of PIH with a correlation coefficient of 0.95, 0.55, and 0.58, respectively (all P values <0.0001). In period 4, the fatality was sharply divided into two parts. The first part was mostly Delta and the second was predominantly Omicron, in which the fatality was the lowest and remained stable regardless of the variations in the number of PIH. The same conclusions can be drawn when patients currently in ventilation beds were used as a measure of hospital strain (
Supplementary Figure S2 ). After adjusting for vaccination score, admission rate, percentage of deaths outside hospitals, study period, and interaction term between PIH and study period, hospital strain remained statistically significantly associated with daily case fatality in the first 3 periods (all P values <0.0001 in study periods 1, 2, and 3, respectively) (Table 2 ,Supplementary Table S1 ).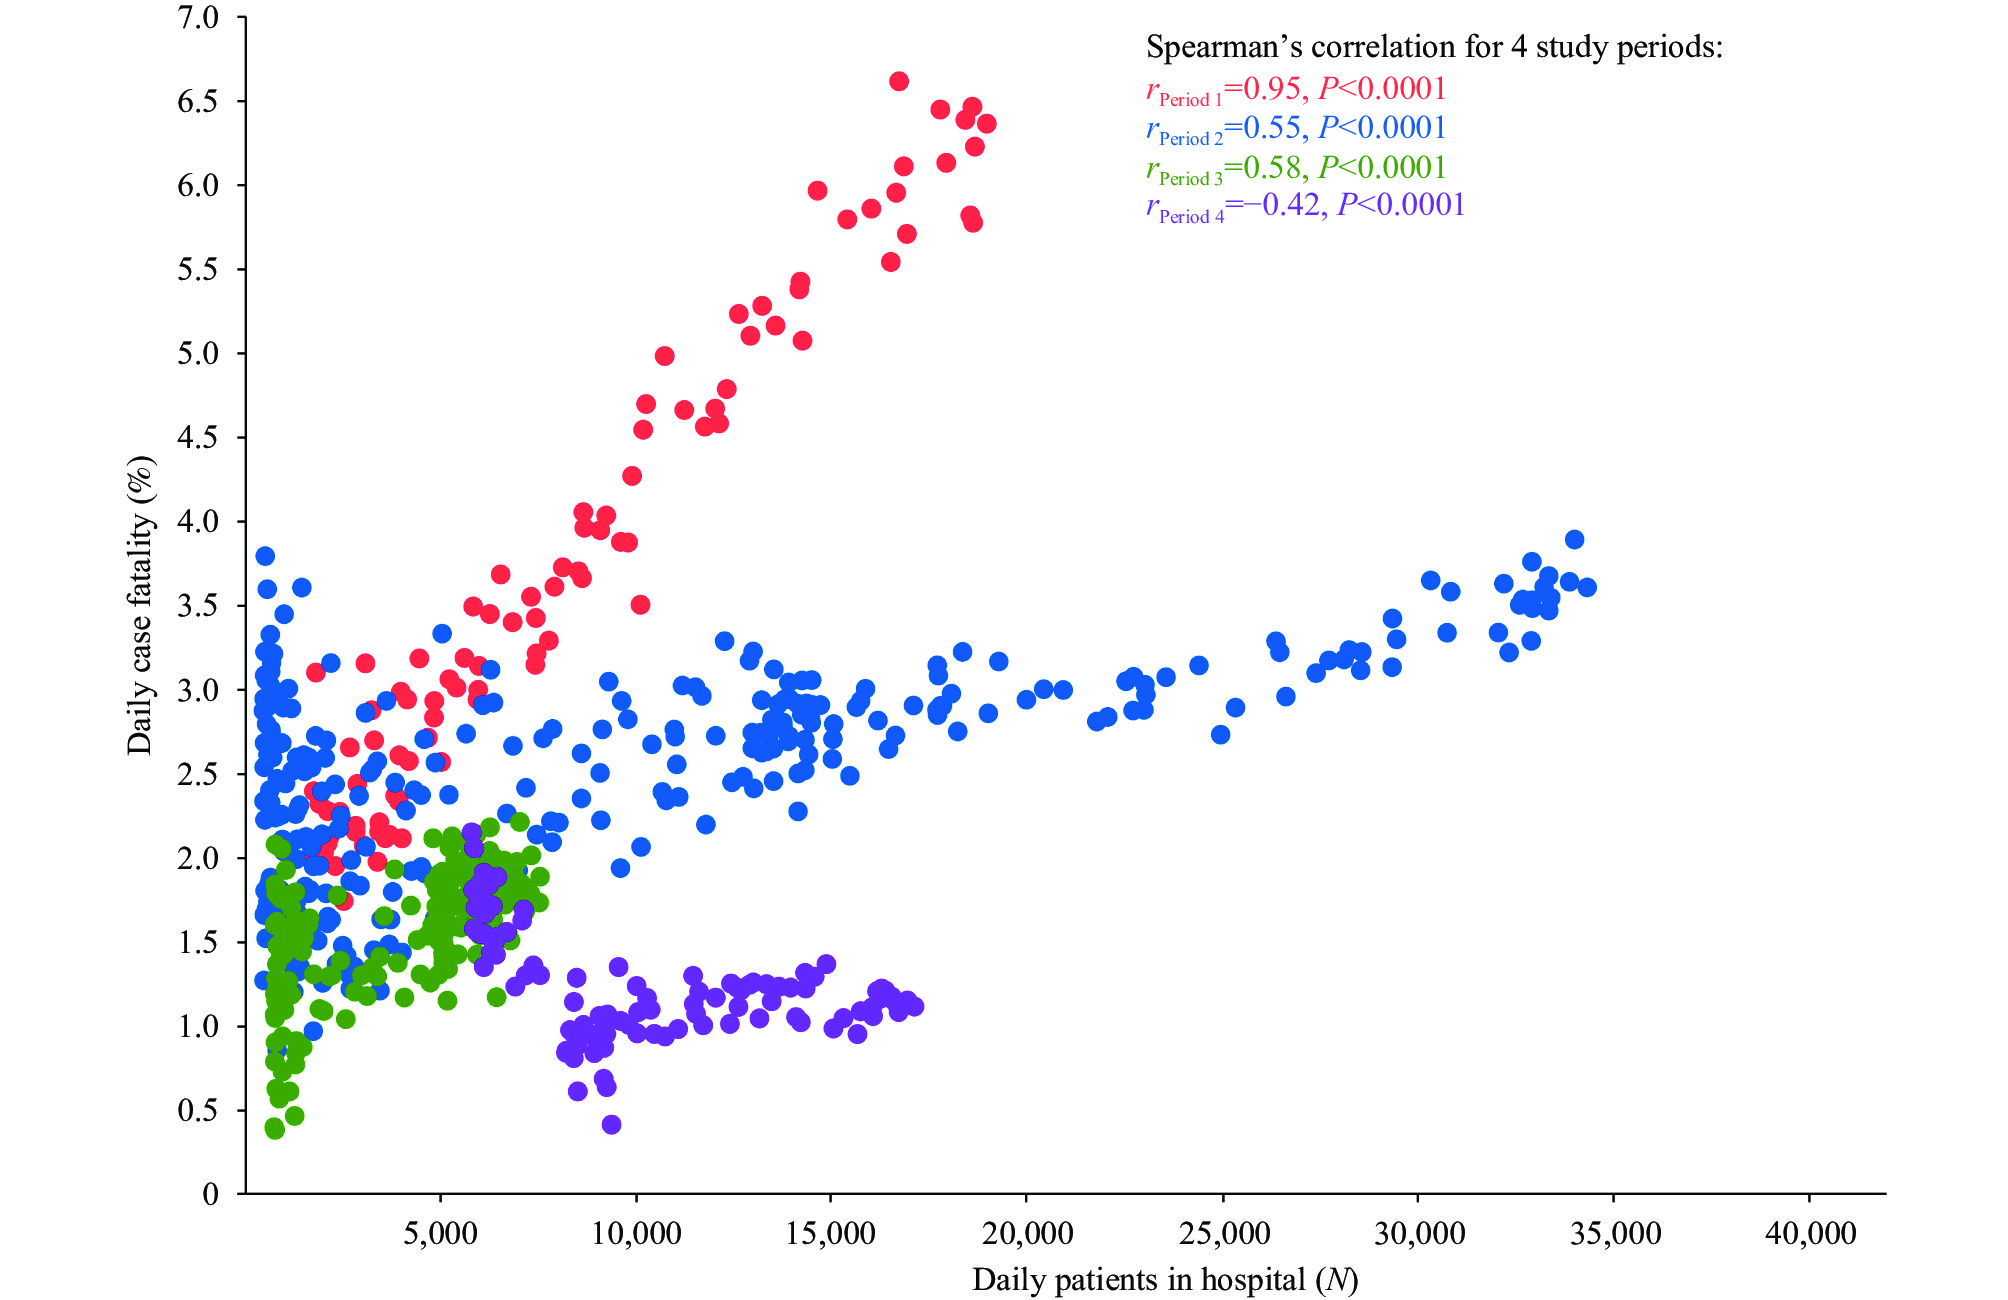 Figure 1.
Scatter plot and Spearman’s correlation between daily case fatality and daily number of patients in hospitals according to the 4 periods of epidemic in England between April 9, 2020, and March 11, 2022.
Finally, as the daily number of PIH increased from the lowest to the highest, the actual (or unadjusted) daily case fatality increased by 188.0% [95% confidence interval (CI): 165.9%, 211.6%], 69.9% (95% CI: 59.0%, 81.8%), and 58.2% (95% CI: 35.4%, 89.0%), respectively, in study periods 1, 2, and 3 (
Supplementary Table S2 ).Results of additional analyses, including sensitivity analyses, are presented in the
Supplementary Figures S3 –S4 , and related methods were described inSupplementary Materials . -
By using authoritative English national data over 2 years of the epidemic, we found that the daily number of COVID-19 PIH as an indicator of overall hospital strain caused by the epidemic was linearly associated with the risk of death from COVID-19, except in the Omicron period, which confirmed findings from several previous studies (1-3). The largest difference in the risk of death from COVID-19 observed during an outbreak in England was 2.88-fold, suggesting that a maximum of 65.3% death risk reduction could be achieved theoretically by reducing COVID-19 PIH. However, the linear relation suggests that any (additional) effort to reduce COVID-19 PIH is related to a reduction in the risk of death and is worthwhile regardless of the total number of hospital beds available and their occupancy percentage. Our findings provide strong evidence to support efforts to ease hospital strain in order to reduce deaths during early COVID-19 outbreaks and have important implications for future infectious disease outbreaks similar to early COVID-19 variants and possibly for current Omicron outbreaks as well.
The number of COVID-19 PIH is a composite indicator for overall hospital strain, which can be caused by many complex and interrelated factors within and outside hospitals. Hospital factors include staff, facilities, equipment, drugs, ventilation beds, and preparedness. Non-pharmacological interventions (NPIs) and vaccination are major efforts that can be mobilized outside hospitals to suppress outbreak peaks and reduce hospital strain (5). In addition, factors such as the variant of the virus and patients’ care-seeking behaviors also affect hospital strain. For example, a shortage in intensive care resources was shown to be associated with an increased risk of death from COVID-19 in the early stage of the pandemic in various countries (2-3). Our analyses with a much larger dataset also showed that the number of ventilation beds occupied by COVID-19 patients had a similar effect on fatality. However, studies on these individual determinants of hospital strain may underrate the effect of overall hospital strain on COVID-19 fatality because these studies are restricted to a small fraction of all patients who may die (2-3).
Furthermore, these factors may work together to cause difficulties for patients with severe COVID-19 and those with other diseases to be admitted to hospitals, infections in hospital staff, and inpatient cross-infections, which in turn may further increase COVID-19 fatality (6-7). Importantly, most of these factors and their interactions in each place or setting would change dynamically over time. Thus, different profiles of hospital strain determinants in a place during different periods of the epidemic may explain the different patterns of the hospital strain-fatality relation found in our study. For example, hospitals were least prepared at the beginning of the pandemic and as a result, the highest fatality was observed during period 1 in our study. As hospitals gained more experience and became more prepared, the hospital strain-fatality relation gradually became less evident. During the last period of our study, the Omicron variant caused the least severe infections, the majority of people had been vaccinated, almost all patients in the UK hospitals had been routinely tested for antigens, and hospitals, care management, and NPIs had become most prepared and efficient (8). Consequently, the number of PIH during this period was maintained at a relatively low level, and below it, hospital strain was not shown to be related to fatality.
Besides NPIs, including vaccination, measures can also be taken regarding or within hospitals to reduce hospital strain. For example, in the UK measures including the construction of temporary facilities (e.g. the Nightingale hospitals), the cancellation of elective admissions of patients with other diseases, and stricter triage of admissions and management of mild or moderate COVID-19 cases in communities have been implemented to ease hospital strain (9). Our study also showed how the relationship between hospital strain and case fatality varied with different viral variants, providing further implications for policymaking.
Having said all that, we would like to emphasize, importantly, that England’s experiences with Omicron may not apply to Omicron outbreaks in all other places. If NPIs were not mobilized quickly and sufficiently, outbreaks of Omicron variants could still raise the number of patients in hospitals to a level that is high enough to cause hospital strain and increase the risk of death from COVID-19, as happened in early 2022 in Hong Kong SAR, which experienced one of the highest fatality rates from Omicron outbreaks in the world (10).
The study has some limitations. First, it is possible that more severe patients were admitted when the numbers of PIH were larger. Therefore, the hospital strain-fatality relation may be a result of severity of patients admitted. Second, we used the daily numbers of PIH as the denominator of the daily case fatality, which may not be completely comparable in their severity as they may have different amalgamations of patients at different stages of disease. Third, the numerator of the daily case fatality included death events that occurred outside of hospitals, which may lead to an overestimation of the fatality at the peaks of outbreaks when a larger proportion of patients could not be admitted to hospitals and some of them died. Finally, the variant of the virus, the number of ventilation beds available and vaccination rate could all change over time and caused confounding bias in the relation between the number of PIH and fatality. However, we did sensitivity analyses and believed these limitations were unlikely to change the conclusions of this study (
Supplementary Materials ).In conclusion, hospital strain is linearly associated with the risk of death from COVID-19 during early COVID-19 outbreaks, suggesting that any (additional) efforts to ease hospital strain would be beneficial in early COVID-19 outbreaks and possibly others alike. NPIs, vaccination, and hospital preparedness should be used in concert to reduce hospital strain and ultimately minimize deaths.
-
No conflicts of interest.
Study period Regression coefficients (95% CI)* Relative increase (95% CI)* P-value Period 1 0.062 (0.057, 0.066) 1.063 (1.059, 1.068) <0.0001 Period 2 0.014 (0.013, 0.015) 1.014 (1.013, 1.015) <0.0001 Period 3 0.120 (0.102, 0.137) 1.127 (1.108, 1.147) <0.0001 Period 4 −0.005 (−0.014, 0.003) 0.995 (0.986, 1.003) 0.2306 Abbreviation: CI=confidence interval.
* Log-linear multivariable regression was used to estimate the regression coefficients (i.e., the effect of daily number of patients in hospital on daily case fatality) and relative increase (exponential of the regression coefficient) for each period. The regression coefficients and relative increases were adjusted for vaccination score, study period, interaction term between daily number of patients in hospital and study period, admission rate, and percentage of deaths outside hospitals, and weighted by the number of patients in hospital (detailed results in Supplementary Table S1, available in https://weekly.chinacdc.cn/).Table 2. Relative increase in daily case fatality for a 1,000-increase in daily number of patients in hospitals according to study period and adjusted for potential confounders.
HTML
| Citation: |

|