
 Download:


-
Mask-wearing is a non-pharmaceutical intervention that can successfully prevent the transmission of many respiratory illnesses, including coronavirus disease 2019 (COVID-19) (1). Throughout the COVID-19 pandemic, communities with higher proportions of self-reported mask-wearing showed better control of COVID-19 transmission (2) and an overall decline in COVID-19 case counts (3). While many ecological studies were able to support these results, they could not assess individual-level risk across all measures (3–6). For example, some studies have been able to collect individual self-reports of mask-wearing but can only examine their impact based on the community level COVID-19 rates that are available for use (3,6). One study was able to demonstrate an individual protective effect of mask-wearing on individual risk of COVID-19-like illness (CLI) but still used aggregated community levels for covariates such as social distancing in their analysis (7). Here, we collected both outcome and exposure at the individual level and used a Cox proportional hazards model to assess the effectiveness of mask-wearing on CLI incidence. Longitudinal weekly self-reports of respiratory symptoms were used to assess onset of CLI from January to June 2020 in a United States (U.S.) nationwide sample (n=4,723) of participants enrolled in FluNearYou (FNY), a web-based syndromic participatory surveillance platform, prior to the first case of COVID-19 in the U.S. Individual-level information on mask-wearing exposure and confounding variables was retrospectively gathered from an annual survey administered to FNY participants in June 2020. Overall, there were 1,310 reports of respiratory symptoms that met our primary illness definition over the study period and individuals characterized as most likely to wear masks were 44% (20%–61%) less likely to report CLI symptoms compared to individuals characterized as least likely to wear masks. Participatory surveillance systems, like FluNearYou, can provide valuable insights into the impact that personal protective measures have on individual risk of illness.
FNY is a participatory, syndromic surveillance tool that longitudinally tracks seasonal and pandemic influenza (8-9). To participate, FNY users submit weekly anonymous reports of any influenza-like symptoms they are experiencing through the online platform. Influenza data collected from the FNY population have historically complemented the trends observed in traditional surveillance systems, like U.S. CDC ILINET (8,10). At the end of each influenza season, a survey is administered to FNY participants to assess detailed health-related behaviors and attitudes not queried in the weekly reports. Questions in the 2020 questionnaire evaluated mask-wearing, social distancing adoption, and other COVID-19 related attitudes and behaviors. Importantly, the 2020 survey assessed a time period before many U.S. states implemented official mask mandates and vaccines against severe acute respiratory syndrome coronavirus 2 (SARS-CoV-2) were not yet available (4).
The 2020 annual survey was fielded from June 18 through July 17, 2020 and received 8,018 responses from FNY users (56.2% response rate among those who answered the survey), of which there were 5,932 unique responses that could be matched to FNY weekly contributors. Longitudinal reports of respiratory illness symptoms from January 19 to June 30, 2020 were assessed in this sample of FNY participants who were enrolled in the program prior to the first confirmed case of COVID-19 reported in the U.S. on January 20, 2020 (11). Respondents who were reporting from outside the U.S., who reported symptoms meeting our primary illness definition in their initial survey, or who submitted fewer than 2 reports during the study period were not included in the analysis. Following the application of exclusion criteria, the resulting study cohort consisted of 4,809 unique users who submitted 87,231 weekly reports to FNY over the course of the study period. A total of 4,793 members of this cohort submitted surveys that contained answers to both of the questions used in the development of the mask-wearing likelihood variable (n=16, excluded). This study was approved by the Boston Children’s Hospital Institutional Review Board and received a waiver of informed consent (IRB-P00023700).
We used a previously validated exposure variable to measure mask-wearing (2). In the annual survey, self-reported mask-wearing likelihood within the next week was ranked for two different settings: while grocery shopping and while visiting family and friends. For analysis, mask-wearing likelihood was categorized as “Very Likely” (very likely to wear a mask in both settings), “Somewhat Likely” (somewhat likely in one setting + very likely in the other), “Mixed Likelihood” (somewhat/very likely in one setting + not so likely/not at all likely in the other), or “Not Likely” (not so likely/not at all likely in both settings).
The primary outcome in our study was presence of CLI, defined as a self-report of shortness of breath, cough, or two or more of the following symptoms: fever, chills, sore throat, body ache, or headache (12). Sensitivity analyses were conducted that utilized broad and narrow definitions of respiratory illness.
Follow-up time began at the date of each participant’s initial survey on or after January 19, 2020 and ended with either the final survey entry on or before June 30, 2020 or the first instance of reported symptoms meeting the respiratory illness definition. To assess the crude effect of mask-wearing on individual risk of CLI we estimated Kaplan-Meier survival curves for the four categories of mask-wearing. To adjust for factors confounding the effect of mask-wearing on individual risk of respiratory illness, we fit a Cox proportional hazards model. We controlled for the following confounding variables: age, gender, number of social distancing contacts (0–1, 1–4, 4–10, 10 or greater), date of social distancing adoption (Prior to March 1, March 1–14, March 15–31, April 1 or later), leaving home for work (binary), county population density (<500 people per square mile, ≥500 people per square mile), and time-varying county COVID-19 burden (population-adjusted incidence 1 week before survey entry). We modeled county COVID-19 burden as time-varying based on the location of each FNY weekly submission. For the regression analysis, participants who failed to provide a valid response for all model variables were excluded. Influential points, with deviance residuals greater than 3 and less than −3, were also excluded. All analyses were performed and figures were created using R software (version 4.0.2; R Core Team, Vienna, Austria).
Equation A: Cox model equation with time-varying COVID-19 burden variable
$$ \begin{aligned} & h\left(t\right)={\lambda }_{0}\left(t\right)\times {exp(\beta }_{1}gender+{\beta }_{2}age+{\beta }_{3}masking\;likelihood\\ &+{\beta }_{4}number\;of\;contacts+ {\beta }_{5}social\;distancing\;adoption\;date\\ &+ {\beta }_{6}left\;home\;for\;work+{\beta }_{7}county\;population\;density\\ &+{\beta }_{8}county\;COVID\;burden\left(t\right)) \end{aligned} $$ The FNY population demonstrated high adherence to public health guidelines from January to June 2020, with the majority (52.2%) of individuals reporting they would be very likely to wear a mask both while grocery shopping and while visiting family and friends, and only 112 (2.3%) individuals reporting they would be not likely to wear masks in both scenarios. Self-reported mask-wearing was higher among women (69.7%) compared to men (30.3%). Those with 0–1 social distancing contacts were more likely to report wearing masks (62.1%) than those with more than 10 contacts (2.3%), and those who adopted social distancing in early to mid-March were more likely to report wearing masks (43.2%) compared to those who adopted social distancing in April or later (4.1%). Individuals who went grocery shopping in the week prior to the questionnaire were more likely to report mask-wearing (67.1%) compared to those who did not go grocery shopping (32.9%). However, self-reported mask-wearing was lower among those who left home for work (15.7%) or to visit friends and family (15.8%). Individuals most likely to wear masks were more likely to live in counties with a population density greater than 500 people per square mile (76.5%) compared to counties with a population density of less than 500 people per square mile (22.5%). (Table 1)
Variable Mask-wearing likelihood Least likely (n=112) Mixed likelihood (n=1,052) Somewhat likely (n=1,047) Most likely (n=2,512) Gender, n (%) Female 64 (57.1) 662 (62.9) 731 (69.8) 1,750 (69.7) Male 48 (42.9) 390 (37.1) 316 (30.2) 762 (30.3) Age (years), n (%) 13–48 13 (11.6) 134 (12.7) 131 (12.5) 314 (11.6) 49–64 41 (36.6) 360 (34.2) 346 (33.0) 824 (31.4) ≥65 57 (50.9) 530 (50.4) 539 (51.5) 1,289 (52.3) Missing 1 (0.9) 28 (2.7) 31 (3.0) 85 (4.7) Race, n (%) AIAN 3 (2.7) 11 (1.0) 11 (1.1) 36 (1.4) Asian 0 (0.0) 10 (1.0) 22 (2.1) 63 (2.5) Black 1 (0.9) 7 (0.7) 10 (1.0) 37 (1.5) White 103 (92.0) 995 (94.6) 973 (92.9) 2,303 (91.7) Other 5 (4.5) 29 (2.8) 31 (3.0) 73 (2.9) Social distancing contacts*, n (%)
0–1
1–4
4–10
≥10
Missing
39 (34.8)
31 (27.7)
18 (16.1)
17 (15.2)
7 (6.2)
482 (45.8)
409 (38.9)
101 (9.6)
44 (4.2)
16 (1.5)
544 (52.0)
358 (34.2)
94 (9.0)
27 (2.6)
24 (2.3)
1,559 (62.1)
725 (28.9)
129 (5.1)
58 (2.3)
41 (1.6)Social distancing adoption date, n (%)
Prior to March 1
March 1 to March 14
March 15 to March 31
April 1 or later
Missing
6 (5.4)
24 (21.4)
47 (42.0)
20 (17.9)
15 (13.4)
58 (5.5)
344 (32.7)
529 (50.3)
65 (6.2)
56 (5.3)
53 (5.1)
393 (37.5)
479 (45.7)
57 (5.4)
65 (6.2)
212 (8.4)
1,086 (43.2)
953 (37.9)
103 (4.1)
158 (6.3)Left for work, n (%) 40 (35.7) 255 (24.2) 207 (19.8) 395 (15.7) Left for grocery shopping, n (%) 98 (87.5) 846 (80.4) 786 (75.1) 1,686 (67.1) Left to visit family and friends, n (%) 63 (56.2) 597 (56.7) 378 (36.1) 397 (15.8) County population density <500 people per square mile, n (%) Yes 41 (36.6) 329 (31.3) 262 (25.0) 566 (22.5) No 70 (62.5) 714 (67.9) 776 (74.1) 1,921 (76.5) Missing 1 (0.9) 9 (0.9) 9 (0.9) 25 (1.0) Abbreviation: AIAN=American Indian and Alaska Native.
* Respondents were asked how many people, including family members, coworkers etc. they saw in close contact for at least 15 minutes while practicing their strictest social distancing.Table 1. User demographics for the longitudinal participatory surveillance platform FluNearYou (FNY), by likelihood of mask-wearing (n=4,723).
After excluding participants without valid responses for all covariates, 4,098 individuals remained in the cohort, with each individual contributing a median of 154 person-days of follow-up time [interquartile range (IQR)=69.25–161]. During the study period, 1,036 (25.3%) individuals reported symptoms meeting our definition of CLI.
Figure 1 demonstrates the unadjusted Kaplan-Meier plot for respiratory illness survival across the four categories of mask-wearing behavior. Individuals who were most likely to wear masks showed less risk of developing respiratory symptoms over the study period compared to those least likely to wear masks (P-value <0.001). At the end of the study period, 73.6% of individuals categorized as most likely to wear masks had not developed respiratory illness symptoms compared to only 61.4% of individuals categorized as least likely to wear masks. The difference in rates of symptom onset between categories of mask-wearing behavior increased over the study period.
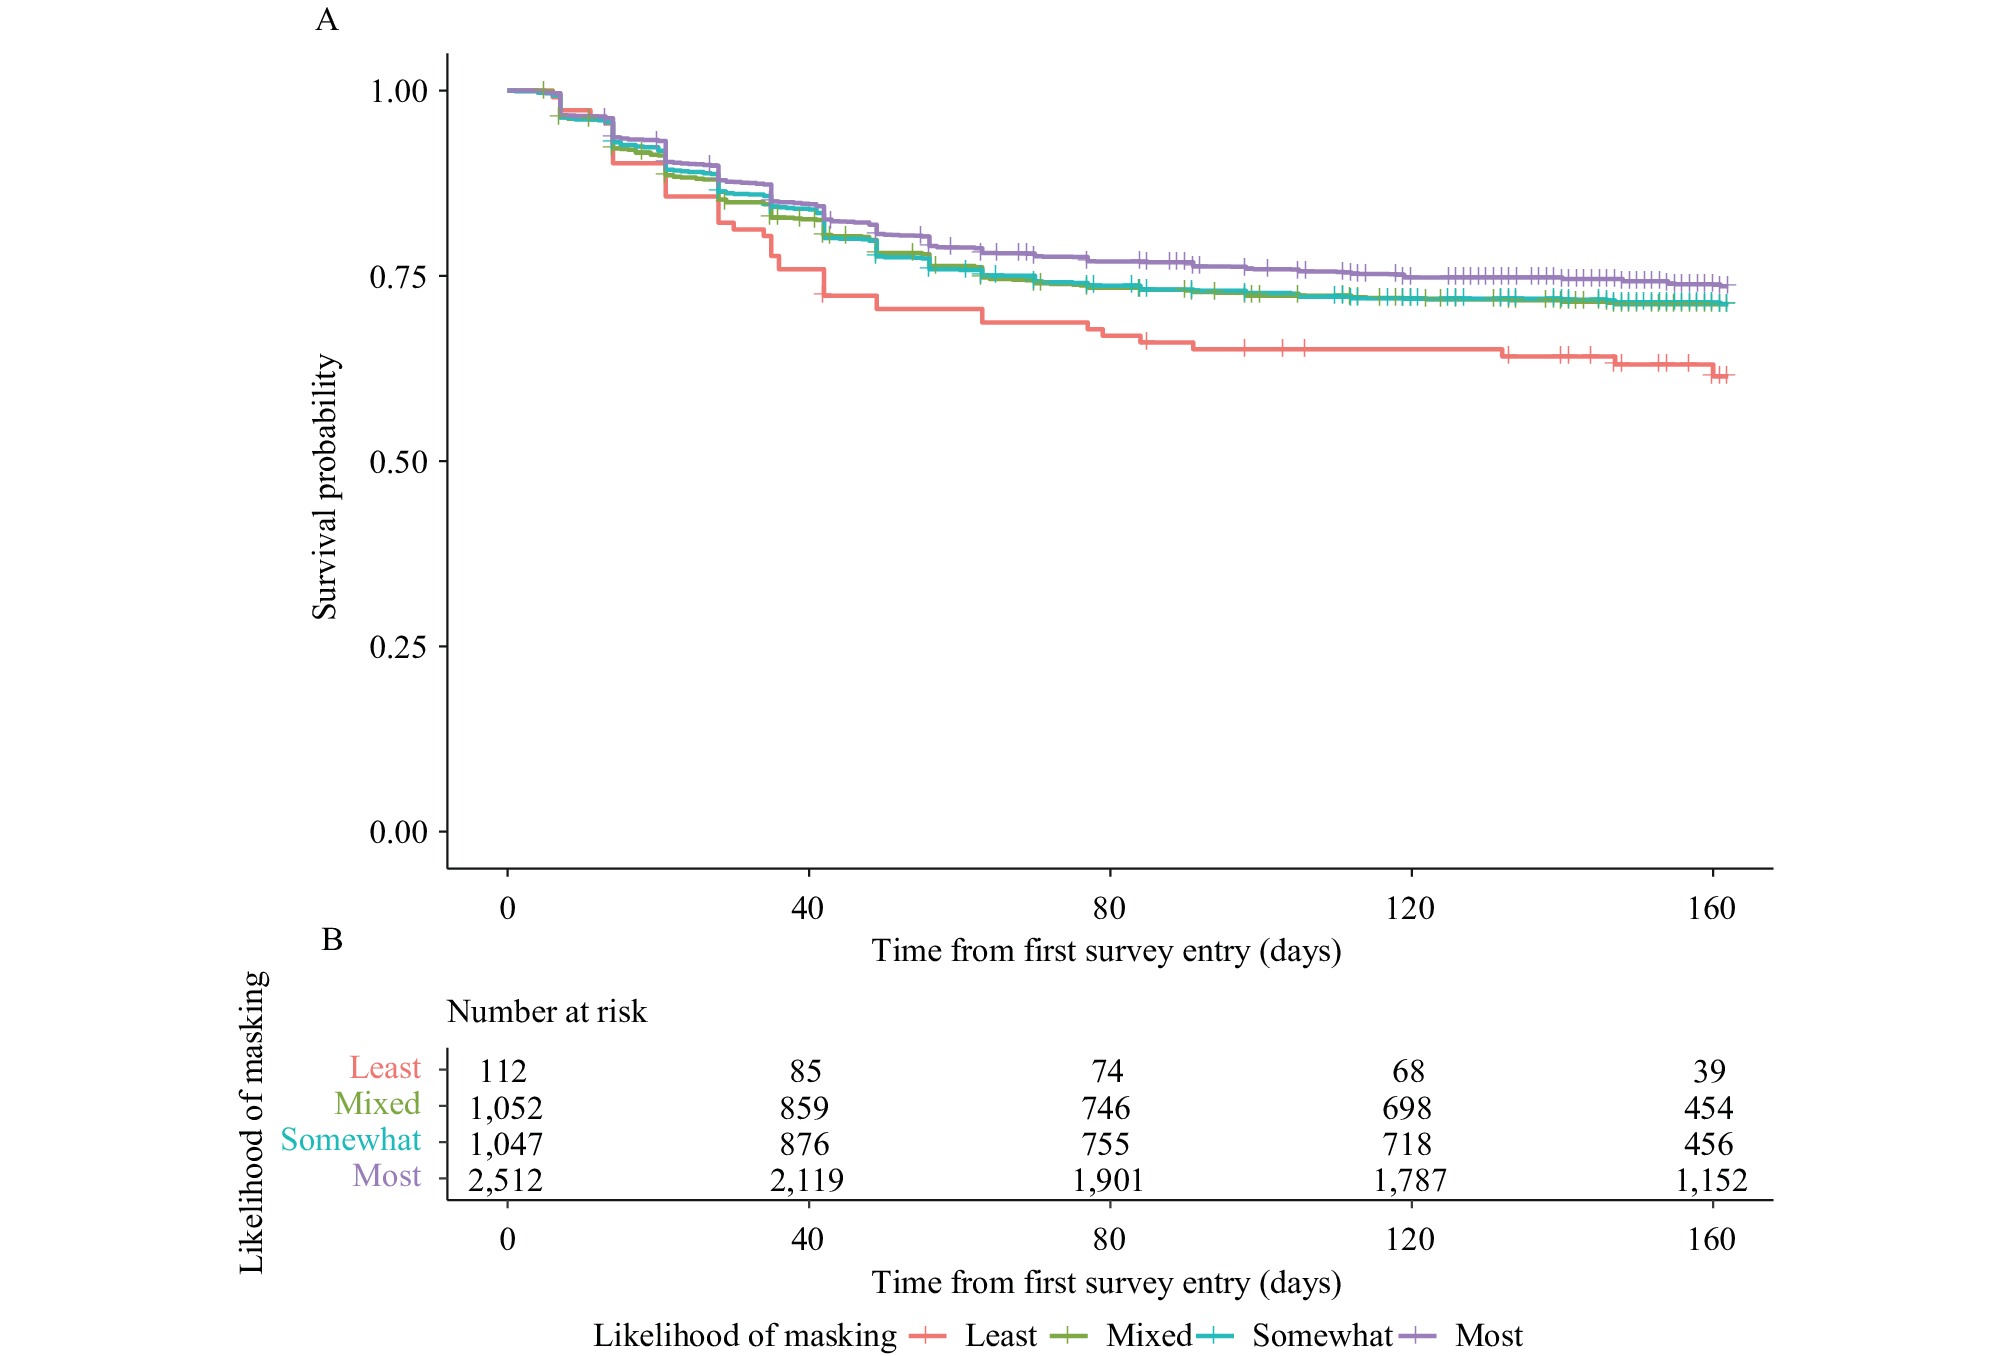 Figure 1.
Unadjusted Kaplan-Meier Curve for mask-wearing with risk table. (A) Kaplan-Meier curves for respiratory illness symptoms; (B) Number at risk.
Note: Survival curves for users of the participatory surveillance platform FluNearYou (n=4,723) reported varying likelihoods of mask-wearing while grocery shopping and while visiting family and friends. Individuals reporting a higher likelihood of mask-wearing demonstrated a lower risk of respiratory illness symptoms across the study period compared to individuals reporting a lower likelihood of mask-wearing. The difference in rates of symptom onset between strata of mask-wearing likelihood increases over the study period.The Cox model demonstrated a protective effect of mask-wearing (Figure 2). Table 2 provides the full Cox model for the primary analysis (Logrank test=96.56 on 14 df, P<0.0001). Individuals most likely to report mask-wearing were 44% (20%–61%) less likely to report respiratory symptoms over the study period compared to individuals least likely to report mask-wearing [hazard ratio (HR): 0.56, 95% confidence interval (CI)
: 0.39, 0.80, P=0.002]. Risk of CLI was also lower in the somewhat likely group (HR: 0.61, 95% CI: 0.42, 0.89, P=0.010) and in the mixed likelihood group (HR: 0.62, 95% CI: 0.43, 0.90, P=0.011) compared to the least likely group. Our sensitivity analyses using varying definitions of CLI found a similar magnitude and direction for the effect of mask-wearing on risk of CLI.  Figure 2.
Cox-adjusted survival curves across levels of mask-wearing variable.
Note: Survival curves for respiratory illness over study period for users of the participatory surveillance platform FluNearYou (n=4,098) reporting varying likelihoods of mask-wearing while grocery shopping and while visiting family and friends. Results show a protective effect of mask-wearing on risk of developing respiratory illness over time, after adjusting for gender, age, number of social distancing contacts, date of social distancing, leaving home for work, home county population density, and estimated county COVID-19 burden. Individuals reporting a higher likelihood of mask-wearing demonstrated a lower risk of experiencing respiratory illness symptoms over the study period compared to individuals reporting a lower likelihood of mask-wearing. The difference in survival probability between strata of mask-wearing increases over time.Variable Model 1 (mask only),
HR (95% CI)Model 2 (full model),
HR (95% CI)Gender
Female
Male
REF
0.85 (0.74, 0.97)Age (years)
<64
65–
REF
0.93 (0.82, 1.05)Mask-wearing likelihood
Least likely
Mixed likelihood
Somewhat likely
Most likely
REF
0.72 (0.52, 1.00)
0.73 (0.52, 1.00)
0.65 (0.47, 0.89)
REF
0.62 (0.43, 0.90)
0.61 (0.42, 0.89)
0.56 (0.39, 0.80)Social distancing contacts
0–1
1–4
4–10
10 or greater
REF
1.50 (1.31, 1.71)
1.58 (1.26, 1.98)
1.00 (0.67, 1.51)Social distancing adoption date
Prior to March 1
March 1 to March 14
March 15 to March 31
April 1 or later
REF
1.03 (0.81, 1.30)
0.83 (0.65, 1.06)
0.57 (0.39, 0.83)Left for work
Did not go into work
Went into work
REF
1.24 (1.07, 1.44)County COVID-19 burden 0.98 (0.97, 0.99) County population density <500 people per square mile
Yes
No
REF
0.95 (0.83, 1.10)Abbreviation: HR=hazard ratio; CI=confidence interval; REF=reference group; COVID-19=coronavirus disease 2019. Table 2. Model output for Cox proportional hazards regression for masks only and for mask-wearing and all covariates (n=4,098).
-
This longitudinal study of COVID-19 during the initial wave in the U.S. found that individuals who reported the greatest likelihood of mask-wearing outside of the household had a 44% reduced risk of respiratory illness compared to those least likely to wear masks during the same period. The protective effect of mask-wearing was robust after adjusting for age, gender, number of distancing contacts, date of distancing adoption, leaving home for work, home county population density, and COVID-19 burden as well as under varying definitions of respiratory illness.
The individual protective effect of mask-wearing supports ecological and randomized study findings that mask use reduces community COVID-19 cases (2–3,6). Previous studies have suggested that individuals who are more likely to wear masks may also be more likely to live in communities with high mask adherence due to the general influence of social norms on individual behavior (6). The individual protective effect we observed may reflect reduced transmission resulting from community mask-wearing behavior as well as individual mask-wearing, or other precautions taken by individuals, such as improved hand hygiene.
There are several other limitations to consider when interpreting the results of this study. The FNY population is a predominantly white, largely health-conscious group, and overrepresents retired individuals, meaning our results may not generalize to the entire U.S. population. Furthermore, our assessment of the effectiveness of mask-wearing is limited, as we do not have specific data for when individuals began to use masks or what type of masks they were using. We addressed this issue by adjusting for the date of initial self-reported social distancing. Several U.S. mask mandates were implemented much later than March 2020 (4), which is when the majority of our study population began social distancing, potentially leading to an underestimation of the true effect. It is also possible that people who experienced CLI in the follow-up period would have been less likely to report mask-wearing in June 2020 due to assumed protection through acquired immunity, causing an overestimation of the true effect.
Retrospective self-reporting of the exposure and outcome may increase the likelihood of recall bias, misclassification, and a biased effect estimate. Additionally, the use of syndromic surveillance omits asymptomatic COVID-19 infection, while inadvertently assessing infection with rhinoviruses, influenza, or other respiratory illnesses circulating in the population (13). The robustness of our results to both narrow and broad definitions of CLI illustrates that mask-wearing appears effective against a wide range of respiratory illnesses that were circulating in 2020, including COVID-19.
Our analysis of mask-wearing behavior in a previously enrolled symptom surveillance cohort demonstrates an association between self-reported mask-wearing behavior and a lower risk of respiratory illness at the beginning of the COVID-19 pandemic in the U.S. Our results support previous findings on the effectiveness of face masks and are especially salient given our ability to control for individual-level covariates. This study provides additional evidence in support of recommendations for mask-wearing to prevent respiratory illness. Participatory syndromic surveillance cohorts like FNY provide a valuable resource for understanding the impact of personal protective measures on COVID-19.
-
No conflicts of interest.
HTML

| Citation: |

|