

 Download:


-
Salmonella is an important intestinal pathogen of foodborne disease, causing enteritis and bloodstream infections, among other serious consequences, transmitted by food and water. Plasmid genome sizes in Salmonella enterica are generally between 2 kb and 200 kb and are biased based on serotype (1). As an important mobile genetic element (MGE), plasmids in Salmonella endow strains with many biological characteristics, including toxin production, resistance to heavy metals, antibiotic resistance genes (ARGs), and prophage integration (2-4). The spread of plasmid-borne ARGs has become a global public health problem, and plasmids, as reservoirs of ARGs, can spread rapidly between different species, including human pathogens (5-6). Therefore, it is necessary to monitor the ARGs carried by plasmids for the evaluation of ARG transmission.
Salmonella genome analyses based on next-generation sequence techniques have become an important tool for infectious disease surveillance, prevention and control, and food safety management. Currently, it is challenging to distinguish the full genomes of the chromosomes versus the plasmids without using long-read sequencing. It is very important to obtain the complete genomes of these MGEs for understanding plasmid origins and contributions to strain adaptability. To solve this problem, several plasmid sequence prediction methods have been developed, including Kraken (7), cBar (8), PlasFlow (9), RFPlasmid (10), mlplasmids (11) and PlasmidFinder (12). The Kraken classifier is an ultra-fast and highly accurate species classification program for sequences, and the Kraken classifier-based method has the highest accuracy and balanced performance in terms of overall sensitivity and specificity among the compared methods in the prediction of plasmid sequences in Klebsiella pneumoniae (13).
In our study, three customized Kraken databases were constructed using three different plasmid datasets and a Salmonella chromosomal dataset. These formed three different Kraken classifiers. A five-fold cross-validation method was used to evaluate the performance of the three Kraken classifiers using two different benchmark datasets. Finally, the optimal Kraken classifier was used to predict the plasmid sequence contigs from the genomes of Salmonella strains isolated in China, and plasmid-carrying prevalence and plasmid-borne ARGs were estimated.
-
Three customized Kraken databases were constructed (Figure 1A); each dataset included a plasmid dataset and a chromosome dataset. The plasmid datasets were the National Center for Biotechnology Information (NCBI) plasmid dataset, an Enterobacteriaceae bacterial plasmid dataset, and a Salmonella plasmid dataset, which contained 46,033, 19,853, and 1,591 plasmid sequences, respectively. The chromosome dataset comprised 2,001 Salmonella complete genomes. Therefore, our customized Kraken database A was composed of 2,001 Salmonella complete genomes and 1,591 Salmonella plasmids. Our customized Kraken database B was composed of 2,001 Salmonella complete genomes and 19,853 Enterobacteriaceae bacterial plasmids. And our customized Kraken database C was composed of 2,001 Salmonella complete genomes and all 46,033 NCBI bacterial plasmids. The download address of the NCBI plasmid dataset is
https://ftp.ncbi.nlm.nih.gov/genomes/refseq/plasmid . The Salmonella complete genomes were downloaded from NCBI ftp (https://ftp.ncbi.nlm.nih.gov/genomes/genbank/ ). The Enterobacteriaceae bacterial plasmid dataset was constructed by extracting all sequences belonging to the Enterobacteriaceae from the NCBI plasmid dataset. Likewise, the Salmonella plasmid dataset was extracted in a similar manner. Kraken version 1.0 (7) was used to build our Kraken classifier. Operation of the Kraken classifier followed the Kraken manual (http://ccb.jhu.edu/software/kraken/ ).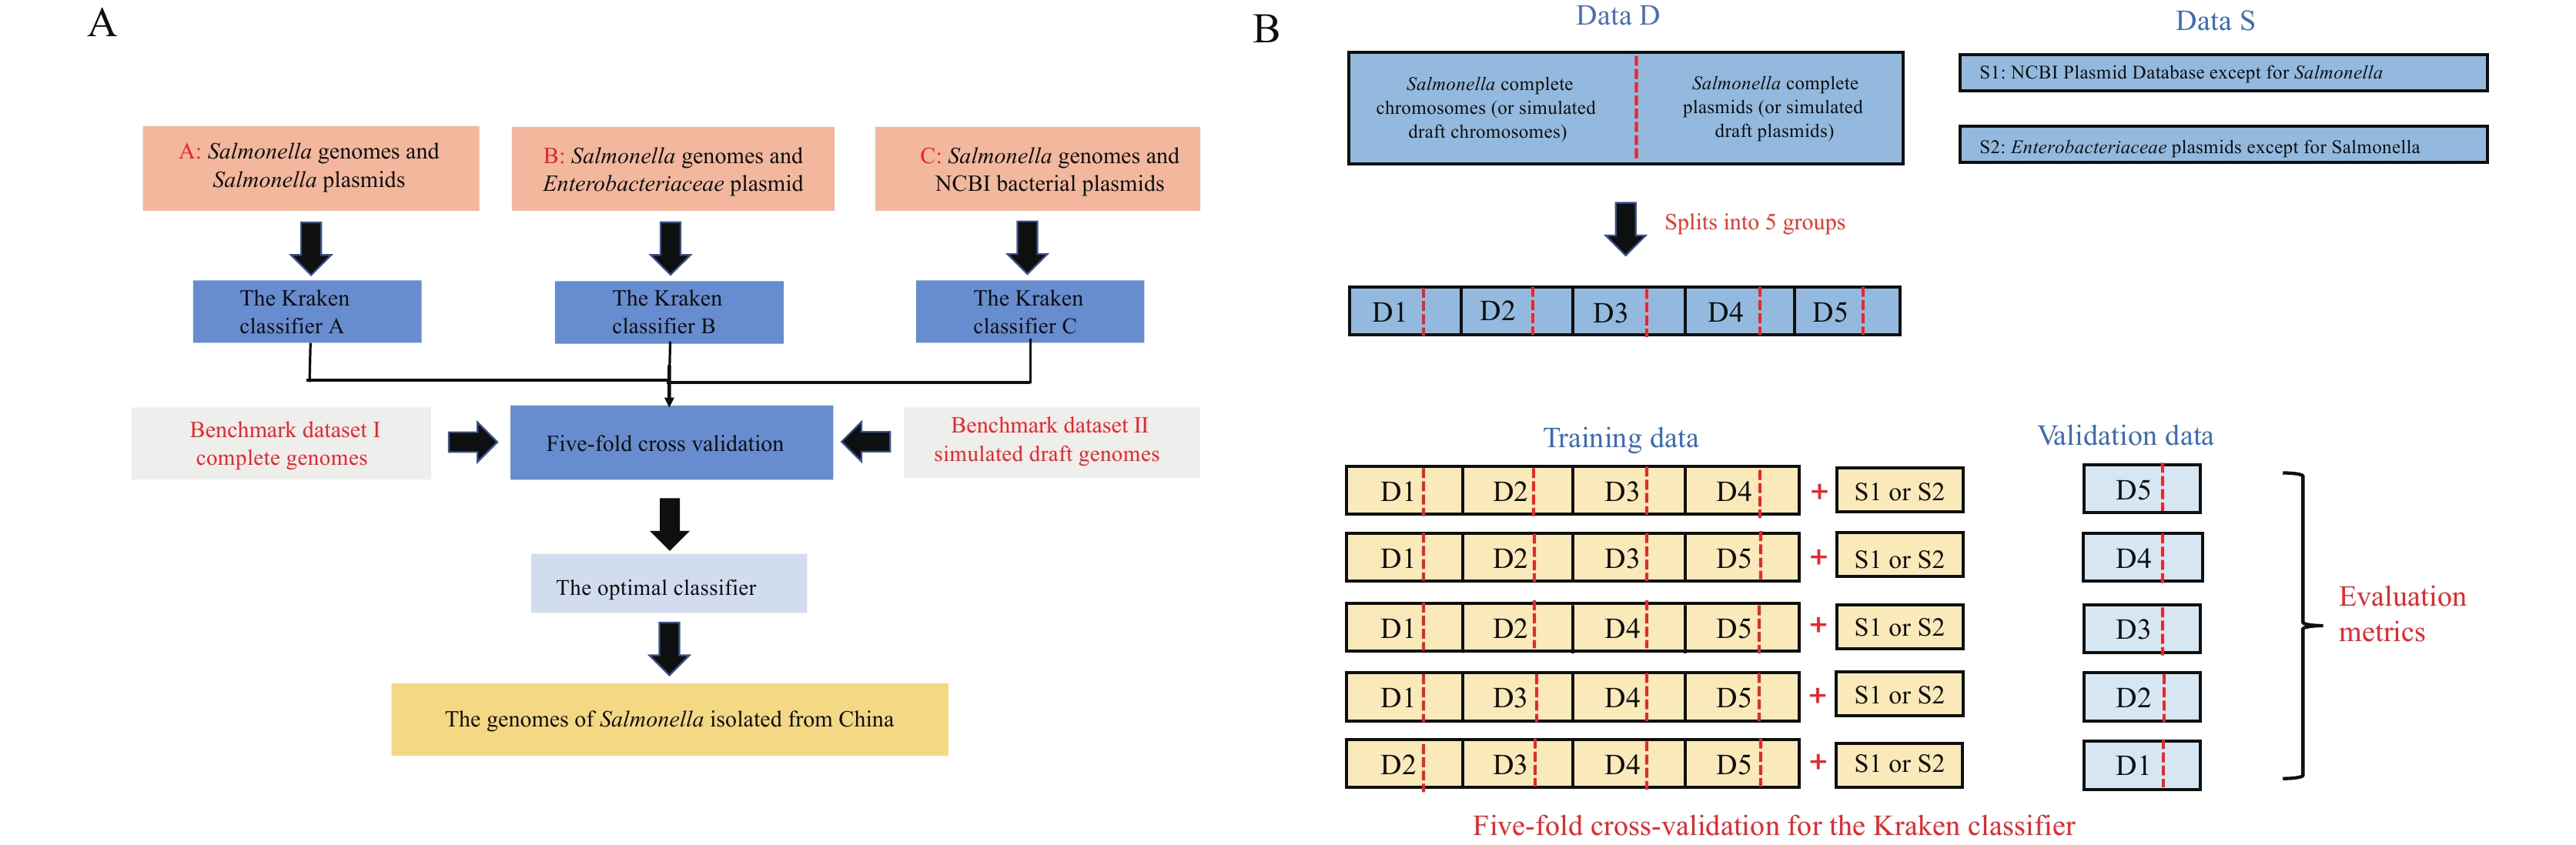 Figure 1.
The building and evaluation flow charts of our Kraken classifier for plasmid sequence prediction. (A) Scheme for building and evaluating. (B) Details of the Kraken classifier five-fold cross-validation.
Note: The detailed procedure for building and evaluating our kraken classifier is illustrated. Salmonella genomes (Data D), both chromosomes and plasmids, were divided into five groups. Four groups, together with the National Center for Biotechnology Information (NCBI) bacterial plasmid database (without Salmonella plasmids) (Data S1) or Enterobacteriaceae plasmid database (without Salmonella plasmids) (Data S2), were used as training data to build the Kraken classifier, the remaining group was used as validation data. -
Two different benchmark datasets were constructed. Benchmark dataset I includes complete genomes, and benchmark dataset II includes simulated draft genomes. Benchmark dataset I consists of 2,001 Salmonella complete chromosomes from NCBI GenBank and all NCBI RefSeq plasmids. Benchmark dataset II was created as follows: One thousand Salmonella draft genomes were randomly selected from NCBI GenBank, all draft contig lengths were obtained, deciles were calculated according to the lengths, and ten intervals were formed by the deciles. For each sequence in benchmark dataset I, each time one interval was randomly selected, an integer value was randomly selected within the interval. The process was repeated until the total length exceeded the sequence length. The sequence was then broken into a series of sequential fragments according to the selected integer values. Following this method, each sequence was fragmented.
-
Five-fold cross validation was used to evaluate the three Kraken classifiers constructed in this study (Figure 1B). For the NCBI plasmid dataset, the Salmonella plasmid sequence and chromosome sequence were divided into five groups, took out four groups and added the NCBI plasmid dataset (without Salmonella plasmids) to construct the training database, and validated the Kraken classifiers by using the other group. For the Enterobacteriaceae bacterial plasmid dataset, the Enterobacteriaceae bacterial plasmid sequences and chromosome sequences were also divided into five groups, took out four groups, and added Enterobacteriaceae bacterial plasmids (without Salmonella plasmids) to build the training database. For the Salmonella dataset, the Salmonella plasmid sequence and chromosome sequence were divided into five groups, we took out four groups to build the training database, and validated the classifiers with the other group.
-
A series of evaluation metrics were used to evaluate the classifier, including accuracy, precision, recall, specificity and false predictive value:
Accuracy=(TP+TN)/(TP+TN+FP+FN)
Precision=TP/(TP+FP)
Recall=TP/(TP+FN)
Specificity=TN/(TN+FP)
False predictive value=TN/(TN+FN)
(TP: The number of sequences that were predicted to be plasmids, and actually were plasmids. FP: The number of sequences that were predicted to be plasmids, but actually were not plasmids. TN: The number of sequences that were predicted to be chromosomes, and actually were chromosomes. FN: The number of sequences that were predicted to be chromosomes, but actually were not chromosomes.)
-
PlasmidFinder is based on an Enterobacteriaceae plasmid replicon sequence database (12). The minimum coverage threshold was set to 60% and the minimum identity threshold was set to 80%.
-
All Statistical Analyses were done using R programming language. The ggridges (
https://wilkelab.org/ggridges/ ), ggplot2 (https://ggplot2.tidyverse.org ), and eulerr (https://github.com/jolars/eulerr ) packages were used to generate ridgeline plots, violin plots, and Venn diagrams. Kolmogorov-Smirnov test was used to evaluated the distribution differences between two variables. Fisher,s exact test was used to test the proportion difference. -
Evaluation results for the three Kraken classifiers showed that the third Kraken classifier, C, which was composed of complete Salmonella genomes and all NCBI bacterial plasmids, had the highest accuracy (98.94%) and the highest recall rate (97.67%), with relatively high precision (99.94%) and specificity (99.95%). The recall rate and precision of the other classifiers were lower (Table 1).
Dataset Classifier type Accurate Precision Recall Specificity False predictive value Benchmark dataset I Kraken classifier A 98.41% 100.00% 96.42% 100.00% 98.57% Kraken classifier B 98.89% 100.00% 97.49% 100.00% 98.96% Kraken classifier C 98.94% 99.94% 97.67% 99.95% 98.86% Benchmark dataset II Kraken classifier A 99.20% 99.80% 91.23% 99.65% 99.87% Kraken classifier B 99.25% 99.64% 92.38% 99.65% 99.90% Kraken classifier C 99.28% 99.48% 92.68% 99.66% 99.90% Table 1. Evaluation results for Kraken classifier-based plasmid sequence prediction.
-
Here, according to Salmonella draft genome contig length distributions in the NCBI database, the complete genomes in the benchmark dataset (benchmark dataset I) were broken into fragments according to empirical contig distributions to construct a simulated draft genome benchmark dataset (benchmark dataset II). The distribution of chromosomal fragment lengths and the distribution of plasmid fragment lengths in our simulated Salmonella draft genome benchmark dataset showed similar distributions as the distribution of contig lengths in 1,000 randomly selected Salmonella draft genomes from GenBank, indicating that our benchmark dataset II is a good simulation of actual data (Figure 2A).
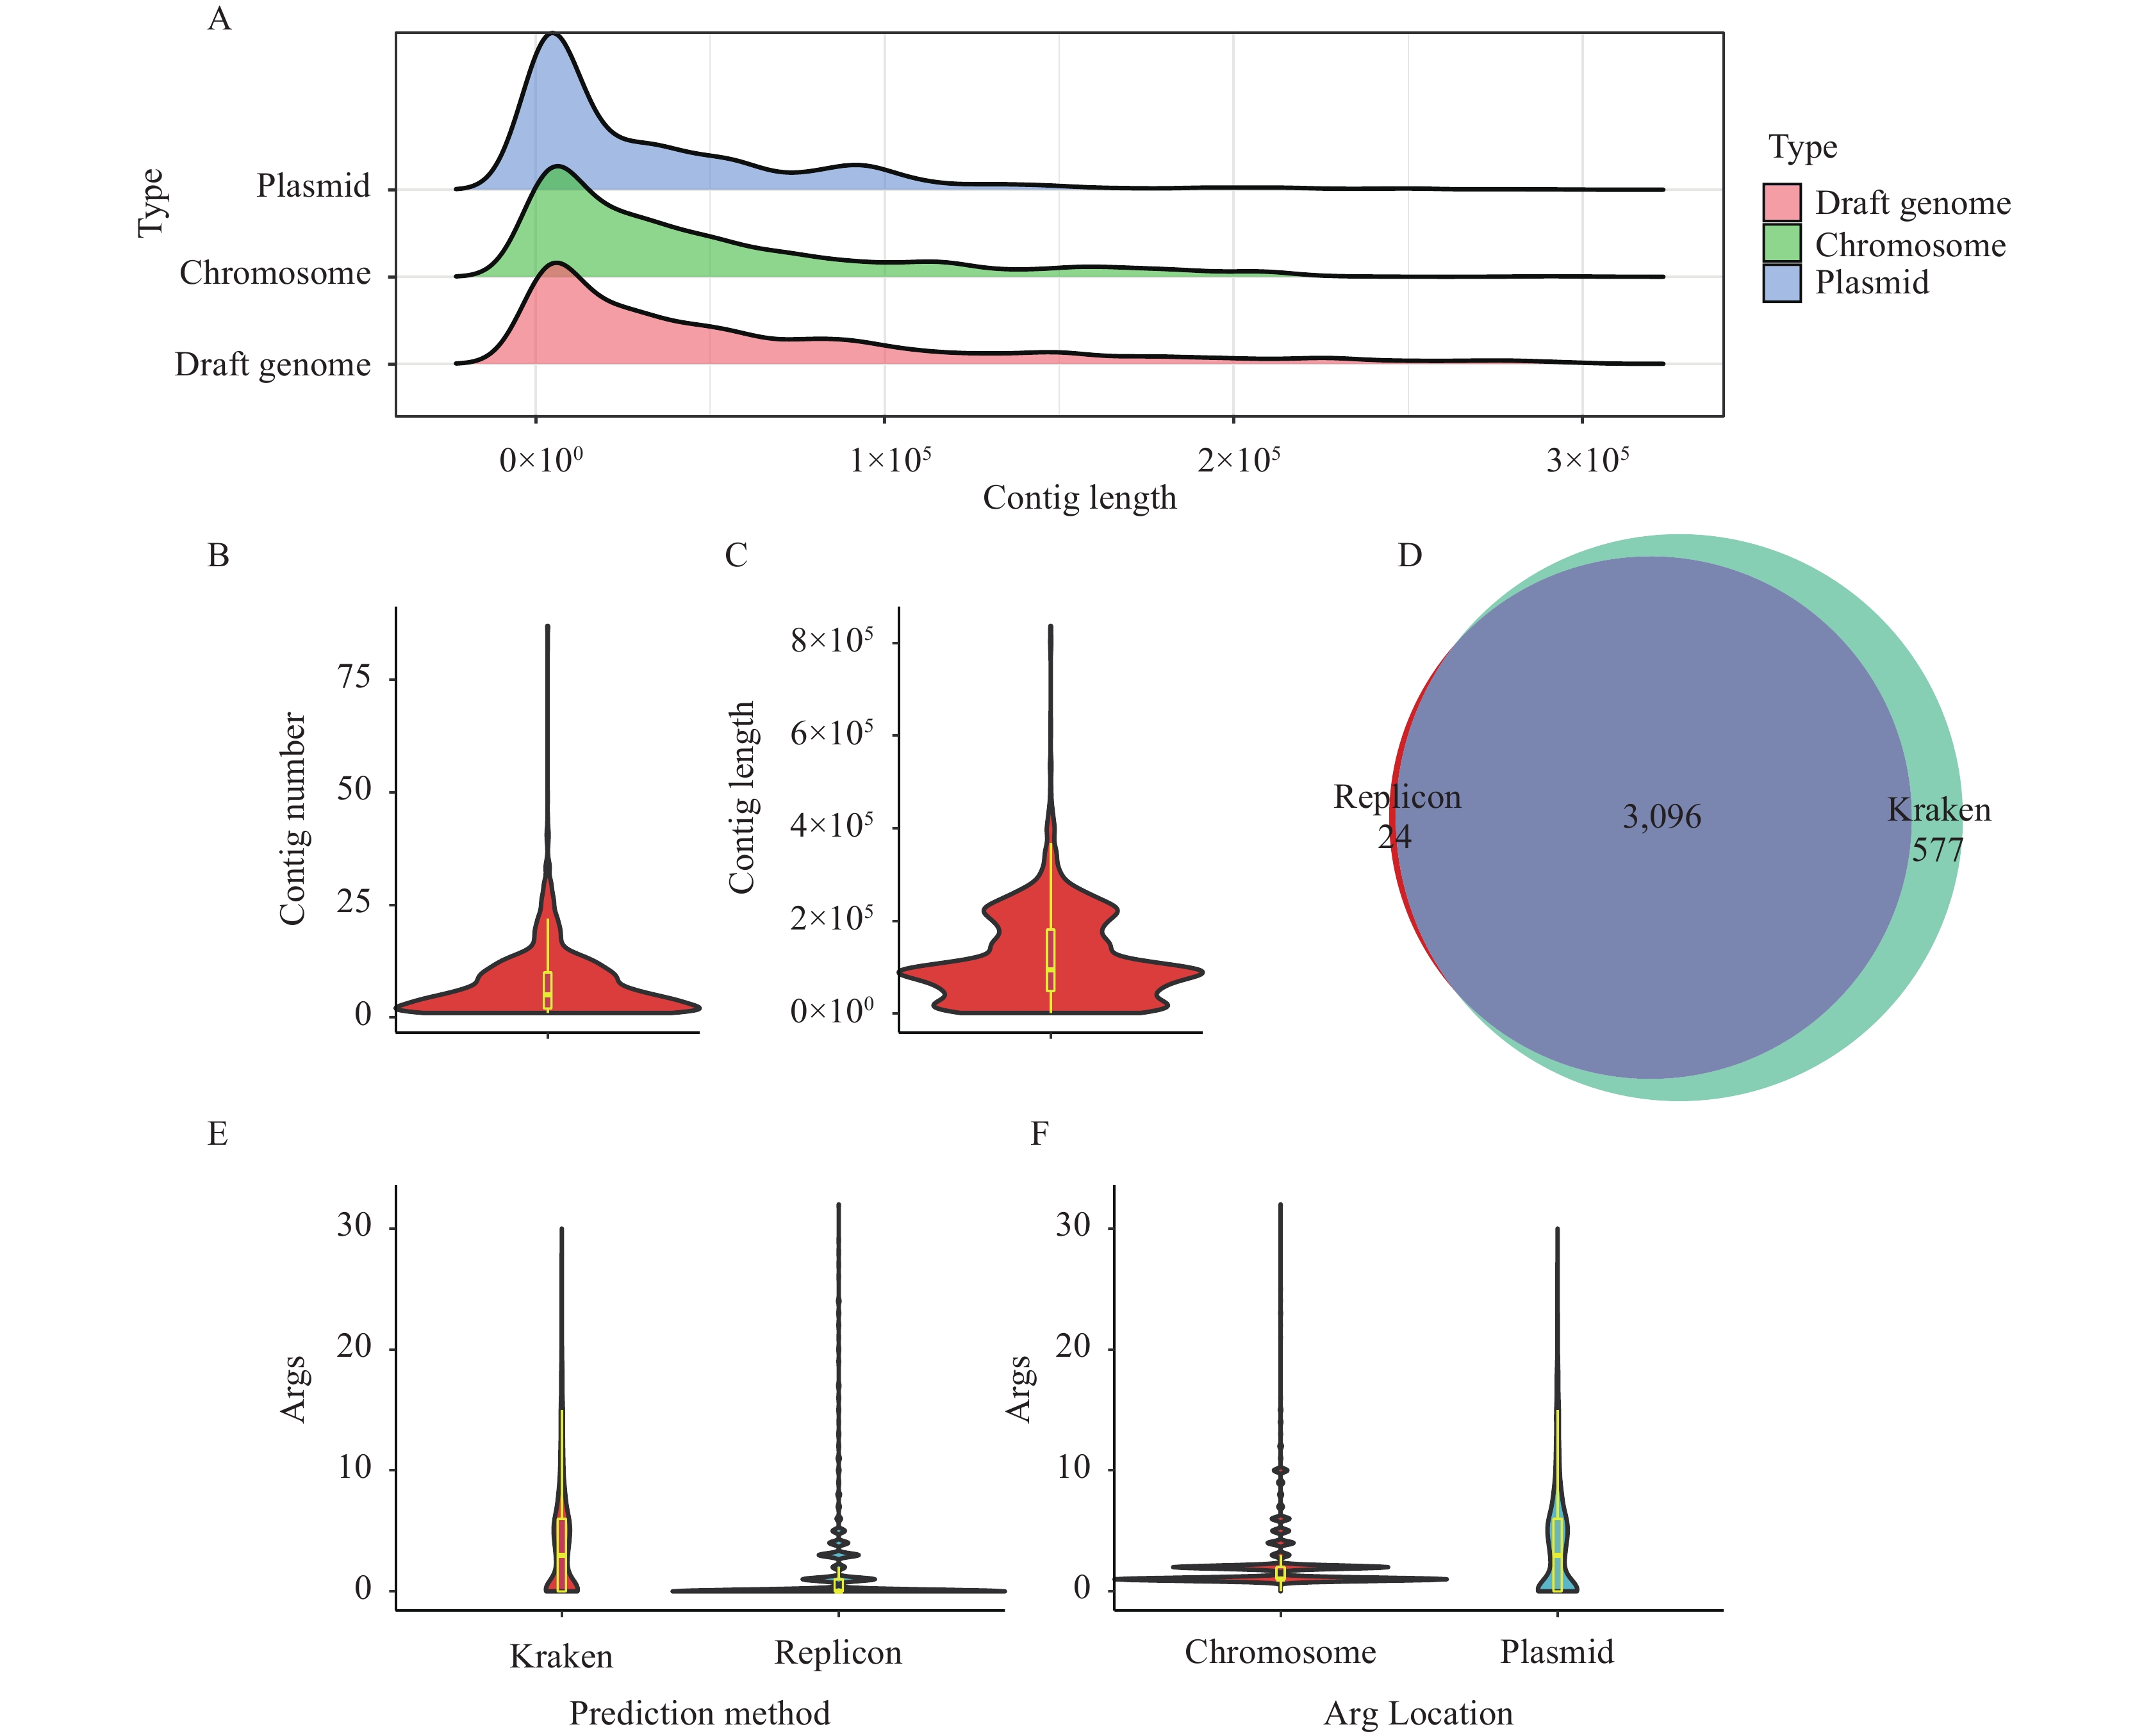 Figure 2.
The application and evaluation of Kraken classifier for Salmonella strains isolated in China. (A) Distribution of contig lengths of 1,000 randomly selected Salmonella draft genomes compared to the chromosomal and plasmid length distributions in our simulated draft genome benchmark dataset (benchmark dataset II). (B) Number of plasmid contigs per strain for Salmonella with plasmids isolated from China. (C) Total length distribution of plasmid contigs per strain for Salmonella with plasmids isolated from China. (D) Venn diagram displaying the overlap of strains containing plasmids predicted by a replicon-based method (PlasmidFinder) and the Kraken classifier. (E) Comparison of the number of ARGs carried by plasmids predicted by the Kraken classifier and the replicon-based method, respectively. (F) Comparison of the number of ARGs located in plasmids and those located in the chromosome.
Results showed that the third Kraken classifier, C, which was created from databases based on all bacterial plasmids and complete Salmonella genomes in NCBI, had the highest accuracy (99.28%). Other metrics were also relatively higher than the other two Kraken classifiers. Therefore, Kraken classifier C was selected as the optimal Kraken classifier obtained in this study.
-
A total of 4,036 draft Salmonella genomes isolated from China were collected from GenBank. Our optimal Kraken classifier was then used to predict plasmid contigs from them. Among all strains 3,673 (91.01%) were predicted to have plasmid contigs, with a median contig number of five [95% confidence interval (CI): 1–21] for plasmids (Figure 2B), and a median total plasmid length of 93,740 bp per strain (95% CI: 4,657–26,7721 bp) (Figure 2C).
To compare the Kraken classifier established in this study with a conventionally used replicon-based method, PlasmidFinder was also used to predict plasmid contigs. Among the 4,036 Salmonella strain draft genomes, 3,145 strains (72.72%) were predicted to contain plasmid contigs. Compared with PlasmidFinder, our Kraken classifier discovered that another 556 strains harbor plasmids, while the replicon-based method found 24 strains that our Kraken classifier did not (Figure 2D). Among these 24 strains, four strains had very long (>4 Mb) contigs, which may be due to the integration of plasmids into chromosomes. Additionally, contigs carrying replicons in the other 20 strains are quite short (<5 kb) and harbor extensive mobile genetic elements, making it difficult to distinguish whether these contigs belong to chromosomes or plasmids, or are the result of assembling error.
Simultaneously, the predictive ability to discover ARGs between the replicon-based method and the Kraken classifier was compared and it was found that the replicon-based method evaluated the median number of plasmid-borne ARGs to be zero (95% CI: 0–5). The Kraken classifier assessed the median number of ARGs carried by plasmids to be three (95% CI: 0–14), which is significantly different (P value <0.001, Kolmogorov-Smirnov test) (Figure 2E), suggesting the Kraken classifier established in this study can predict more ARGs carried on plasmids than other methods.
Using our Kraken classifier predictor, the median number of chromosome-carrying ARGs of each strain was one (95% CI: 1–7), and the median number of plasmid-borne ARGs was three (95% CI: 1–14). This is a significant difference in ARG distribution between chromosomes and plasmids in these Salmonella strains (P value <0.001, Kolmogorov-Smirnov test) (Figure 2F).
Quinolone and third-generation cephalosporins are commonly used antibiotics in clinics. ARGs can be carried on chromosome and plasmids in Salmonella. Here, our Kraken classifier was used to predict chromosomal and plasmid locations of these ARGs in 4,036 Salmonella strains. It was found that 1.88% of the strains have the acquired quinolone-related resistance genes on chromosomes, while 11.90% of the strains carry acquired quinolone-related resistance genes on plasmids. Besides 7.71% of the strains carry third-generation cephalosporin-related resistance genes on chromosomes, while 62.61% of the strains carry the gene on plasmids (Table 2). The number of strains carrying quinolone-related resistance genes or the acquired third-generation cephalosporin-related resistance genes on plasmids is significantly higher than that carrying the corresponding resistance genes on chromosomes (P value <0.001, Fisher's exact test).
Antibiotic type ARG Number of ARGs Number of ARGs isolated on chromosome Number of ARGs isolated on plasmids Number of ARGs isolated on both chromosome and plasmids Undefined P value Quinolone resistance qnrA 4 0 4 0 0 0.02 qnrB 182 0 182 0 0 <0.001 qnrD 3 0 3 0 0 0.06 qnrS 1,054 19 778 2 259 <0.001 qnrVC 4 0 4 0 0 0.02 qepA 29 0 29 0 0 <0.001 aac(6')-Ib-cr 942 76 299 3 570 <0.001 oqxA 797 13 221 0 563 <0.001 oqxB 798 13 225 0 560 <0.001 qnrS 1,054 19 778 2 259 <0.001 Third-generation cephalosporins
resistanceblaTEM 1,607 94 838 7 682 <0.001 blaCTX-M 863 192 408 17 280 <0.001 blaOXA 854 80 205 2 571 <0.001 blaCMY 27 1 23 1 4 <0.001 blaDHA 24 0 24 0 0 <0.001 blaNDM 10 2 8 0 0 0.02 blaSHV 5 0 5 0 0 0.01 Abbreviation: ARGs=antibiotic resistance genes. Table 2. Comparison of quinolone and third-generation cephalosporin-related ARGs prediction results.
-
The Kraken classifier can be a useful tool in metagenomic species identification because of its ultra-fast speed and high accuracy (7). Kraken-based plasmid prediction methods demonstrated the highest accuracy and F1 score (an evaluation metric for the performance of a machine learning model) compared to other methods (Centrifuge, RFPlasmid, mlplasmids, PlaScope, and Platon), with balanced sensitivity and specificity (13). Our results also show that our Kraken classifier has high accuracy, precision, and sensitivity when applied to the prediction of plasmid sequences carried by Salmonella. Furthermore, our optimal Kraken classifier, built with all NCBI bacterial plasmids and Salmonella complete genomes, proved to be an ideal method for Salmonella plasmid sequence prediction.
In our study, three kinds of customized Kraken databases were used to construct three different Kraken classifiers. It is challenging to choose the ideal database. It was found that the Kraken classifier based on NCBI bacterial plasmids and Salmonella complete genome data had the highest prediction accuracy and could be used as an optimal customized Kraken database for Salmonella plasmid prediction.
The optimal Kraken classifier was used to predict the plasmid sequences from Salmonella strains isolated from China and it was found that 91.01% of these strains carried plasmids. PlasmidFinder is a traditional and easy-to-use tool for plasmid sequence and type detection that relies on the fact that most plasmids have identifiable replicon sequences (14). However, finding plasmid contigs containing undiscovered replicons with replicon-based methods is quite difficult. In this study, plasmid contigs from Salmonella sequences isolated from China were predicted and it was found that our Kraken classifier could find more strains that carried plasmids than plasmid-based replicon methods, suggesting the Kraken classifier we established in this study would be a useful tool for determining plasmid contigs in bacterial draft sequences. Those plasmid contigs not detected by our Kraken classifier may be due to the integration of plasmids into the chromosomes or the presence of a large number of MGE-related genes.
Plasmids are an important reservoir of ARGs and a vector of resistance transmission (15). Our newly developed Kraken classifier can find more plasmid contigs than the existing methods, and, therefore, can find more ARGs carried on plasmids. In Salmonella strains isolated from China, the number of plasmid-borne ARGs was higher than that of chromosomes-carrying ARGs. Currently, obtaining an entire complete genome sequence remains somewhat challenging. It was expected that the Kraken classifier developed in this study will become crucial for monitoring ARGs in the future.
-
Steven M. Thompson from Liwen Bianji (Edanz) (
www.liwenbianji.cn/ ), for editing the English text of multiple drafts of this manuscript. -
No conflicts of interest.
HTML
Three Customized Kraken Databases
Two Benchmark Datasets
Kraken Classifiers Evaluation
The Metrics of the Kraken Classifier Evaluation
Plasmid Prediction Based on PlasmidFinder
Statistical analysis and plotting
Classifier Evaluation Based on the Complete Genome Benchmark Dataset (Benchmark Dataset I)
Classifier Evaluation Based on the Simulated Draft Genomes Benchmark Dataset (Benchmark Dataset II)
Analysis of Plasmid Carrying Prevalence and Plasmid Carrying ARGs for Salmonella Isolated From China
| Citation: |

|