
 Download:


-
Influenza infections were reported to be low between the months of September 2021 and January 2022 (1). The relaxation of coronavirus disease 2019 (COVID-19) non-pharmacological interventions and the increased susceptibility during the past COVID-19 pandemic have provided an opportunity for an increase of more severe influenza epidemics to occur in upcoming winters in temperate locations.
Infectious disease surveillance systems would provide historical information on the occurrence of infections and allow early detection of influenza outbreaks before they are past the point of being contained. The surveillance strategies that map out individual contact behaviors fall into two general categories — those based on static contact networks and those on temporal contact networks. Due to contact networks being essentially dynamic with temporal-network structures [such as burstiness — individual activities often happen in periods of intense activity (2)], the problem remains somewhat more practical in the context of temporal contact networks.
Retrospective studies have demonstrated that temporal network structures can influence the spreading speed and the outbreak size but also surveillance strategies (3–5). Cowling et al. compared two temporal-network strategies to select sentinels [sampling the recent contact, as the recent strategy, and most frequent contact, as the frequent strategy, with random individuals (2)], as well as two static-network strategies (acquaintance and random), on temporal networks for sentinel surveillance of outbreak detection (3). The two temporal-network strategies both derive earlier signals than static-network strategies for early epidemic detection on networks with strong temporal structures. However, due to physical contact data being difficult to obtain, these strategies are difficult to be applied to practical public health systems.
To detect an early signal for the emerging outbreak using sentinel surveillance, the digital data on Electronic Health Records (EHR) provide a unique chance to test cutting-edge sentinel surveillance strategies. The EHR of influenza viruses can help detect other viruses, and have temporal characteristics with records of when individuals were infected. Our previous study found treatment records can be used to monitor emerging epidemic outbreaks (e.g., influenza) and proposed a simple EHR-based strategy that identifies the most vulnerable individuals who acquired the earliest infections during historical influenza seasons and could be a theoretically optimal surveillance subset (6). However, it does not account for the real-world data validation, the temporal contact networks (in which the contact structure may not be persistent enough), and the cross-strain immunity (which could be gained during an influenza season to protect the previously infected individuals from the reinfection of a group of strains).
In the current study, we produced a practical data-driven surveillance strategy by targeting previously infected nodes with low cross-strain immunity to accelerate outbreak detection using sentinel surveillance of previous earliest infected individuals. We validated this strategy with a real-world cohort study and further validated it by simulations using mathematical epidemic models in temporal networks. We quantified the early warning and Peak lag gained by these selected individuals over different transmission scenarios of effective reproduction numbers, Res.
-
In the published dataset (7), serum specimens were collected from a cohort of participants from 2008 to 2011, with each annual record for 956 individuals. We identified an individual to be infected or not using a 4-fold criterion of hemagglutination inhibition (HAI) titers for each study year. Informed by the infection history, we could evaluate the infection probability of a case infected in a year based on the historical records, together with its 95% confidence interval, using the method of one-sample t-test.
-
We investigated three temporal-network strategies for designing network-based surveillance systems. To test the generality of our methodology, we compared it with available temporal-network surveillance strategies shown in Cowling et al. using three classes of temporal complex networks with distinct temporal features (
Supplementary Material ) (3). -
We simulated epidemic outbreaks using a stochastic chain-binomial model in contact networks with nodes as individuals and edges as epidemiologically relevant contacts between individuals. We used the following two criteria to evaluate the performance of each surveillance strategy in the test epidemic season: Early warning, and Peak lag (
Supplementary Material ). -
In the static-network study, nodes with higher eigenvector centrality were the theoretical optimal surveillance subset (8). Conversely, nodes, which were infected earlier, tended to have a higher eigenvector centrality (6). We proposed a novel surveillance strategy to target previously infected nodes (History) based on estimating the vulnerability of each individual using their infection history of seasonal respiratory disease (e.g., influenza) registered in the EHR (Figure 1). Let
$ \tau^i_j $ the time at which an individual$ j $ acquires infection in season i. We defined the vulnerability of an individual$ j $ to contract a respiratory disease by their infection times in influenza season one year ago. This vector ranked each individual in the population by its historical vulnerability to getting infected, which we used as a surveillance strategy.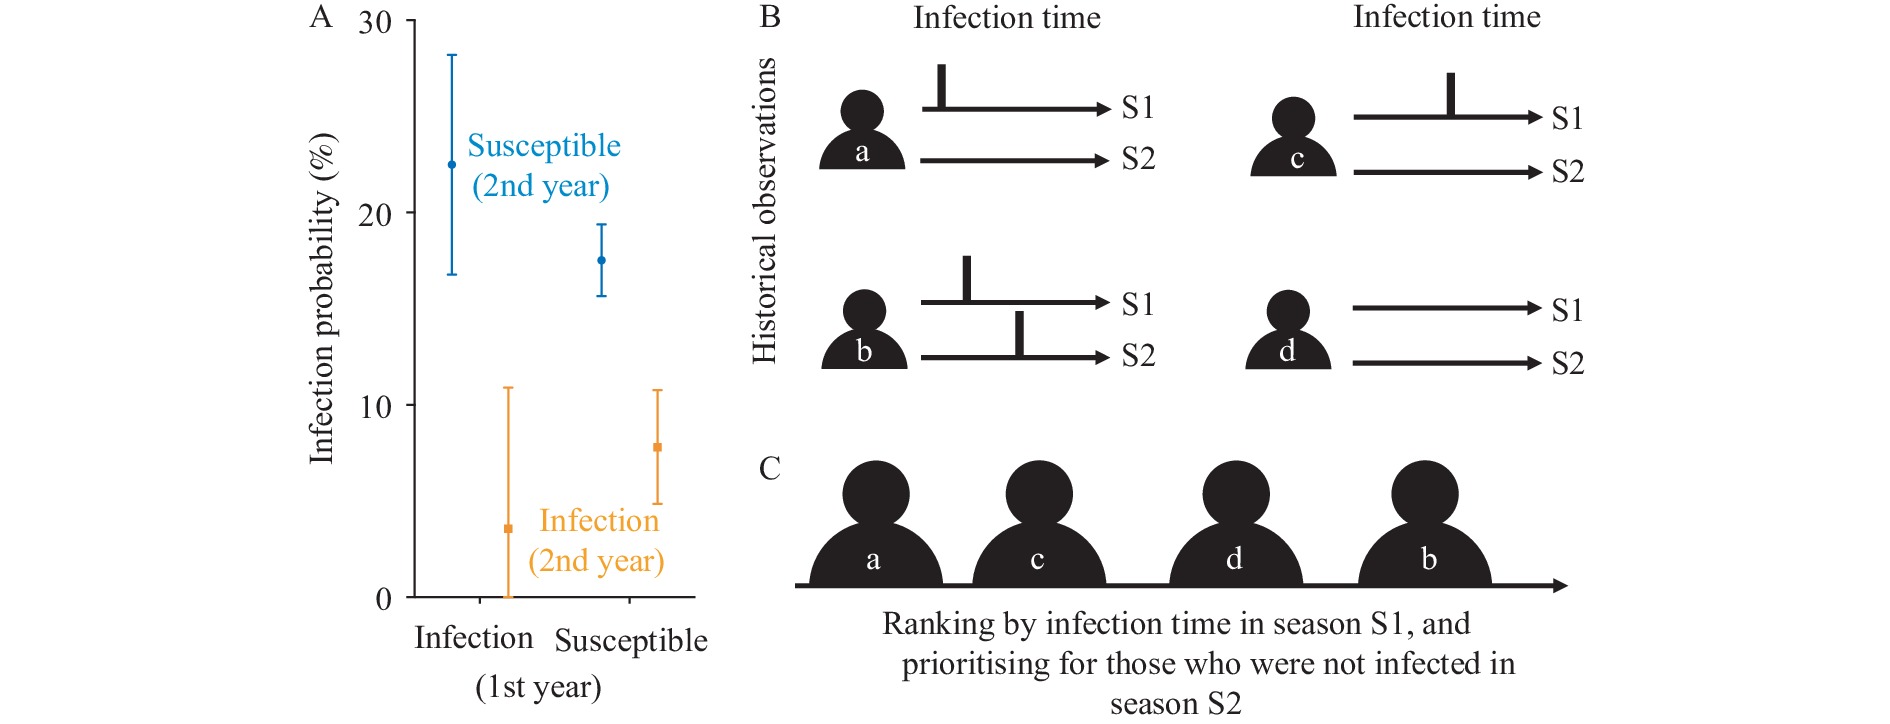 Figure 1.
A schematic of the proposed surveillance strategy to target previously infected nodes (History). (A) Infection probability of influenza virus in Hong Kong Special Administrative Region. (B) Informed by available historical observations of individuals (a, b, c, and d) over two seasons from S1 to S2, each for one year. (C) In our proposed surveillance strategy, individuals are ranked by the infection time in season S1 for season S2.
Note: In panel A, we studied a cohort of 956 participants from 2008 to 2011 with annual electronic records for three years (2008 to 2010, and 2009 to 2011) (7). We estimated the probability of a case being infected in the third year, which was infected or not in the past two years (
Supplementary Table S1 ). Vertical bars and error bars represent the estimated mean and 95% CIs. In panel B, the average historical vulnerability of an individual is estimated from the historical infection time. In panel C, the black bars denote the observed infection timing of individuals in the first and second/third historical seasons.Abbreviation: S1=the first season; S2=the second season.
To be convenient to use by policymakers (e.g., doctors in hospitals), Figure 2 provides a schematic overview of the proposed surveillance strategy with four guidelines. Individuals who were uninfected in the current season but infected in the last season had higher rankings than others, which could have been higher if they had been infected earlier in the last season and had had more infection records in previous seasons.
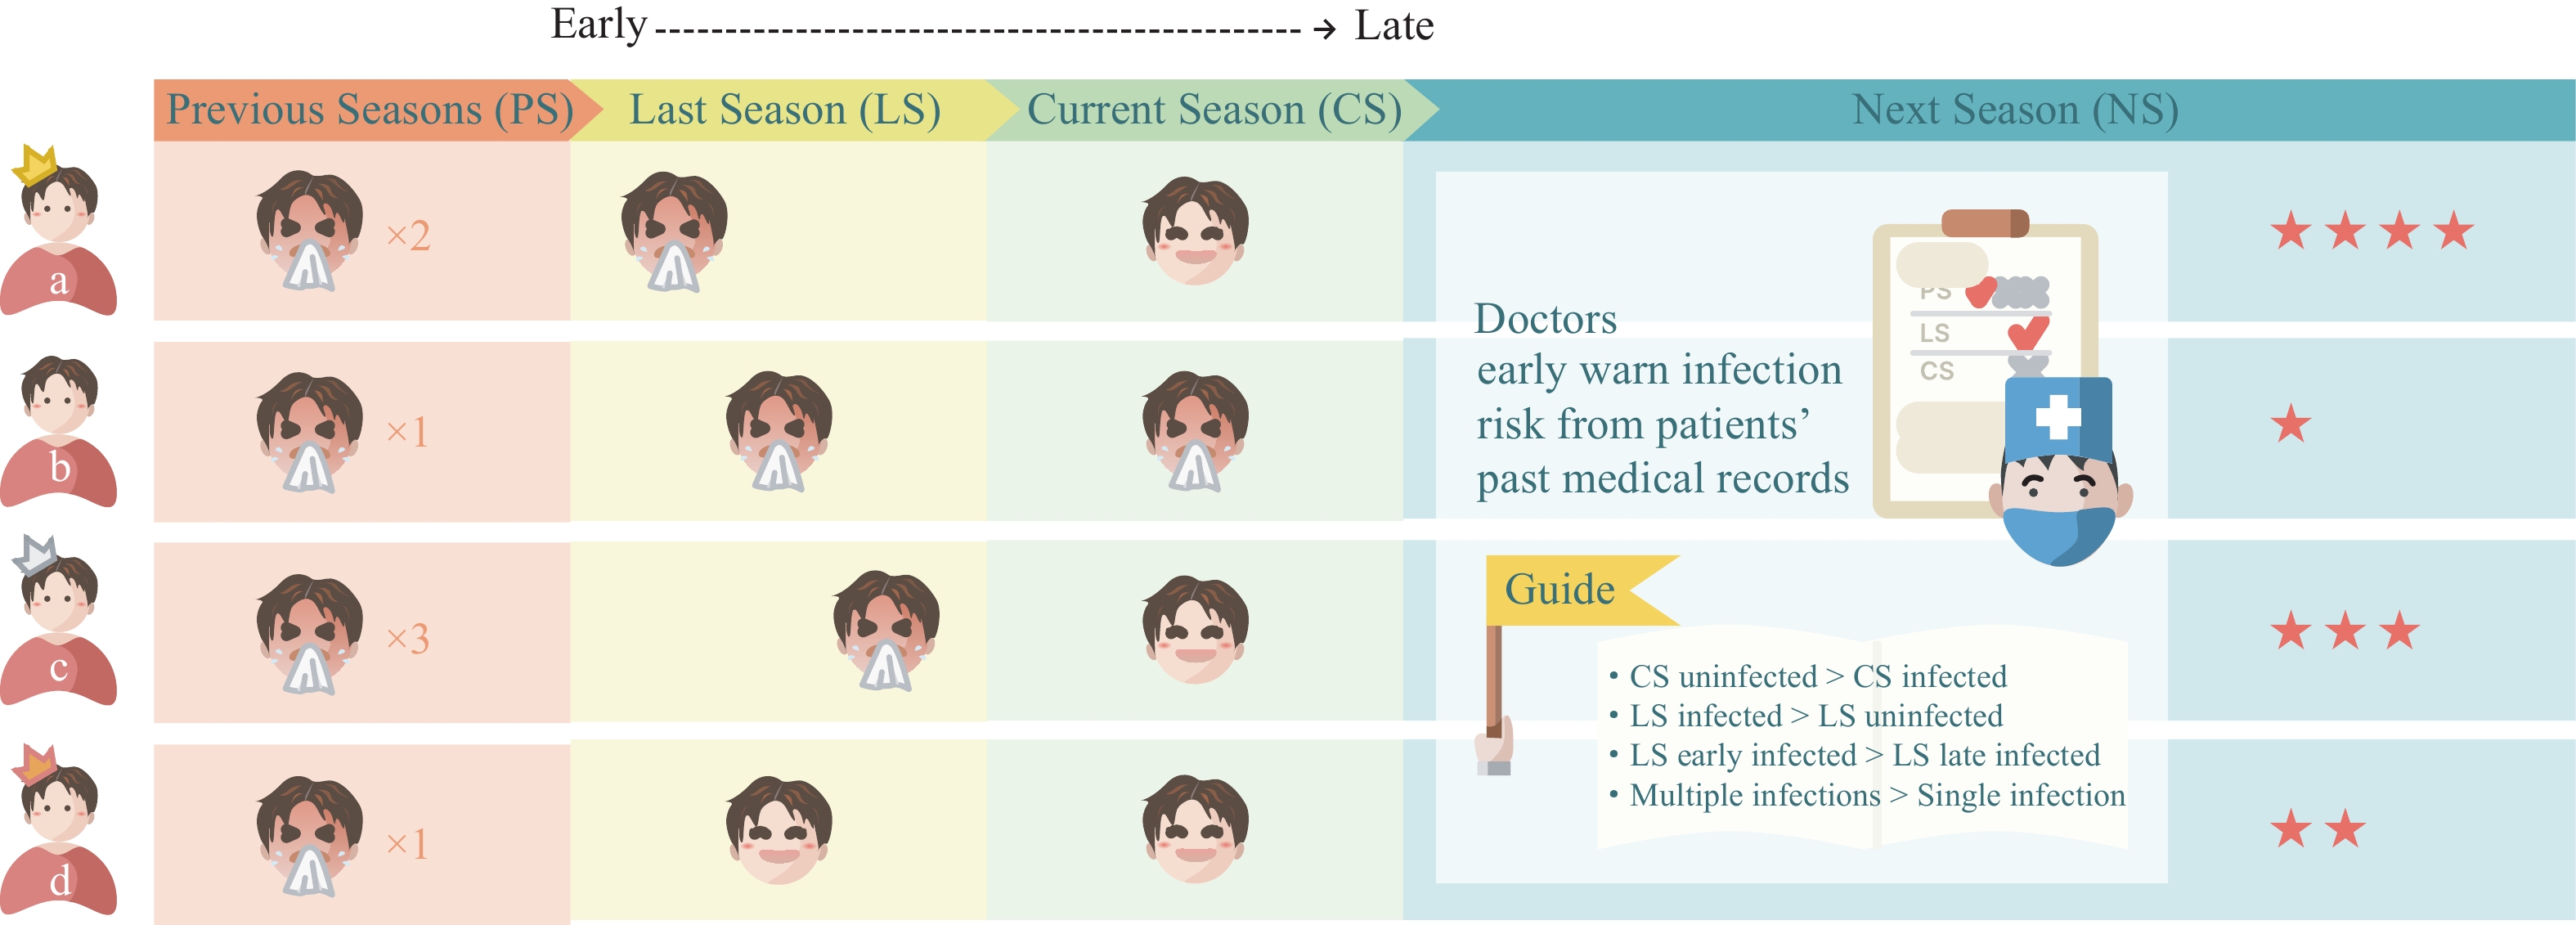 Figure 2.
A simplified schematic illustration of the proposed surveillance strategy.
Note: The proposed strategy ranks the included individuals following four guidelines. Individuals who were uninfected in the current season but infected in the last season have higher rankings than others. And individuals can get a higher ranking if they were infected earlier in the last season and have more infection records in previous seasons. By taking four individuals (a, b, c, and d) as an example, users (e.g., doctors in hospitals) can assess their electronic records of historical seasons at the end of the current season. Individuals a and c have one infection record in the last season, none in the current season, and are ranked the highest. Given that a has been infected earlier than c, a has a higher ranking than c. If a and c have the same infection times in the last season, we could compare the number of infection records in previous seasons. Finally, the ranking of the four individuals is a, c, d, and b. We used golden/silver/copper crowns and red stars to mark their ranking from high to low. -
Informed by a cohort of around 1,000 participants from 2008 to 2011, when influenza A(H1N1)pdm09 circulated, with an annual electronic record of influenza HAI titers (7), we identified an individual to be infected or not using a 4-fold criterion of HAI titers for each study year and estimated the infection probability of a case infected in the third year with/without infection during the past two years (Figure 1A and
Supplementary Table S1 ). The participants, who were infected in the first year but not in the second year, had the highest infection probability of 22.49% [95% confidence interval (CI): 16.78%, 28.20%] in the third year (Figure 1A). In the contact network structure, those participants may have more contact behaviors and low cross-strain immunity in the third year and thus have a higher probability of infection. And historical EHR data can help identify those with higher infection risks of influenza outbreaks to some extent. -
We compared our proposed strategy (History) (Figure 1) with three conventional temporal-network-based surveillance strategies, including 1) the recent strategy; 2) the frequent strategy, which uses the top 10% of individuals with the highest numbers of most recent and frequent connections, respectively; and 3) the random acquaintance strategy, which first randomly selects 10% of a randomly selected individual as the surveillance node (Figure 3).
 Figure 3.
Schematic illustration of surveillance strategies. (A) The example of a temporal network with two time phases. (B) The schematic illustration of the Recent surveillance strategy. (C) The schematic illustration of the Frequent surveillance strategy. (D) The schematic illustration of the Random surveillance strategy. (E) The schematic illustration of the history surveillance strategy for previously infected (PI). (F) Surveillance objectives.
Note: In panel A, the first time phase is for training and the second one is for epidemic simulation. In panel B, C, D, and E, the horizontal line denotes an individual and the circles and vertical lines indicate the interaction. We marked the first infected node as “Seed” in the second time window, the node selected randomly to trigger surveillance strategy as “Random”, the node for sentinel surveillance as “Monitor” following different strategies. In epidemic simulation, gray and black circles with red borders denote infectors and infectees, respectively. In panel F, we compared the prevalences between nodes in the surveillance subset and those in the whole population. We calculated the time lag between the two groups reaching 1% prevalence (early warning) and their epidemic peaks (peak lag).
* means the end time of the training phase.
In temporal networks, different from static networks, the experience period for strategy learning may not correlate with the evaluation period for testing, and individual interactions may happen in a short period. This may fail surveillance strategies if the high centrality nodes in the experience period decrease their centrality significantly or interactions in the evaluation period. Thus, we investigate the impact of burstiness [the phenomenon that human activities often happen in intense periods separated by periods of inactivity (2)] and persistence [measured by the fraction of edges that is present both in the first and last 5% of the contacts by the Jaccard similarity coefficient (2)] on the performance of early warning and Peak lags (
Supplementary Table S2 ). We collected and summarized the properties of the study temporal networks inSupplementary Table S2 , with burstiness ranging from 0.39 to 0.72 and persistence ranging from 0 to 0.18.Burstiness may correlate with the early warning negatively (
Supplementary Table S3 ). In the evaluation criteria for early warning, the proposed strategy outstrips the random strategy in all three networks. The performance of our strategy is also comparable to the frequent and recent strategies in the Prostitution and Email networks, but not in the Dating network (which has the highest burstiness) (Figure 4 andSupplementary Table S3 ). For example, in the Prostitution network, under a low transmission scenario (Re=1.2) and a high transmission scenario (Re=3), the history strategy has an early warning of 1.78 days (95% CI: 0.00, 3.56) and 0.71 days (95% CI: −0.54, 1.95), respectively, which is around a half day earlier than the recent and frequent strategies. In the Dating network, the history strategy is better than the random strategy but not the other two. As for Peak lag, there is no significant difference among study strategies in the three temporal networks, given the large 95% CI (Figure 4 andSupplementary Table S4 ).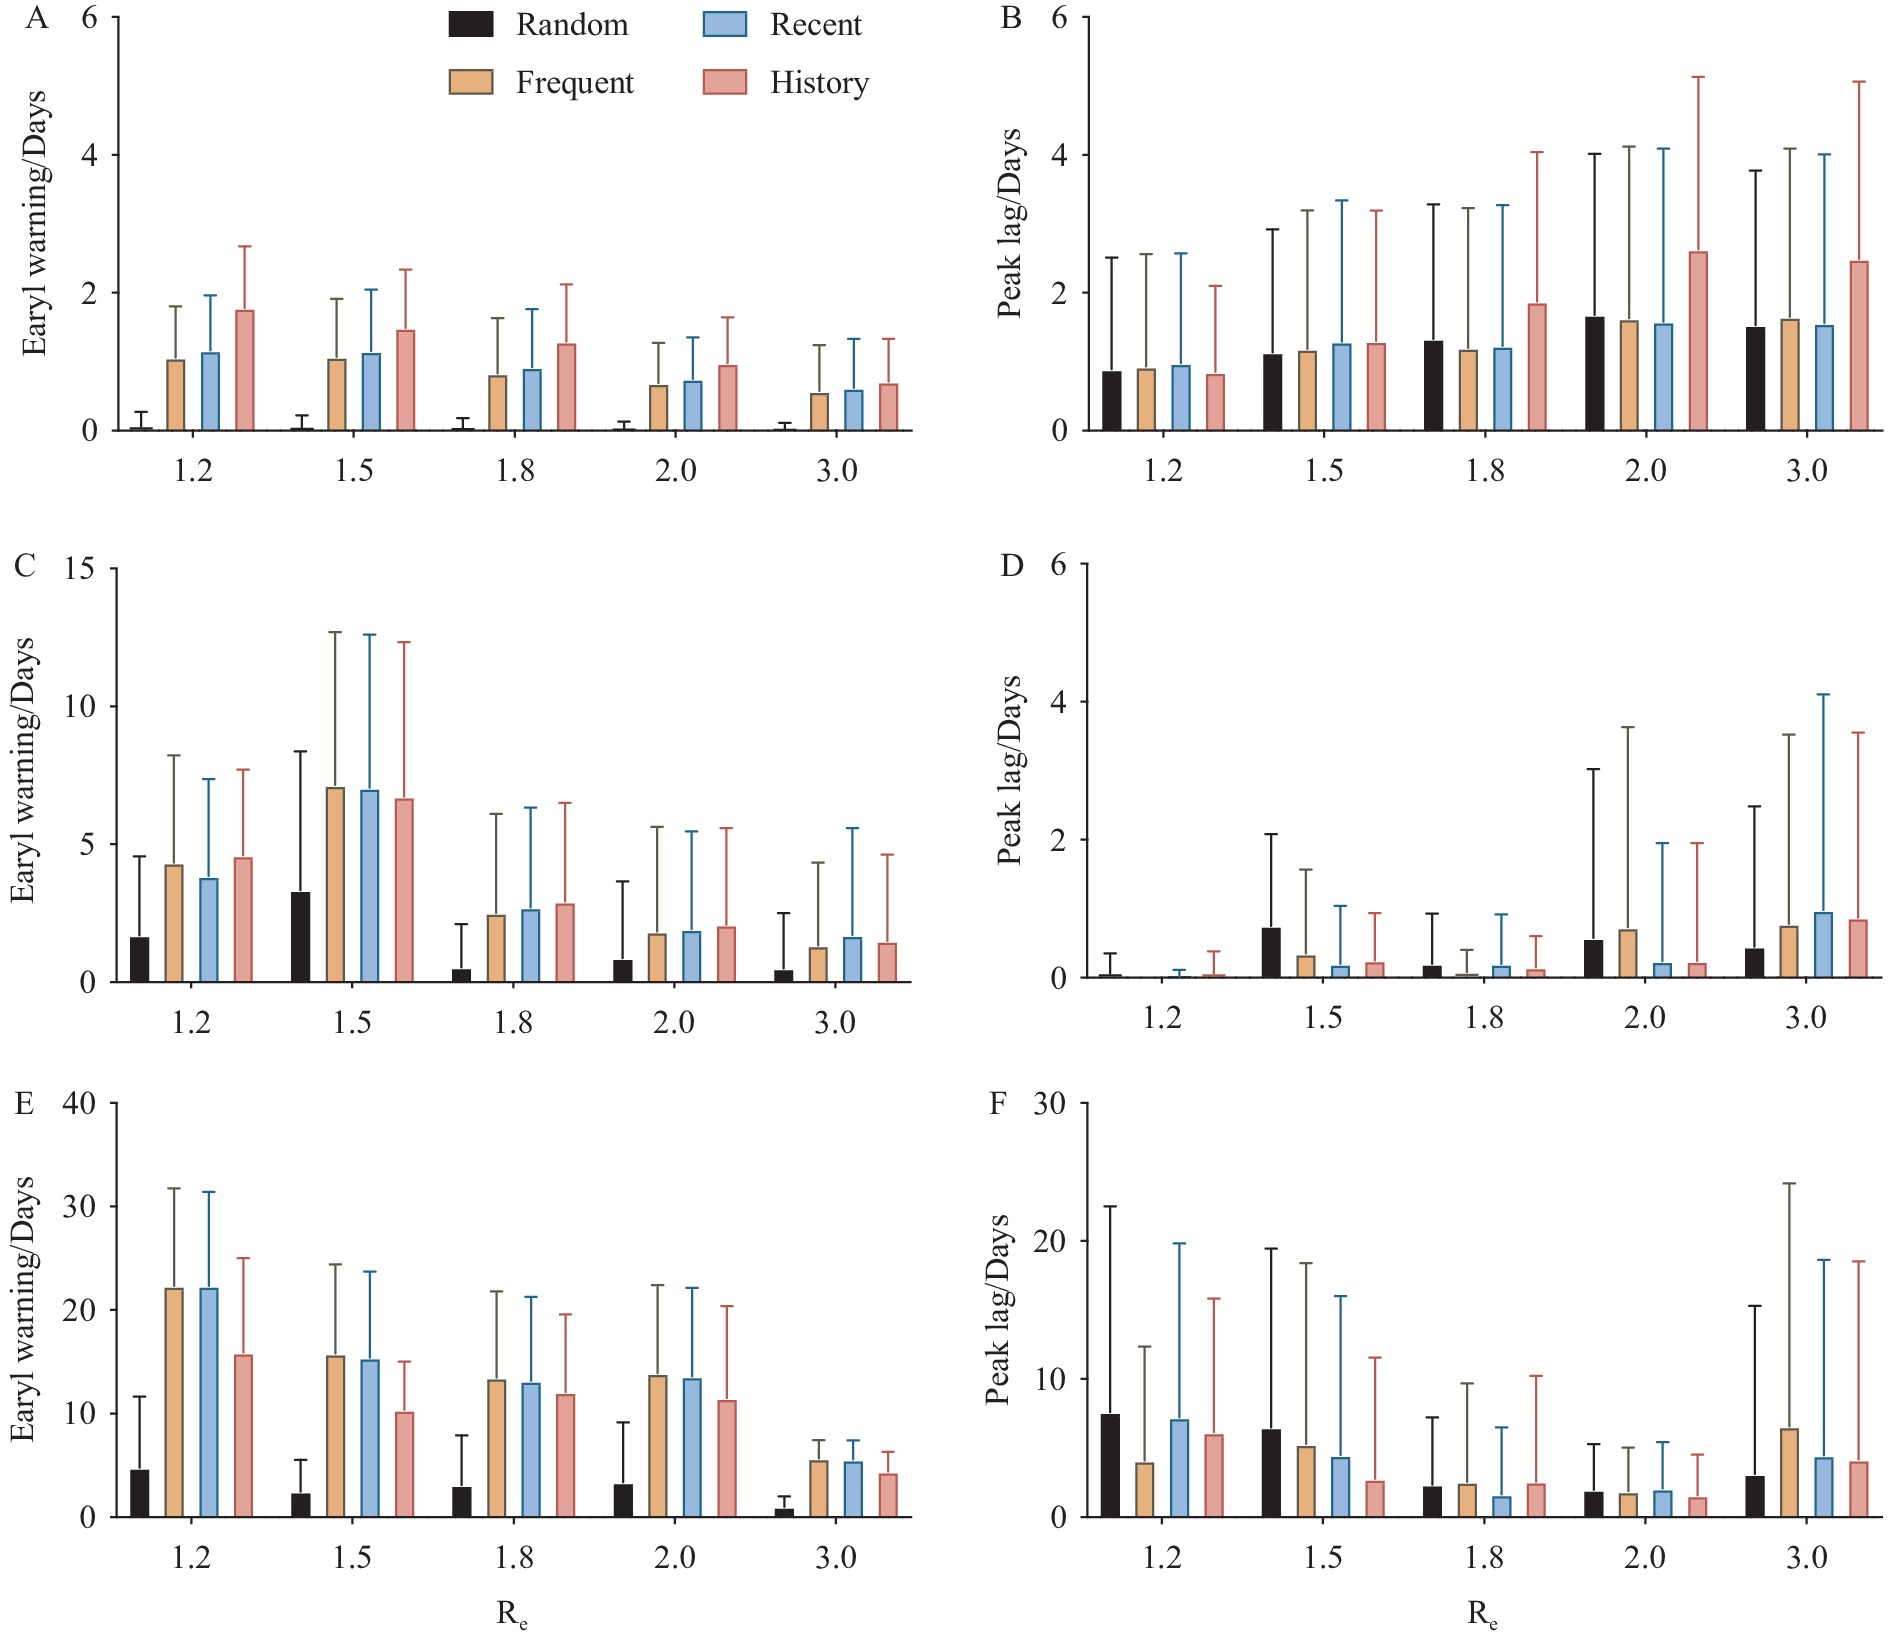 Figure 4.
Early warning and Peak lag of the random, recent, frequent, and history strategies. (A) Early warning in the Prostitution network. (B) Peak lag in the Prostitution network. (C) Early warning in the Email network. (D) Peak lag in the Email network. (E) Early warning in the Dating network. (F) Peak lag in the Dating network.
Note: The history strategy here uses the EHR records obtained from historical seasons two years ago. The horizontal and vertical axes present the early warning (days) in the left panels and Peak lags (days) in the right panels for each strategy over effective reproduction numbers (Re). Bars and error bars indicate the mean and standard deviations across 100 simulations of each temporal network. The burstiness of Prostitution, Email, and Dating are 0.39, 0.62, 0.72 (
Supplementary Table S2 ).Abbreviation: EHR=Electronic Health Record.
-
Although influenza outbreaks are extremely challenging to predict (9), alerting the onset of an influenza pandemic would be extremely important for public health agencies to respond before it pasts the point of being contained.
Building on the availability of electronic health record systems, we proposed a novel surveillance strategy of selecting previously infected individuals for sentinel surveillance in temporal networks. The beauty of this approach is to exploit contact structure without having to measure it — which is both difficult and may change over time, inspired by that history of infection will reflect temporal contact structure if it is persistent enough. In practical use, for a new emerging or reemerging infectious disease, it is not necessary for our proposed strategy to ask for patient infection history or prior knowledge of the same disease.
The proposed strategy does not work well in the Dating network, perhaps due to its high bursty coefficient (
Supplementary Table S2 ). Individuals just have intensive contact for a short period and hinder the subsequent infections. For instance, one individual who has intensive contacts in the training seasons has a higher probability of getting infected than other individuals, and thereby is ranked higher in our proposed history strategy. However, this individual may make few contacts in the test season and has a lower probability to be infected and fail the history strategy.EHRs are the most essential component of health information technology, with hospital adoption rates representing a country’s level of medical digitalization. In China, it was 83.6% and 86.6% in 2018 in China’s economically underdeveloped and developed hospitals, respectively (10). Although the growth rate of EHR adoption has been slow since 2013, as a result of many hospitals in underdeveloped areas lacking sufficient financial support and staffing funds, the Chinese government has begun to reform relevant policies, implementing both financial assistance and policy-guiding measures gradually (10). With the implementation of EHR systems in underdeveloped and developed areas in near future, we expect our EHR-based strategy to become increasingly widely used in China.
We concluded that the proposed strategy of using historical records for sentinel surveillance selection is competitive with other existing surveillance strategies in temporal networks and can be taken as a practical and robust alternative without the knowledge of individual contact behaviors for public health policymakers. This study can deepen the understanding of sentinel surveillance and guide future strategies with diverse data sources, especially digital health data.
-
BJC consults for AstraZeneca, Fosun Pharma, GlaxoSmithKline, Moderna, Pfizer, Roche and Sanofi Pasteur. BJC is supported by the AIR@innoHK program of the Innovation and Technology Commission of the Hong Kong SAR Government. No other conflicts of interest.
HTML
Cohort Data
Surveillance Strategies
Epidemic Model
Proposed Surveillance Based on Individual Historical Vulnerability


Real-world Evaluation Using Historical Influenza Infections from a Cohort Study
Simulation Evaluation of Surveillance Strategies
| Citation: |

|