
 Download:


-
People living with dementia (PLWD) often use multiple concurrent medications (a.k.a. polypharmacy) to treat symptoms of their comorbidities. However, polypharmacy was associated with negative health outcomes, such as adverse events, preventable and unplanned hospitalizations, frailty and impaired cognition (1-2). It was estimated that globally, the number of PLWD would increase from 57.4 million cases in 2019 to 152.8 million cases in 2050 (3). This rapid growth poses polypharmacy as a challenge to global health. Investigating variations in polypharmacy trajectories can be useful in designing interventions. Nevertheless, such investigation in PLWD is limited. We leveraged data from the Survey of Health, Ageing and Retirement in Europe (SHARE) collected from Israel and 24 European Union countries in 2015, 2017, and 2019, on 4,474 adults diagnosed with dementia. From 2015 through 2019, the percentages of polypharmacy ranged from 20.5% in Estonia to 84.6% in Cyprus among PLWD. After accounting for differences in sociodemographic characteristics, we found that the percentages of polypharmacy showed significantly increasing trends in Switzerland, Poland, Austria, and the Czech Republic, but significantly decreasing trends in Spain, Estonia, Denmark, Bulgaria, and the Netherlands. Therefore, public health planning efforts should pay attention to controlling polypharmacy among PLWD, especially in countries where the trend of polypharmacy has been rising.
The SHARE is a biennial social science, health, and multi-nationally individual survey of adults aged ≥50. Participants were interviewed by trained personnel. Interview questions included socio-demographic characteristics and health status. Detailed descriptions of the data, sampling methods and quality control procedures have been reported elsewhere (4). In this analysis, we used waves 6–8 of SHARE, because of the available information on the medications. The total sample sizes for sampled adults in each wave of SHARE were as follows: Wave 6 (2015, 72,660), Wave 7 (2017, 81,292), and Wave 8 (2019, 46,733), with a retention rate of approximately 80% in each country that was covered.
We only included those who once were diagnosed with dementia, determined by the following question, “Has a doctor ever told you that you had/currently have Alzheimer’s disease, dementia, organic brain syndrome, senility, or any other serious memory impairment.” SHARE also collected the total number of medications prescribed for their diseases. There is no single agreed definition of polypharmacy (1). Respondents were coded as having polypharmacy (=yes) if they took at least five medications (5-6).
Data were analyzed separately for each country. This made within-country comparisons robust to any cross-country differences. To estimate the temporal trend of the probability of polypharmacy, we fitted the data to country-specific logistic regression models (one model per country). We made polypharmacy (binary variable) the dependent variable and survey year (continuous variable) the critical predictor, controlling for age, sex, education, marital status, and wealth status. Survey weights were applied to account for sampling design (including the unequal probabilities of selection, clustering, and stratification) and generate representative estimates. The weight values were provided by SHARE (7). All the analyses were done by R (version 4.1.0, R Development Core Team, Vienna, Austria). The threshold for statistical significance was P<0.05.
Overall, 4,474 participants from 25 countries having at one time been diagnosed with dementia were included in the data for 2015, 2017, and 2019 (Table 1). The overall percentage of people having polypharmacy during 2015 and 2019 varied substantially between countries, with the lowest rate being in Estonia [20.5%, 95% confidence interval (CI): 7.9%, 43.9%] and highest rate being in Cyprus (84.6%, 95% CI: 64.9%, 94.3%) (Figure 1). After controlling for age, sex, marital status, education years, and wealth status, the probability of having polypharmacy had no significant trend in 16 of 25 countries, but increasing trends in Switzerland [adjusted odds ratio (AOR) 1.57, 95% CI: 1.01, 2.42], Poland (AOR 1.49, 95% CI: 1.12, 1.98), Austria (AOR 1.3, 95% CI: 1.04, 1.63), and Czech Republic (AOR 1.3, 95% CI: 1.01, 1.69), and decreasing trends in Spain (AOR 0.85, 95% CI: 0.72, 0.99), Estonia (AOR 0.72, 95% CI: 0.53, 0.99), Denmark (AOR 0.58, 95% CI: 0.34, 1.00), Bulgaria (AOR 0.33, 95% CI: 0.13, 0.84), and the Netherlands (AOR 0.15, 95% CI: 0.04, 0.61) (Figure 2B).
Country Study period N Age
Mean (SD)Female
n (%)Marital status*
n (%)Education years
Mean (SD)Wealth status, n (%) Proxy†
n (%)Lowest 20% quartile 2 3 4 Highest 20% quartile Don’t know Austria 2015–2019 302 81.10 (9.20) 175 (57.9%) 138 (45.7%) 8.97 (4.48) 70 (23.2%) 63 (20.9%) 51 (16.9%) 48 (15.9%) 31 (10.3%) 39 (12.9%) 103 (34.1%) Belgium 2015–2019 265 80.73 (9.96) 158 (59.6%) 164 (61.9%) 10.97 (3.64) 43 (16.2%) 61 (23.0%) 30 (11.3%) 31(11.7%) 15 (5.7%) 85 (32.1%) 143 (54.0%) Bulgaria 2017–2019 44 78.27 (8.52) 28 (63.6%) 16 (36.4%) 8.73 (3.69) 20 (45.5%) 7 (15.9%) 9 (20.5%) 5 (11.4%) 2 (4.5%) 1 (2.3%) 13 (29.5%) Croatia 2015–2019 93 75.74 (10.13) 61 (65.6%) 51 (54.8%) 7.49 (4.04) 29 (31.2%) 19 (20.4%) 13 (14.0%) 16 (17.2%) 12 (12.9%) 4 (4.3%) 51 (54.8%) Cyprus 2017–2019 55 81.13 (8.70) 35 (63.6%) 35 (63.6%) 6.95 (3.66) 21 (38.2%) 15 (27.3%) 8 (14.5%) 4 (7.3%) 6 (10.9%) 1 (1.8%) 12 (21.8%) Czech Republic 2015–2019 252 78.49 (8.54) 146 (57.9%) 143 (56.7%) 11.61 (3.28) 64 (25.4%) 54 (21.4%) 57 (22.6%) 38 (15.1%) 21 (8.3%) 18 (7.1%) 115 (45.6%) Denmark 2015–2019 78 80.81 (7.57) 42 (53.8%) 41 (52.6%) 12.33 (3.98) 15 (19.2%) 12 (15.4%) 12 (15.4%) 5 (6.4%) 4 (5.1%) 30 (38.5%) 43 (55.1%) Estonia 2015–2019 281 78.49 (9.62) 168 (59.8%) 140 (49.8%) 10.10 (3.79) 63 (22.4%) 67 (23.8%) 63 (22.4%) 45 (16.0%) 16 (5.7%) 27 (9.6%) 117 (41.6%) Finland 2017–2019 57 78.77 (7.08) 32 (56.1%) 43 (75.4%) 8.68 (3.30) 19 (33.3%) 10 (17.5%) 11 (19.3%) 8 (14.0%) 6 (10.5%) 3 (5.3%) 19 (33.3%) France 2015–2019 172 83.81 (8.23) 110 (64.0%) 83 (48.3%) 9.56 (3.92) 44 (25.6%) 37 (21.5%) 11 (6.4%) 21 (12.2%) 13 (7.6%) 46 (26.7%) 116 (67.4%) Germany 2015–2019 211 78.50 (9.68) 97 (46.0%) 132 (62.6%) 11.82 (3.65) 55 (26.1%) 52 (24.6%) 33 (15.6%) 32 (15.2%) 18 (8.5%) 21 (10.0%) 104 (49.3%) Greece 2015–2019 224 81.90 (6.99) 153 (68.3%) 117 (52.2%) 7.08 (4.34) 72 (32.1%) 54 (24.1%) 31 (13.8%) 33 (14.7%) 33 (14.7%) 1 (0.4%) 123 (54.9%) Hungary 2017–2019 44 75.45 (8.60) 23 (52.3%) 21 (47.7%) 10.39 (3.58) 10 (22.7%) 11 (25.0%) 11 (25.0%) 5 (11.4%) 5 (11.4%) 2 (4.5%) 14 (31.8%) Israel 2015–2019 256 81.61 (8.58) 160 (62.5%) 120 (46.9%) 10.27 (4.62) 70 (27.3%) 65 (25.4%) 53 (20.7%) 32 (12.5%) 16 (6.2%) 20 (7.8%) 189 (73.8%) Italy 2015–2019 265 80.32 (8.89) 165 (62.3%) 139 (52.5%) 6.13 (4.12) 81 (30.6%) 52 (19.6%) 63 (23.8%) 28 (10.6%) 20 (7.5%) 21 (7.9%) 175 (66.0%) Lithuania 2017–2019 81 75.86 (9.60) 54 (66.7%) 40 (49.4%) 8.31 (4.76) 18 (22.2%) 22 (27.2%) 23 (28.4%) 14 (17.3%) 3 (3.7%) 1 (1.2%) 20 (24.7%) Luxembourg 2015–2019 98 76.67 (10.33) 50 (51.0%) 67 (68.4%) 10.28 (3.87) 22 (22.4%) 18 (18.4%) 17 (17.3%) 8 (8.2%) 12 (12.2%) 21 (21.4%) 42 (42.9%) The Netherlands 2015–2019 90 76.33 (9.38) 48 (53.3%) 40 (44.4%) 10.26 (4.55) 21 (23.3%) 9 (10.0%) 10 (11.1%) 6 (6.7%) 3 (3.3%) 41 (45.6%) 50 (55.6%) Poland 2015–2019 199 79.32 (9.76) 118 (59.3%) 101 (50.8%) 7.95 (3.09) 57 (28.6%) 34 (17.1%) 37 (18.6%) 29 (14.6%) 39 (19.6%) 3 (1.5%) 80 (40.2%) Portugal 2015–2017 102 76.19 (8.67) 70 (68.6%) 74 (72.5%) 5.17 (3.44) 18 (17.6%) 18 (17.6%) 24 (23.5%) 18 (17.6%) 14 (13.7%) 10 (9.8%) 70 (68.6%) Romania 2017–2019 37 77.38 (8.44) 21 (56.8%) 18 (48.6%) 6.68 (3.49) 10 (27.0%) 8 (21.6%) 8 (21.6%) 7 (18.9%) 4 (10.8%) NA 14 (37.8%) Slovenia 2015–2019 357 78.21 (8.89) 208 (58.3%) 219 (61.3%) 8.66 (3.18) 112 (31.4%) 74 (20.7%) 65 (18.2%) 44 (12.3%) 37 (10.4%) 25 (7.0%) 146 (40.9%) Spain 2015–2019 624 83.23 (8.02) 399 (63.9%) 325 (52.1%) 6.30 (4.57) 155 (24.8%) 156 (25.0%) 84 (13.5%) 94 (15.1%) 56 (9.0%) 79 (12.7%) 435 (69.7%) Sweden 2015–2019 210 80.45 (8.72) 112 (53.3%) 128 (61.0%) 10.10 (4.08) 48 (22.9%) 49 (23.3%) 35 (16.7%) 20 (9.5%) 9 (4.3%) 49 (23.3%) 91 (43.3%) Switzerland 2015–2019 77 78.92 (10.00) 43 (55.8%) 45 (58.4%) 8.43 (5.43) 14 (18.2%) 12 (15.6%) 12 (15.6%) 9 (11.7%) 11 (14.3%) 19 (24.7%) 37 (48.1%) Note: Statistics for categorical variables are reported in numbers (percentage), and those for continuous variables are reported in mean (SD). The quartiles of wealth status were generated based on all samples in each country, including people with or without dementia.
* Marital status means married, cohabiting or civil partnership.
† Proxy means proxy report.
Abbreviation: NA=not applicable; SD=standard deviations.Table 1. Summary statistics of people living with dementia across Israel and 24 European Union countries.
 Figure 1.
Pooled percentage of polypharmacy among people living with dementia across Israel and 24 European Union countries between 2015 and 2019.
Note: Points and horizontal lines show the percentages of polypharmacy and their 95% confidence intervals, respectively. The percentage was estimated by country by year, and then pooled by meta-analysis for each country. Survey weights were used to estimate the percentages and their 95% confidence intervals.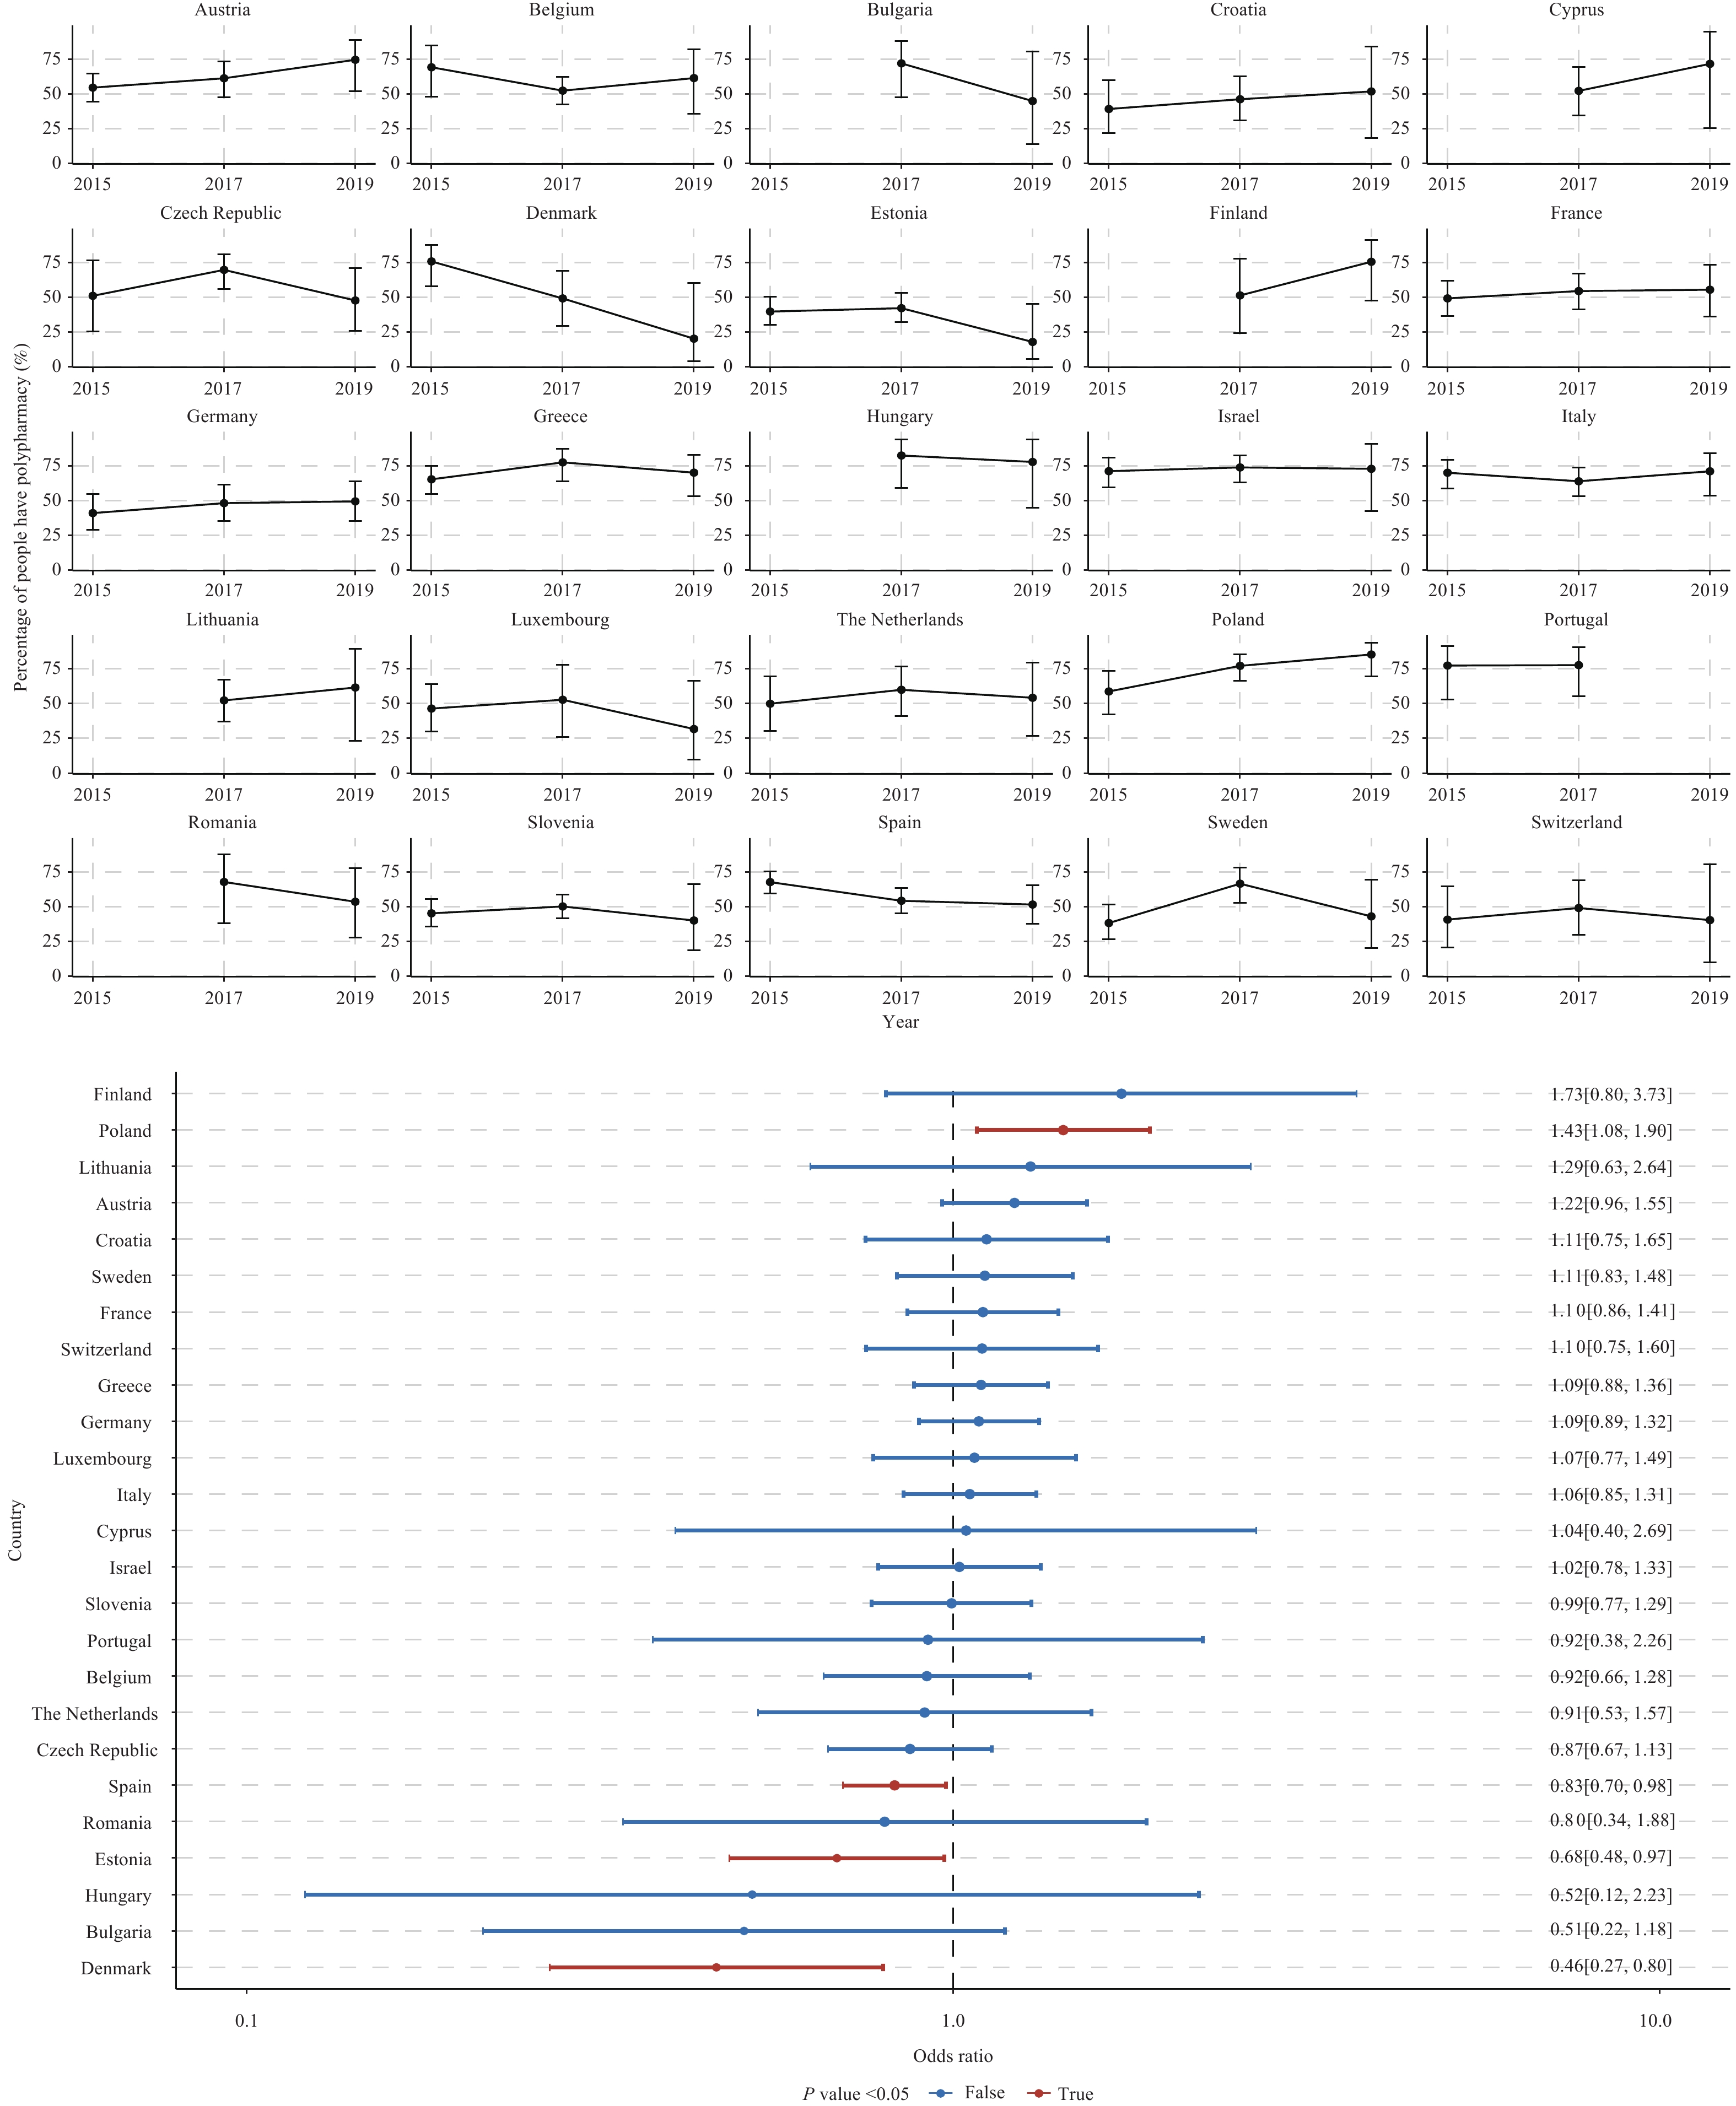 Figure 2.
Time trend for percentage of polypharmacy among people living with dementia across Israel and 24 European Union countries during the study period. (A) Percentage of polypharmacy by country by year; (B) Adjusted odds ratios and their 95% confidence intervals of year.
Note: Panel A presents the percentages of polypharmacy and their 95% confidence intervals by country by year. Panel B presents the adjusted odds ratios and their confidence intervals, which were extracted from country-specific weighted logistic regression models (one model per country), with polypharmacy (binary variable) being the dependent variable and survey year (continuous variable) being the key predictor, controlling for age, sex, marital status, education, wealth status, and proxy. -
From 2015–2019, the percentage of PLWD having polypharmacy varied substantially among Israel and 24 European Union countries, with approximately 1 in 5 Estonian PLWD and 4 in 5 Cypriot PLWD having polypharmacy. In addition, this percentage showed significantly higher trends in 4/25 of the countries studied. The findings of this study call attention to the endangering impact of polypharmacy (e.g., frailty, and impaired cognition). They also reinforce the importance of efforts to control polypharmacy among PLWD, especially in countries with increasing trends. The high percentage and the increasing trend of polypharmacy we identified are consistent with previous studies. A cross-sectional study of older adults in Denmark indicated that 62.6% of PLWD had polypharmacy in 2014 (8). While, a prospective cohort study of women with dementia in Australia showed that the prevalence of polypharmacy increased from 57.7% in 2003 to 71.2% in 2014 (5). The increasing comorbidity and long-term treatments may contribute to the rising prevalence of polypharmacy among PLWD (6). Compared to people without dementia, adverse health outcomes of polypharmacy may be worse for PLWD. Typical dementia symptoms such as memory loss and language problems may prevent the early detection of adverse drug events, leading to more severe complications and subsequent hospitalizations (2). Therefore, it is essential to deprescribe inappropriate medications among PLWD with polypharmacy. Medication review (e.g., the implementation of a routine medication management review system in Australia) and increasing the awareness of potentially inappropriate medicine use in the older population (e.g., the introduction of the red-yellow-green list, a list of potentially inappropriate medications tailored toward use, in Denmark) could be helpful to slow or even reverse such increasing trends (5-6).
The percentage and the time trend of polypharmacy varied substantially among studied countries. The disparities in the health system (e.g., whether the health system covers medicines for dementia and other chronic conditions) could influence the number of medications patients take. For instance, the relatively lower percentage of polypharmacy in Estonia is consistent with a study conducted in the UK, which estimated 22.3% of polypharmacy in 2010 (9). However, we cannot exclude the possibility of underutilizing corresponding services among the Estonian elderly, as revealed by a previous study (10). Future studies are needed to explore the possible reasons for the substantial cross-country variation identified in our report by further considering the differences in the health systems, differences like the availability, accessibility, and affordability of related resources. A study conducted in Denmark also found an inconsistency in the time trend of polypharmacy. It indicated that after the initiative of increasing the awareness of potentially inappropriate medicine use in 2011, no significant time trend of polypharmacy was found between 2011 and 2014, compared to an increasing trend between 2000 and 2010 (6). Future studies involving the interventions (e.g., policy evaluations and scoping reviews) on polypharmacy are also needed.
This report possesses the following strengths. First, this is the first multi-country study to investigate the polypharmacy trajectory among PLWD, enriching our limited understanding of this global health challenge. Second, the measurement of polypharmacy was consistent among countries, which enhanced the reliability of the variations identified in this report.
However, this report is subject to at least three limitations. First, polypharmacy may not be problematic if medications are reasonably prescribed. The distinction between appropriate and problematic polypharmacy is critical for PLWD who may be taking anti-dementia medications, because other medications may play a necessary role in reducing the progression or suppressing the symptoms of dementia. Future studies are recommended to evaluate problematic polypharmacy due to pharmacological inappropriateness such as drug-drug interactions. Second, SHARE has no information on the types of medications (e.g., anti-dementia or antidepressants), which prevented us from exploring the trends in the composition of polypharmacy. Third, some countries’ studies have apparent trends when only looking at point estimations in Figure 2, but no such significant odd ratios due to wide confidence intervals. These could be due to the potentially insufficient observations when studying dementia patients in each SHARE-covered nation. For instance, Luxembourg looks to be increasing but only had 98 participants in total. Although our primary findings on the high percentage and the increasing trend of polypharmacy we identified are consistent with previous studies as discussed above. Country-specific studies with more observations are needed.
In summary, future public health efforts must pay special attention to polypharmacy among PLWD. In countries with a higher prevalence of polypharmacy, healthcare providers should be aware of it when interacting with PLWD. They should also inform patients and their caregivers of the adverse effects of concurrent medications. Among countries with an increasing trend of polypharmacy, interventions and policies that promote medication review and awareness of potentially inappropriate medicine use should be considered.
-
The teams of Survey of Health, Ageing and Retirement in Europe (SHARE) for their efforts in data collection and for making the data publicly available; and Anqi Xu (School of Modern Languages and Cultures, University of Nottingham) for her valuable help in language polish.
-
No conflicts of interest.
HTML
| Citation: |

|