
 Download:


-
The ability to maintain or improve physical fitness has been demonstrated to be associated with an improved quality of life and reduced all-cause and cardiovascular disease mortality (1). However, physical fitness has declined steadily among Chinese adults over the past two decades (2). A study conducted among adult males in the United States showed that many lifestyle habits, such as sedentary lifestyle and smoking habit, are associated with changes in physical fitness. Additionally, physical activity is likely one of the important factors to explain physical fitness change (1). While there is evidence to support the connection between quality of life and physical fitness, in China, the studies on the association between physical fitness and physical activity have mostly focused on child and adolescent populations (3-4). Few studies have investigated the connection in adult populations, particularly the association between different levels of physical fitness and physical activity. This study aims to explore the association between different levels of physical fitness and physical activity in adults over the age of 40 in Beijing, China.
Data were drawn from the Survey on Physical Activity and Healthy Behavior of Middle-aged and Older Adults, a community-based cross-sectional study conducted from October 2020 to January 2021 in Beijing, China. The sample was selected using judgment sampling from middle-aged adults and older residents from six communities in Yanyuan Subdistrict and Dahongmen Subdistrict to promote sampling diversity. In total, 1,319 participants who met the age criteria (between 40 and 79 years old) and were functionally independent in activities of daily living (ADL) were recruited for the study. The survey was guided by a structured questionnaire and used interviews conducted by trained staff to ensure consistent quality. Among the entire sample population, 308 individuals were randomly selected to complete the physical fitness tests and were ultimately the subjects for this study. This study was approved by the Ethics Committee at the School of Psychological and Cognitive Sciences, Peking University (protocol number#2019-08-04).
The survey collected basic sociodemographic characteristics (gender, age, education, marital status, living arrangement, and monthly personal income), health risk behaviors (smoking and alcohol consumption), and chronic disease status (with or without chronic diseases). The physical activity data were collected using the International Physical Activity Questionnaire-Long Form (IPAQ-LF), including leisure-time, occupational, transport-related, and domestic physical activity. Physical fitness was measured by trained staff using the same equipment in accordance with the methods and procedures specified in the Manual of Standards for National Physical Fitness Measurement (5-6). The test items for adults aged 40 to 59 years included weight-for-height (WH, an assessment of body shape), forced vital capacity (FVC, an assessment of pulmonary function), step-test index (STI, an assessment of cardiorespiratory fitness), hand grip strength (HGS, an assessment of muscular strength), sit-and-reach (SR, an assessment of flexibility), choice reaction time (CRT, an assessment of psychomotor speed), and standing on one leg with eyes closed test (SOL, an assessment of balance). Each item stated above was scored according to the corresponding range from 1 to 5 (6). Different from the middle-aged adults, the measurement for the older adults (aged 60 years and older) included six test items, excluding the STI (5).
The scores from all the test items were aggregated to a composite physical fitness indicator (PFI) score which was then classified into 3 levels — excellent (score >26 for adults ages 40 to 59; score >23 for adults over 60), good (24≤score≤26 for adults ages 40 to 59; 21≤score≤23 for adults over 60), and poor (score <24 for adults ages 40 to 59; score <21 for adults over 60), according to the Manual of Standards for National Physical Fitness Measurement (5-6). Participants were categorized as middle-aged adults (aged between 40 and 59 years) and older adults (aged 60 years and older). Subjects were also categorized by education level into three groups — low (without high school diploma), middle (high school diploma), and high (high school diploma and some college). Subjects were then categorized by monthly personal income into three levels — lower than 3,000 CNY, 3,000–6,000 CNY, and higher than 6,000 CNY. The results of IPAQ-LF were summarized as a continuous variable metabolic equivalents (MET)-minutes per week. The MET value was calculated by weighting each type of physical activity by its METs to yield a total score, according to guidelines for data processing and analysis of the IPAQ (7). A density plot was used to depict the distribution of PFI by subgroup including age group, gender, educational attainment, and monthly personal income. A radar chart was then used to show the mean score of each test item among the two age groups. The random forest algorithm was used to identify and validate the most influential correlations for physical fitness (8). The random forest feature importance scores used were based on the mean decrease of the Gini index to rank these correlations. Lastly, the quantile regression model was used to analyze the association between the different levels of physical fitness and physical activity and was adjusted for possible confounding variables obtained by the random forest algorithm. Considering the large range of MET, physical activity was log-transformed (with a base of 2, written as logPA) before performing the regression analysis. All P-values <0.05 were considered statistically significant. All analyses were performed using R software (version 4.0.2, R Development Core Team, Vienna, Austria).
The PFI distribution of the middle-aged population appeared shifted to the right of the elderly population distribution, indicating that overall PFI among the middle-aged population was higher than among the older adult population in this study. Similarly, overall PFI was higher among females, people with higher education, and people with higher incomes (Figure 1).
 Figure 1.
Distribution of PFI by (A) age group, (B) gender, (C) education level, and (D) monthly personal income.
Note: Scores from all test items of physical fitness are aggregated to form a summary PFI.
Abbreviation: PFI=physical fitness indicator.
As shown in the radar charts, overall, the group with higher PFIs performed better than the group with lower PFIs on all components of physical fitness among both the middle-aged and elderly populations. All the middle-aged adults across the three groups of PFI (excellent, good, and poor) had the best performance in WH among seven components of physical fitness. The poor group of PFI got the lowest mean score on the STI. Overall, the older adults across the three groups of PFI had better performance on WH and CRT among the six components of physical fitness measured. The performance of the poor group of PFI was relatively balanced in six components of physical fitness among the elderly (Figure 2).
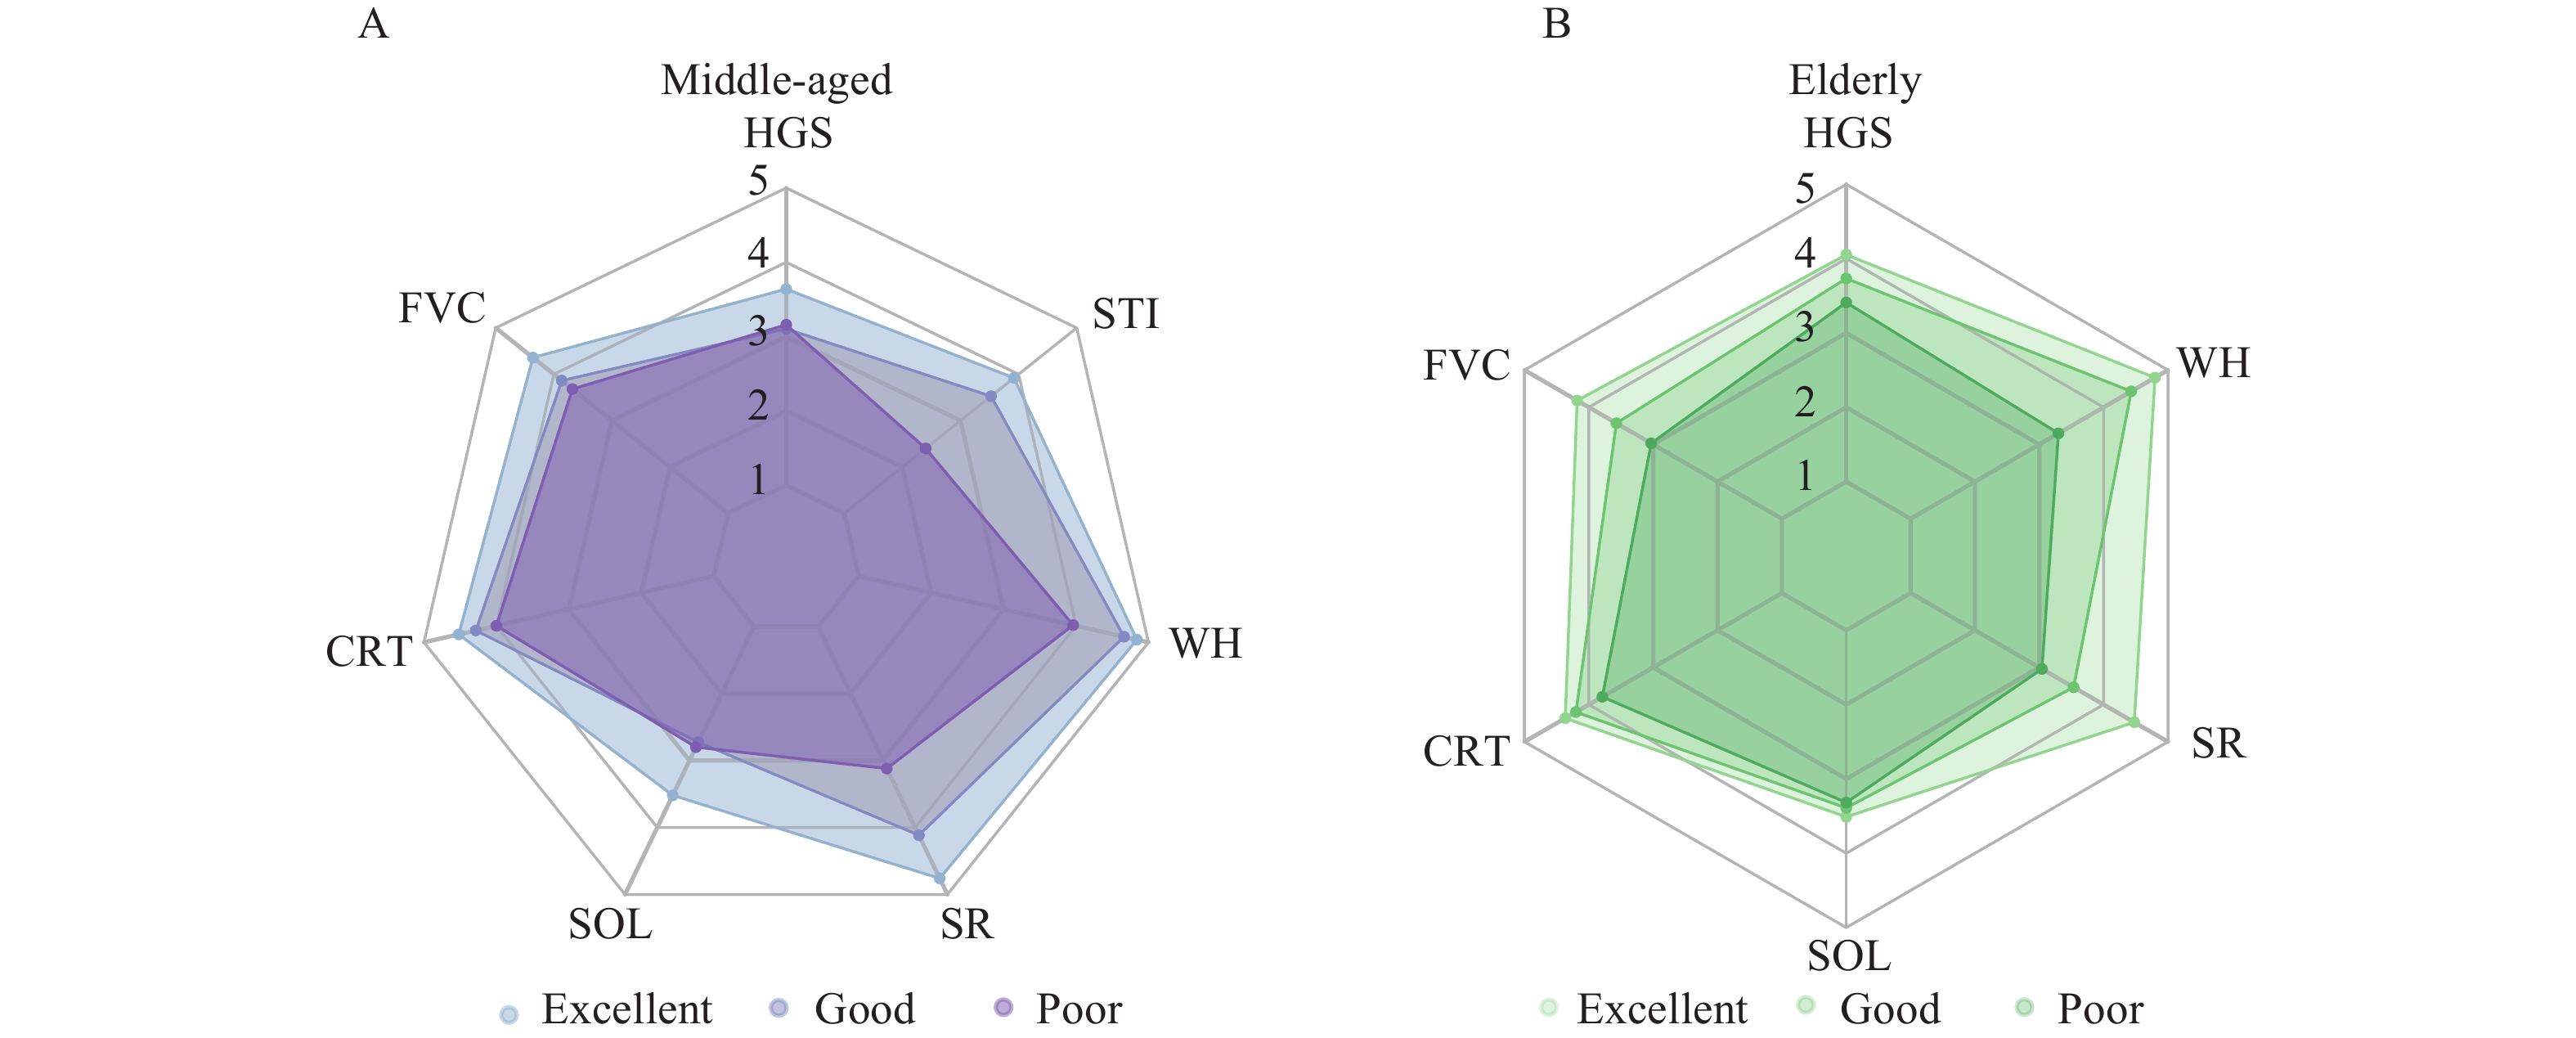 Figure 2.
Radar chart of mean score of every test item by group of PFI among (A) middle-aged adults and (B) the elderly.
Abbreviation: PFI=physical fitness indicator; WH=weight-for-height; FVC=forced vital capacity; STI=step-test index; HGS=hand grip strength; SR=sit-and-reach; CRT=choice reaction time; SOL=standing on one leg with eyes closed test.As shown in the variable importance plot of correlations for physical fitness, the most important correlation for all groups was physical activity (importance score: 0.27), followed by education level (0.15), monthly personal income (0.13), living arrangement (0.08), chronic disease status (0.08), and age (0.08) (Figure 3).
 Figure 3.
Variable importance plots of correlations for physical fitness based on the random forest algorithm.
After adjusting for educational level, monthly personal income, living arrangement, chronic disease status, and age, the coefficient of logPA in the quantile regression model at the 25th percentile was 1.14 [95% confidence interval (CI): 0.57 to 1.31, P<0.001], indicating that PFI increased by 1.14 per 100% increase in physical activity. Absence of multicollinearity between these variables was confirmed by testing variance inflation factors. The coefficients of logPA in the models at the 50th, 75th, and 90th percentile were 1.04 (95% CI: 0.53 to 1.46, P<0.01), 0.89 (95% CI: 0.40 to 1.30, P<0.05), and 0.84 (95% CI: 0.61 to 1.25, P<0.05), respectively (Figure 4).
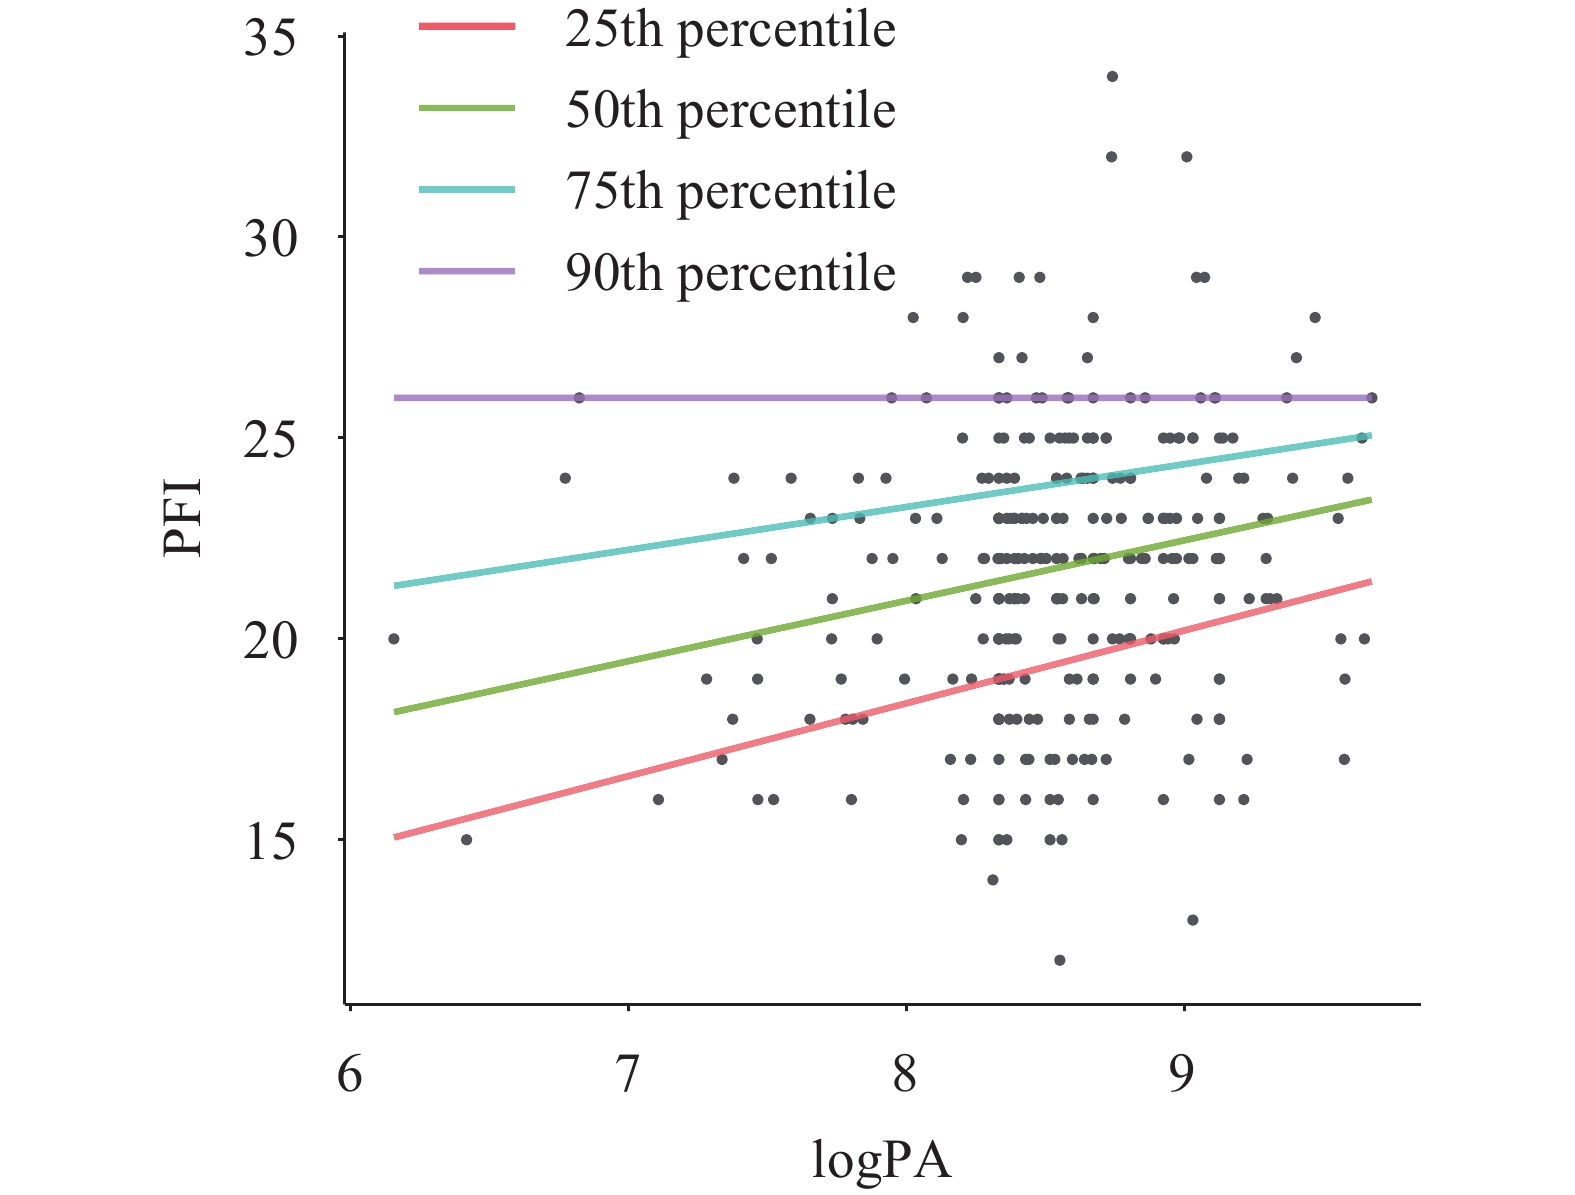 Figure 4.
Trends of PFI at different percentiles with logPA.
Note: All results from the International Physical Activity Questionnaire-Long Form (IPAQ-LF) were summarized as a continuous variable, MET-minutes per week, which is used to represent physical activity level. Physical activity level was log-transformed (with a base of 2, written as logPA).
Abbreviation: PFI=physical fitness indicator; MET=metabolic equivalents.
-
To our knowledge, this is the first study to explore the association between physical activity and different levels of physical fitness among adults in China. This community-based study found a positive association between physical fitness and physical activity, especially in populations with lower levels of physical fitness. This positive association was also found in a study among older adults in Shaanxi Province, China (9). Stronger associations among adults of low physical fitness suggest that interventions to promote physical activity in the population with a low level of physical fitness may have greater health benefits. Future studies may need to further validate the differences in the association between different levels of physical fitness and physical activity among different populations based on prospective cohort studies in a large sample.
The findings from this study also showed that physical activity was the most important predictor for physical fitness, which was consistent with the previous study (1). In addition to physical activity, the results showed that education level and personal income were also important predictors for physical fitness. One meta-analysis showed that there was an association between physical fitness and educational levels, with higher levels of education associated with increased physical fitness (10). A study among workers aged 20 to 65 years in Tokyo suggested that those with higher socioeconomic status were more likely to have favorable physical fitness (11). The results of this study further contribute to these findings. This study also found that almost all indicators of physical fitness among people with lower PFI were worse than those among people with higher PFI. Two possible explanations for this finding are that 1) most types of exercise improve more than one type of physical fitness, for example, running improves both cardiorespiratory fitness and muscle strength; and 2) people with high physical fitness are more likely to engage in multiple forms of physical activity.
Given the association between physical fitness and physical activity, physical fitness can be improved by promoting physical activity among middle-aged and elderly adults. Since physical fitness declines with age, adults over 40 tend to be less physically active. However, physical activity improves physical fitness, so ways to promote physical activity in this older age group should be explored (12). Research shows that a lack of physical activity space is the most important non-human factor for physical inactivity in adults (13). Therefore, governments should promote the construction of sports grounds and public sports services for middle-aged and elderly adults within communities. In addition, more school and public sports venues should be open to residents under certain conditions.
The strengths of this study were the use of the IPAQ to obtain comprehensive physical activity data and the use of national standards to measure comprehensive physical fitness. This study was also subject to some limitations. Due to limited conditions, participants were recruited without random selection, which may affect the representation of a broader middle-aged and elderly adult population. Lastly, a causal association cannot be established due to the nature of the cross-sectional study design.
This study found that physical fitness is positively associated with physical activity among middle-aged and elderly adults, especially in groups with lower levels of physical fitness. Effective measures should be implemented to promote physical activity among middle-aged and elderly adults, such as providing sufficient physical activity space, especially in areas where people have low physical fitness.
HTML
| Citation: |

|