Download:


-
Parasitic diseases are diseases threatening billions of people’s health worldwide (1). There are 14 major parasitic diseases found in China, of which the top 5 are ascariasis, hookworm, trichuriasis, clonorchiasis, and paragonimiasis: all of which are infected through helminths (2). Notably, human helminthic infections of public health importance mainly include soil-transmitted helminths (Ascaris lumbricoides, hookworm, and Trichuris trichiura) and Clonorchis sinensis, which have caused a tremendous burden of diseases (3-4). It was estimated that the prevalence rates of soil-transmitted helminths caused by Ascaris lumbricoides, Trichuris trichiura, and hookworm reached 53.6% in the early 1990s, and decreased to 19.6% in the early 2000s based on national surveys (3); these surveys also revealed that there were 12.49 million individuals infected with Clonorchis sinensis across China (4). Guangdong Province had the highest prevalence of Clonorchis sinensis across China; the standardized infection rates (SIRs) in 1990 and 2003 were 2.1% and 6.2%, respectively, while the SIR was 17.5% in the endemic area (4). Moreover, the prevalence of any soil-transmitted helminths in Guangdong Province during 2001–2004 was 9.0% (5), which was higher than in many other provinces.
Chinese governments have adopted integrated control strategies to combat parasitic infection in recent decades (
http://www.gov.cn/gzdt/2006-03/30/content_240456.htm ). Ongoing socioeconomic development; continuous improvements in living standards, clean water, and sanitation; and greater hygiene have also substantially contributed to the reduction of parasitic infections. Several studies have summarized the efforts and effectiveness of controlling parasitic infection in China (4,6-7). However, there are several research gaps in previous studies: 1) most of them were based on a single or few parasites; 2) data used in those studies were from a single or few cities; and 3) the studied time spans were narrow. For example, in a study that investigated the transmission route and epidemiological characteristics of Clonorchis sinensis infection in Shenzhen, Guangdong Province (6), Deng et al. only described the epidemic situation and prevention and control strategies in endemic areas of clonorchiasis in Guangdong Province from 1988 to 2015 (7). As a result, these studies did not systematically describe the temporal and spatial changes of major human helminth infections in China in the past few decades or comprehensively evaluate the efficacy of prevention and control strategies on parasitic infections. Understanding the spatiotemporal changes of major human helminth infections could help to identify the most affected regions and vulnerable people, as well as provide valuable information for the government to implement targeted prevention and control measures.To fill in the above research gaps, this study analyzed the survey data Guangdong Province collected during 1988–1992, 2001–2004, 2014–2016, and 2019–2021, respectively, to systematically describe the spatiotemporal changes of major human helminth infections and their epidemiological characteristics over the past 3 decades, as well as investigate the overall effectiveness of prevention and control strategies.
-
The first 3 surveys from Guangdong Province used in this study were national surveys. In each survey, a stratified cluster random sampling method was used to select the survey sites and objects (4,8). Briefly on this, Guangdong Province was first divided into 4 regions (
Supplementary Table S1 ) according to its geographical location and level of socioeconomic development. Second, all counties in each region were divided into high, medium, and low categories according to the unified economic level (per capita annual net income of farmers), and then randomly selected in each category. Each selected county was further divided into several groups according to topography, and all townships in each group were divided into high, medium, and low economic levels, which were then randomly selected. Finally, in each recruited township, survey sites (village or community) were randomly selected (Supplementary Tables S1 –S2 ). Local residents and immigrants who have lived in the area for more than 6 months were recruited, but residents who have been out of the survey sites for more than 6 months were excluded.The data used for the fourth survey from Guangdong Province were obtained from the China Information System for Disease Control and Prevention. Briefly, 10 monitoring counties were selected each year from 2019 to 2021, and 5 monitoring sites (village or community) were selected in each county (
Supplementary Tables S1 –S2 ). -
All 4 surveys used the modified Kato-Katz technique to detect the helminth (Ascaris lumbricoides, hookworm, Trichuris trichiura, and Clonorchis sinensis) eggs in collected fecal samples (8) (
Supplementary Materials , available in http://weekly.chinacdc.cn/).Meanwhile, a questionnaire was used to investigate the general information of each object. -
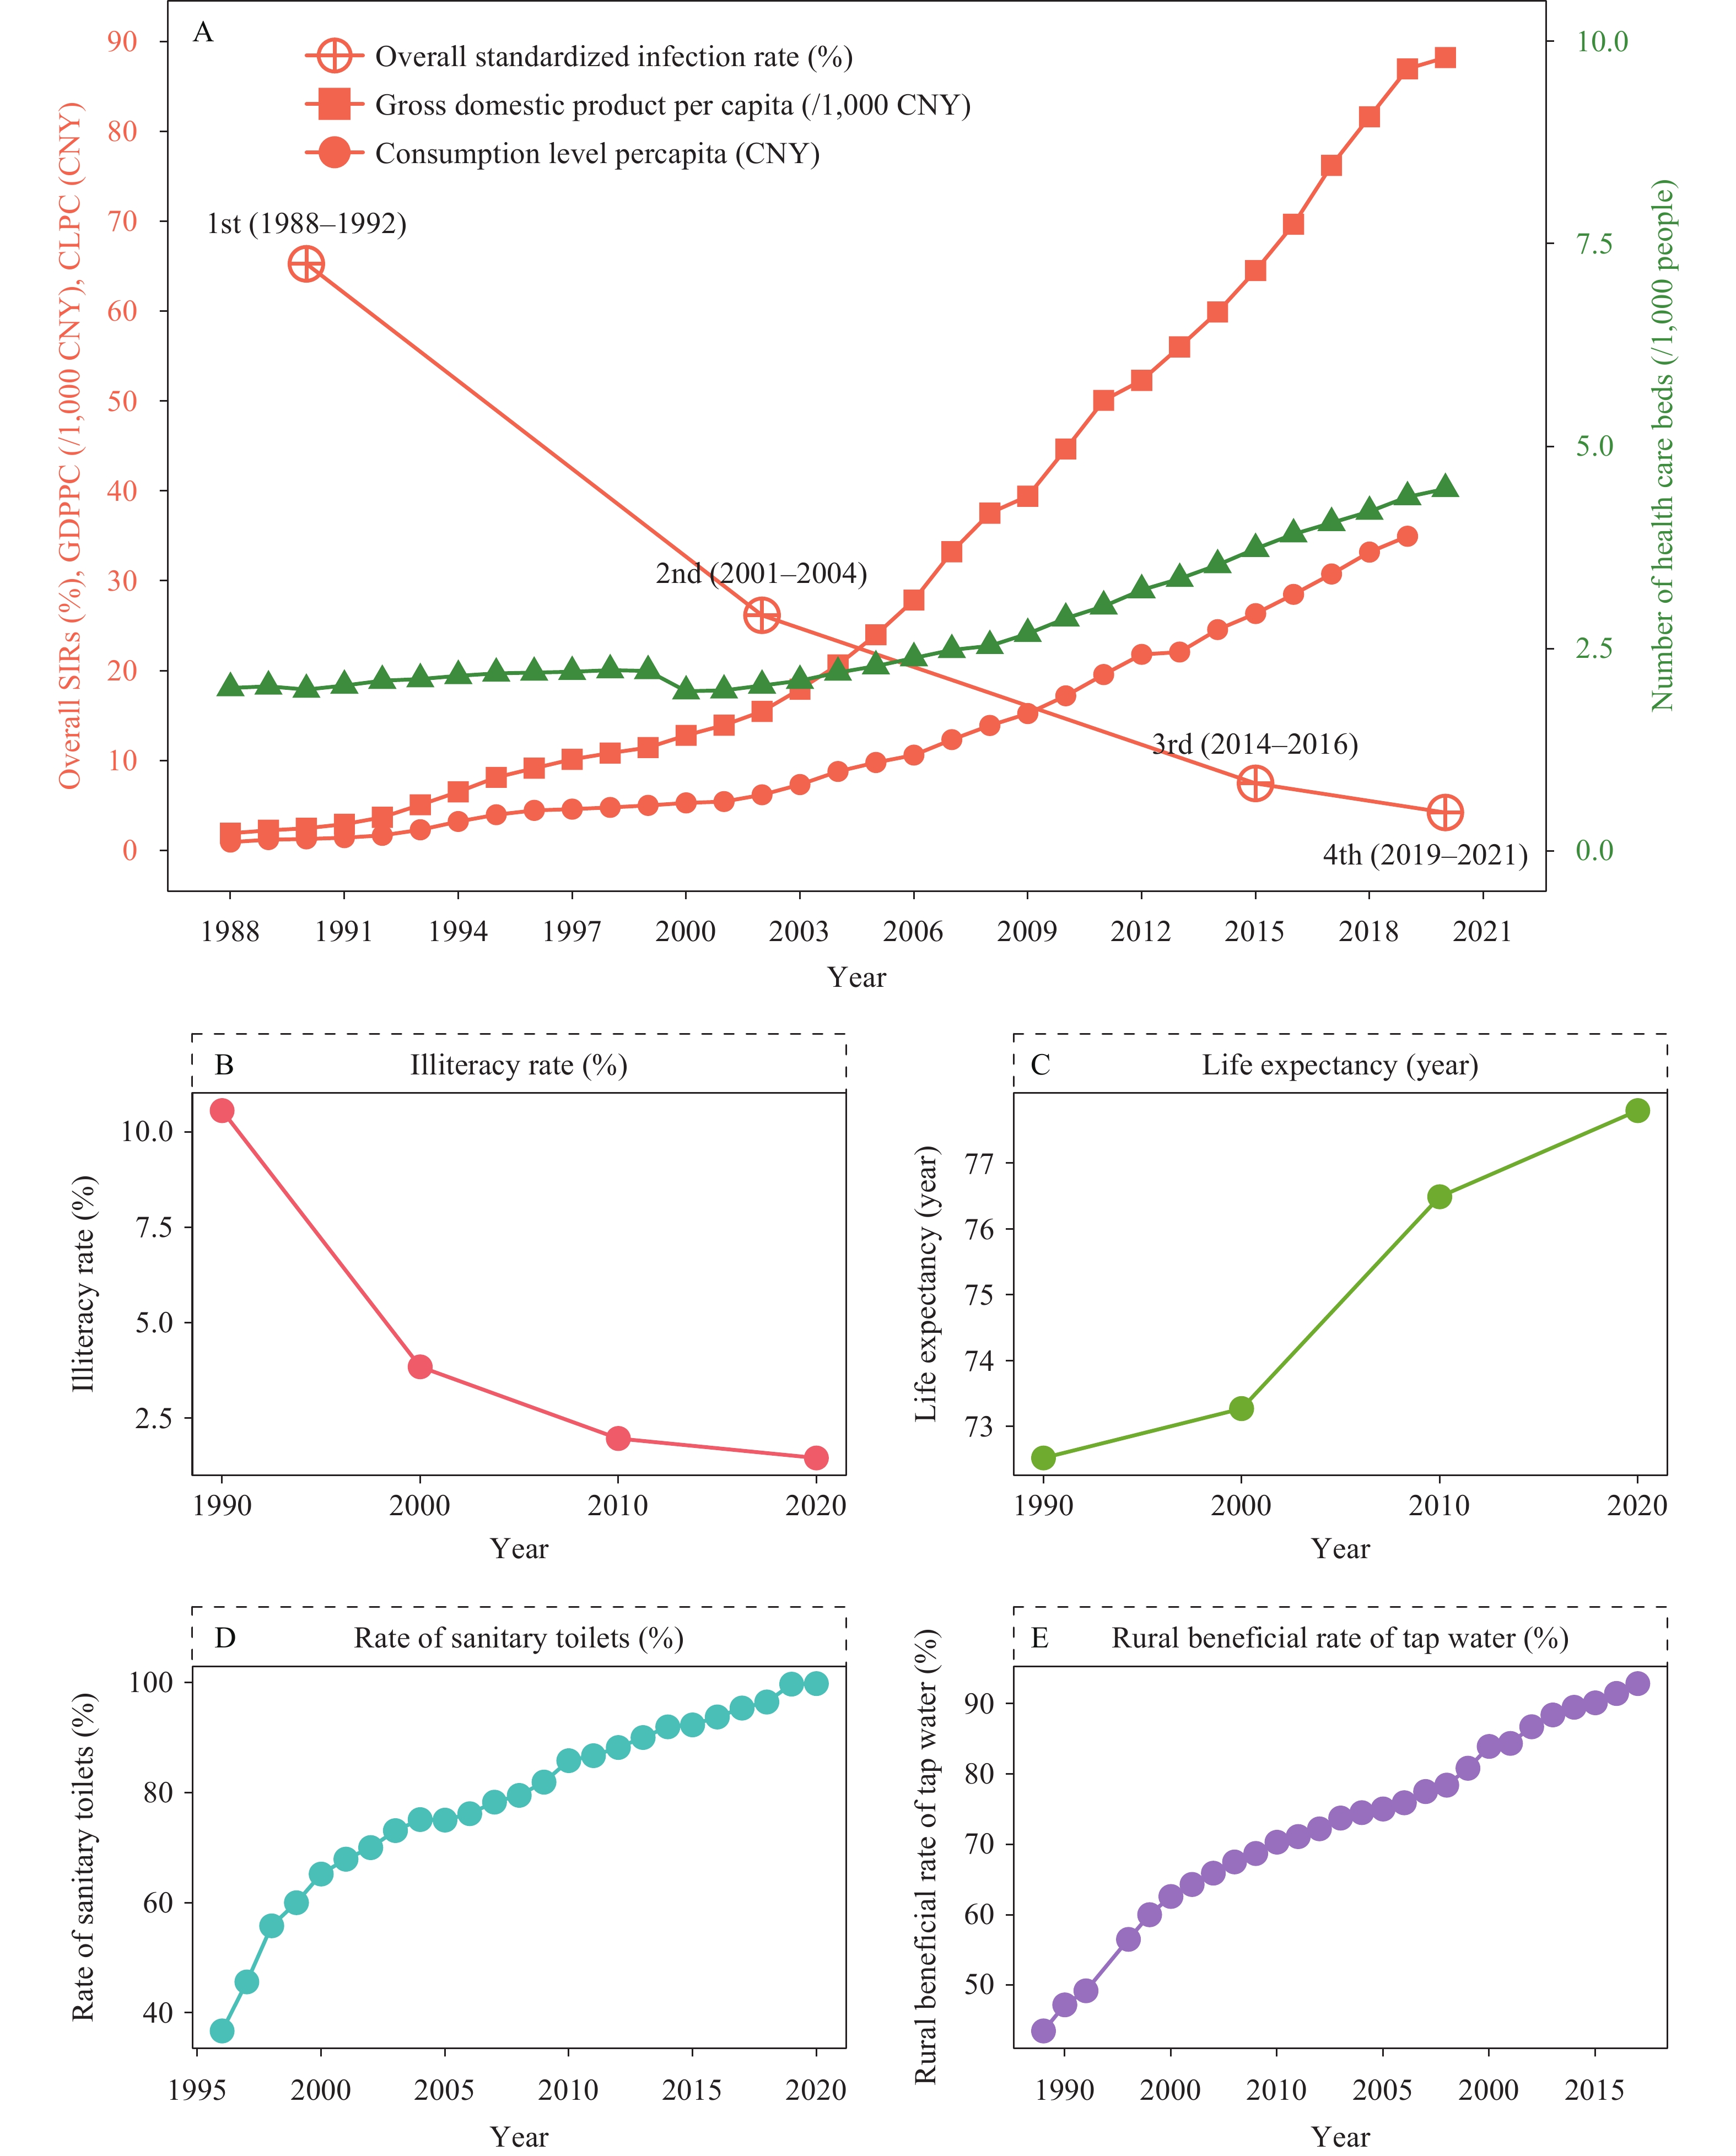
To examine the influence of socioeconomic development on parasitic infection, this study also collected several socioeconomic and health-related variables across Guangdong Province from recent decades (
Supplementary Figure S1 ). -
The crude infection rate was calculated by dividing the number of infections by the total number of people surveyed. This study further used the sixth census data (in 2010) of Guangdong Province to calculate the SIRs of helminths by gender and age, and applied the Cochran-Armitage trend test to assess time trends. The rates were compared either by Pearson’s χ2 test or Fisher’s exact test. All analyses were performed using R software (version 4.0.2, R Foundation for Statistical Computing, Vienna, Austria).
-
The surveys were approved by the Ethics Committee of both China CDC and Guangdong CDC. All surveyed persons provided their written informed consent, and all underage children obtained the informed consent of their guardians.
-
A total of 61,517, 26,363, 12,401, and 31,916 people were investigated in the 4 surveys, respectively. Out of them, the male-to-female ratios in all 4 surveys were around 1∶1. People aged below 20 years were about 40% in the 4 surveys, and people aged over 60 years were about 10%. The percentages of farmers in the 4 surveys were 51.4%, 42.0%, 35.1%, and 26.4%, respectively. In the second (2001–2004), third (2014–2016), and fourth survey (2019–2021), 85.5%, 75.3%, and 67.0% of objects had less than 10 years of education (Table 1).
Demographic characteristics No. of survey objects (n, %) χ2 P 1st (1988–1992)* 2nd (2001–2004)† 3rd (2014–2016)§ 4th (2019–2021)¶ Total 61,517 (100.0) 26,363 (100.0) 12,401 (100.0) 31,916 (100.0) − − Gender 66.36 <0.001 Male 29,004 (47.1) 13,126 (49.8) 6,165 (49.7) 15,478 (48.5) Female 32,513 (52.9) 13,237 (50.2) 6,236 (50.3) 16,438 (51.5) Age (years) 4,773.40 <0.001 <10 15,674 (25.5) 5,297 (20.1) 2,264 (18.2) 6,843 (21.4) 10– 11,926 (19.4) 5,570 (21.1) 1,704 (13.7) 4,125 (12.9) 20– 8,780 (14.3) 2,698 (10.2) 1,190 (9.6) 2,571 (8.1) 30– 9,953 (16.2) 4,491 (17.0) 1,831 (14.8) 5,395 (16.9) 40– 5,809 (9.4) 3,576 (13.6) 1,858 (15.0) 4,406 (13.8) 50– 4,683 (7.6) 2,465 (9.4) 1,656 (13.4) 3,897 (12.2) 60– 3,172 (5.2) 1,409 (5.4) 1,230 (9.9) 2,930 (9.2) 70– 1,247 (2.0) 690 (2.6) 473 (3.8) 1,357 (4.3) 80– 273 (0.4) 167 (0.6) 195 (1.6) 392 (1.2) Occupation 16,749.00 <0.001 Manual worker 2,435 (4.0) 1,147 (4.4) 920 (7.4) 2,996 (9.4) Farmer 31,640 (51.4) 11,064 (42.0) 4,353 (35.1) 8,417 (26.4) Businessman 128 (0.2) 420 (1.6) 532 (4.3) 431 (1.3) Government official and clerk 526 (0.9) 233 (0.9) 305 (2.5) 1,098 (3.4) Medical staff and teacher 145 (0.2) 490 (1.9) 319 (2.6) 1,749 (5.5) Student 13,110 (21.3) 7,830 (29.6) 2,609 (21.0) 7,360 (23.1) Preschooler 10,793 (17.5) 2,756 (10.4) 1,368 (11.0) 3,668 (11.5) Others 2,740 (4.5) 2,423 (9.2) 1,995 (16.1) 6,197 (19.4) Education (years) 3,631.60 <0.001 No formal education − 4,466 (16.9) 1,699 (13.7) 4,315 (13.5) 1–9 − 18,090 (68.6) 7,635 (61.6) 17,089 (53.5) 10–12 − 3,207 (12.2) 2,032 (16.4) 5,897 (18.5) ≥13 − 552 (2.1) 1,032 (8.3) 4,615 (14.5) Missing − 48 (0.2) 3 (0.0) 0 (0.0) *: The first survey was conducted during 1988–1992.
†: The second survey was conducted during 2001–2004.
§: The third survey was conducted during 2014–2016.
¶: The fourth survey was conducted during 2019–2021.
−: Unavailable.Table 1. General characteristics of survey objects in Guangdong Province, China.
-
The overall SIRs of soil-transmitted helminths (STH) and Clonorchis sinensis decreased from 65.27% in 1988–1992 to 26.17% in 2001–2004, 7.47% in 2014–2016, and 4.23% in 2019–2021 (P<0.001 for trend test). Of these, the SIRs of any soil-transmitted helminths decreased from 64.41% in 1988–1992 to 15.10% in 2001–2004, 2.29% in 2014–2016, and 0.31% in 2019–2021 (P<0.001 for trend test). However, the SIRs of Clonorchis sinensis increased from 2.40% in the first survey to 12.17% in the second survey, then decreased to 5.20% in the third survey and 3.93% in the fourth survey (P<0.001 for trend test) (Figure 1). Further, among the infected objects in 4 surveys, infection of single worm species was dominant, accounting for 57.73%, 87.10%, 98.99%, and 99.58%, respectively, followed by coinfection with two worm species (33.55%, 12.14%, 1.01%, and 0.42%) (
Supplementary Table S3 ).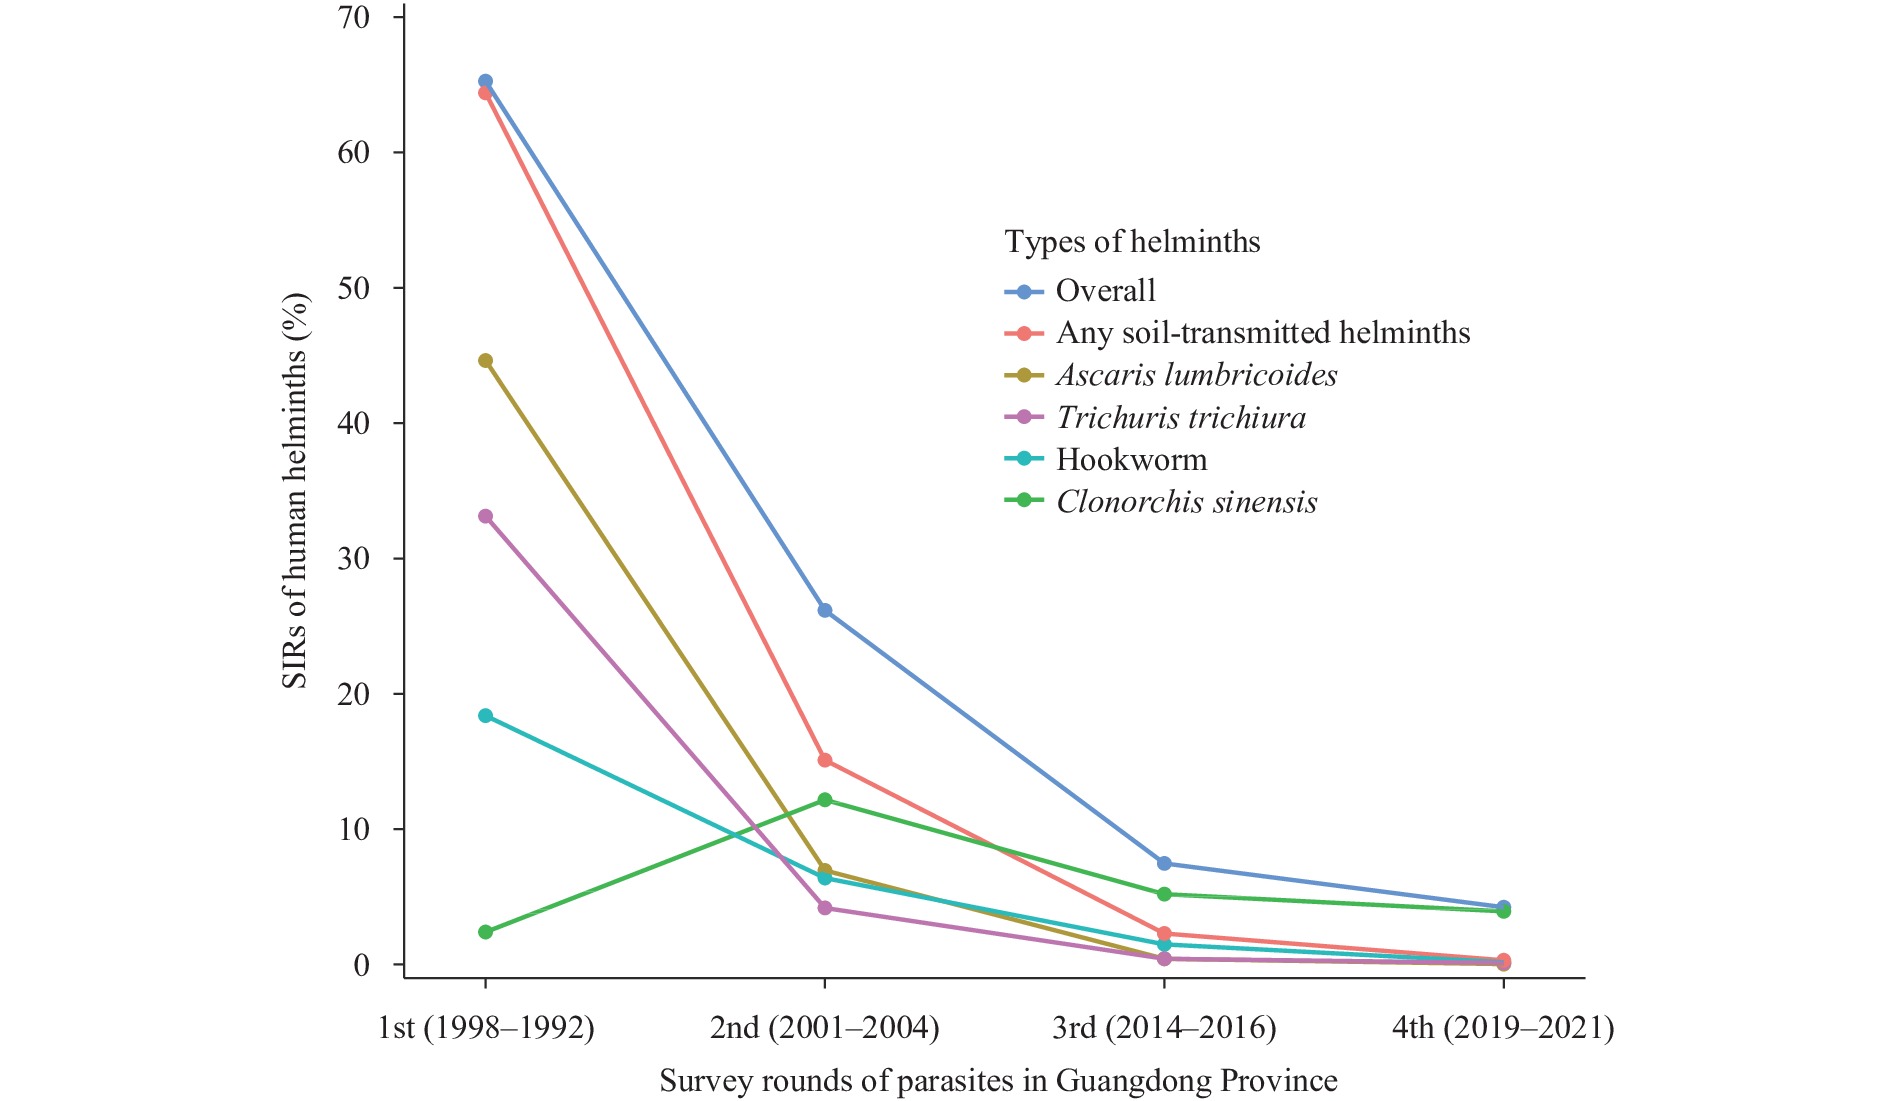 Figure 1.
SIRs of human helminths in the four surveys in Guangdong Province, China.
Note: Any soil-transmitted helminths: Infected with at least one of Ascaris lumbricoides, hookworm, and Trichuris trichiura. 1st (1998–1992): The first survey was conducted during 1988–1992. 2nd (2001–2004): The second survey was conducted during 2001–2004. 3rd (2014–2016): The third survey was conducted during 2014–2016. 4th (2019–2021): The fourth survey was conducted during 2019–2021.
Abbreviation: SIRs=standardized infection rates.
In all 4 surveys, there were differences in the spatial distribution of the overall SIRs of major human helminths (P<0.001). The first survey showed higher SIRs of helminths, particularly of STH, in eastern regions such as Chaozhou (88.05%) and Shantou (84.29%) cities. The SIR of Clonorchis sinensis also largely varied across cities (P<0.001), with higher rates in Foshan (16.37%) and Guangzhou (7.49%) cities, and lower rates in cities such as Maoming (0.00%), Shanwei (0.00%), and Zhanjiang (0.00%). The second survey showed higher overall SIRs in some cities, including Foshan (55.58%), and Zhongshan (55.50%). The SIRs of Clonorchis sinensis were also higher in Foshan (50.04%) and Zhongshan (43.84%), while the SIR of STH was higher in Maoming (46.89%). The third survey showed that Zhongshan (34.39%) had the highest overall SIRs of helminths, followed by Heyuan (20.74%), and Clonorchis sinensis was the most major human helminth in most cities (e.g., Zhongshan, Heyuan, Zhaoqing, and Qingyuan). The fourth survey showed that Heyuan, Jiangmen, and Foshan had both higher overall SIRs (13.58%, 12.20%, and 9.74%) and Clonorchis sinensis SIR (13.43%, 12.08%, and 9.58%), while the SIR of STH in Qingyuan (1.71%) was the highest (Figure 2 and
Supplementary Table S4 ).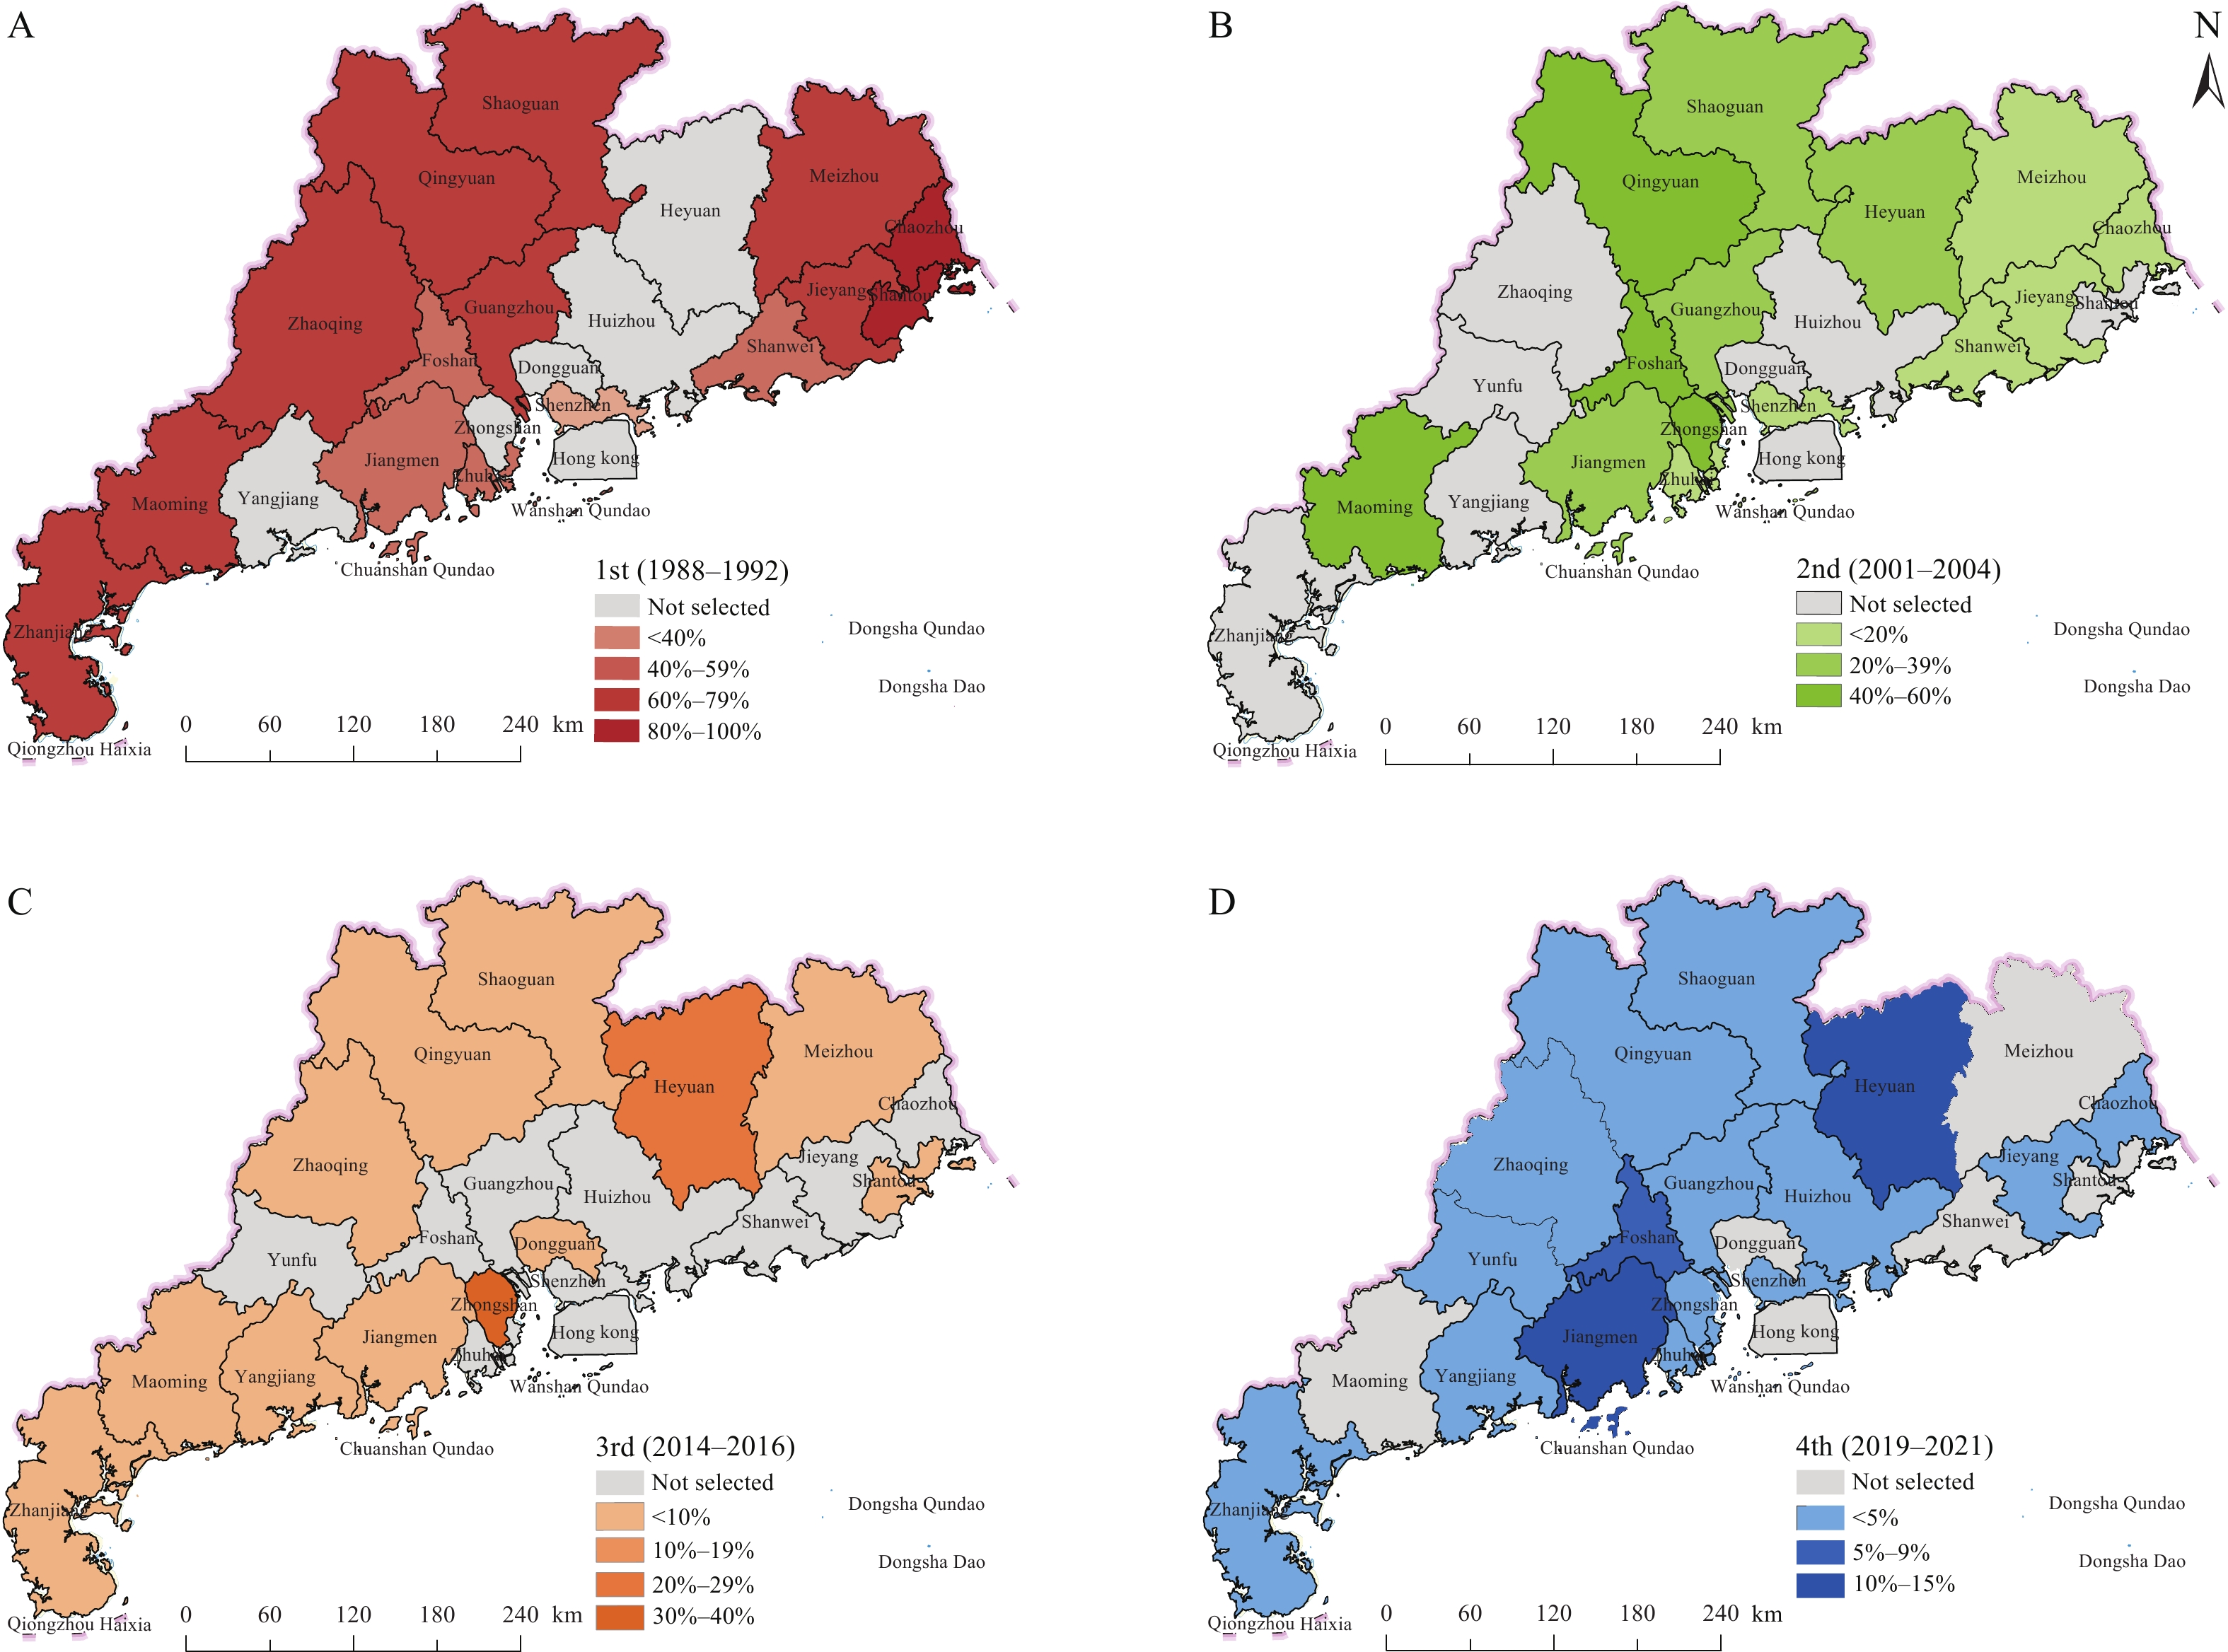 Figure 2.
Spatial distribution of overall SIRs of human helminths in four surveys in Guangdong Province, China. (A) Spatial distribution of overall SIRs in the first survey. (B) Spatial distribution of overall SIRs in the second survey. (C) Spatial distribution of overall SIRs in the third survey. (D) Spatial distribution of overall SIRs in the fourth survey.
Note: During the first survey, Yunfu was a county that belonged to the administrative division of Zhaoqing city.
Abbreviation: SIRs=standardized infection rates.
-
In the first survey, the overall SIRs of 4 major helminths were similar in people aged under 70 years, and the SIRs in females were slightly higher than in males (P<0.001). However, in the second and third surveys, the overall SIRs of helminths inclined in correlation with age and reached their peak in the group aged 50–60 years. In addition, males had slightly higher SIRs than females among most age groups. In the fourth survey, the overall SIRs of 4 major helminths were similar in people aged under 30 years but varied widely in people aged between 30 and 60 years, with males having higher SIRs than females (P<0.001). Longitudinal comparisons of the 4 surveys showed that STH were the major infections among all age groups in the first survey, and then substantially decreased in the next 3 surveys. In contrast, Clonorchis sinensis was the dominant helminth among adults in the second, third, and particularly in the fourth survey. The SIR of Clonorchis sinensis was higher in males than in females (P<0.001). Moreover, in the second survey, most infections of Clonorchis sinensis were found in adults aged over 20 years and, regardless of gender, the SIRs were higher among the groups aged 50–60 years (male: 21.66%, female: 13.89%) and 70–80 years (male: 22.92%, female: 15.42%). Meanwhile, Clonorchis sinensis infection was mainly found in people aged 40–60 years in the third and fourth surveys (Figure 3).
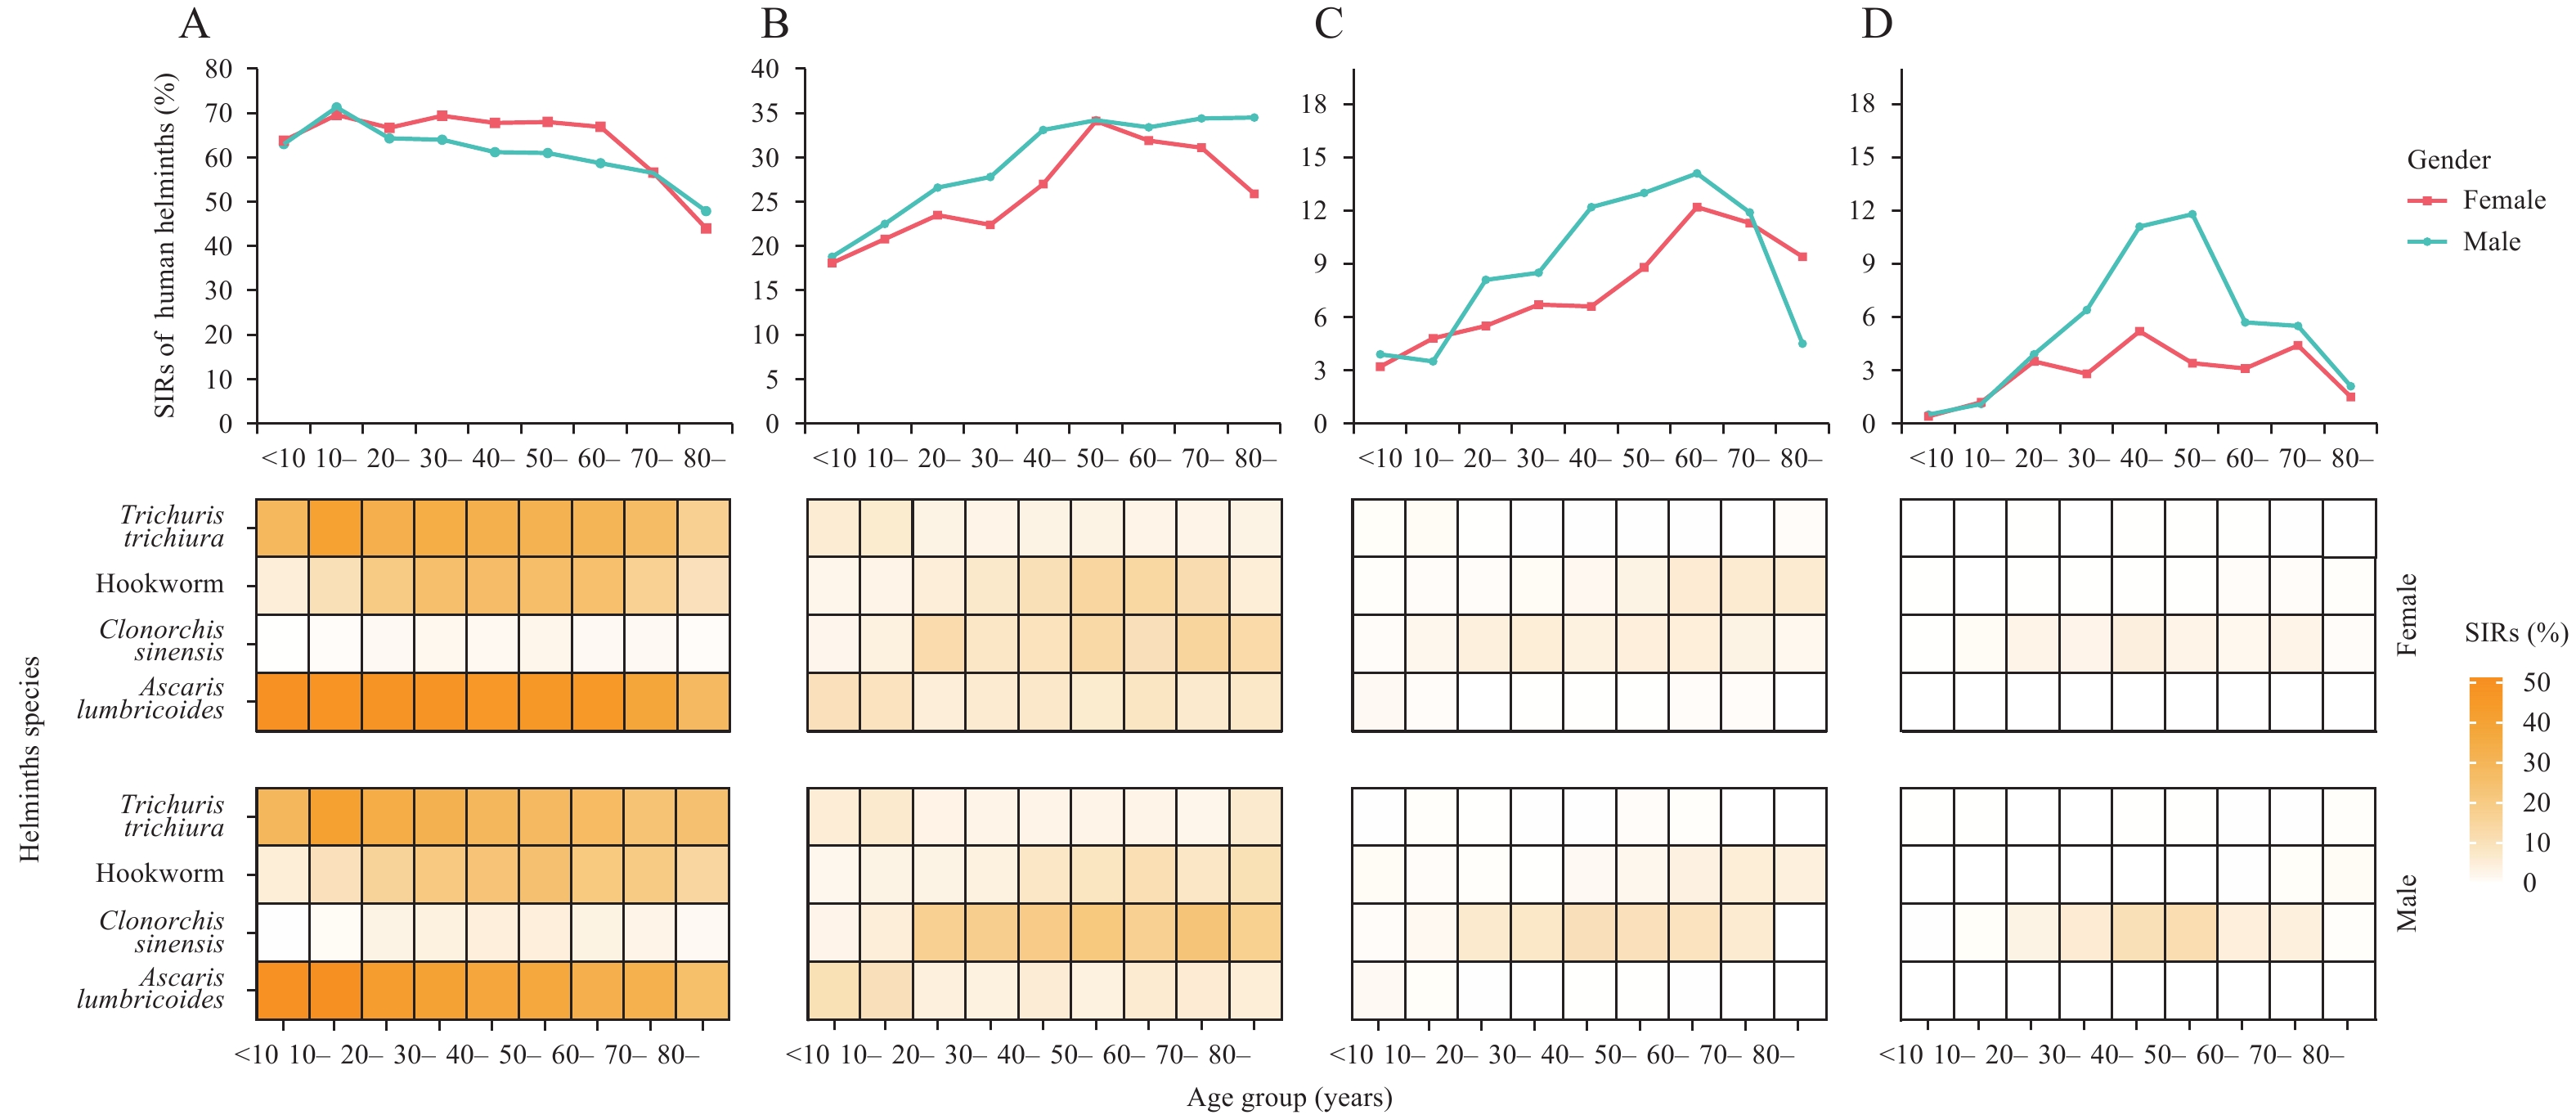 Figure 3.
SIRs of human helminths by gender and age in four surveys in Guangdong Province, China. (A) The first survey was conducted during 1988–1992. (B) The second survey was conducted during 2001–2004. (C) The third survey was conducted during 2014–2016. (D) The fourth survey was conducted during 2019–2021.
Note: The shades of color of the box in the picture represent the SIRs of human helminths.
Abbreviation: SIRs=standardized infection rates.
The overall SIRs of helminths were higher in farmers and manual workers in the first 3 surveys, while the overall SIR of government officials and clerks was higher in the fourth survey. However, the overall SIRs substantially decreased in most occupations (e.g., manual workers, farmers, businessmen, and students) across the 4 surveys. Similar patterns were found for each STH. The SIRs of Clonorchis sinensis were higher in manual workers, farmers, and businessmen in the 4 surveys (
Supplementary Table S5 ), which indicates that the SIRs increased in the second survey and then decreased in the third and fourth surveys.Moreover, the second survey showed that the overall SIRs of the helminths and the SIRs of STH substantially decreased from lower education groups to higher education groups. However, the SIRs of Clonorchis sinensis were higher in the groups with 1–12 years of education in the second survey and inclined with increases in education levels in the third and fourth surveys. Meanwhile, in each education group, the dominant helminth infection source changed from STH infection in the second survey to Clonorchis sinensis infection in the third and fourth surveys (
Supplementary Table S6 ). -
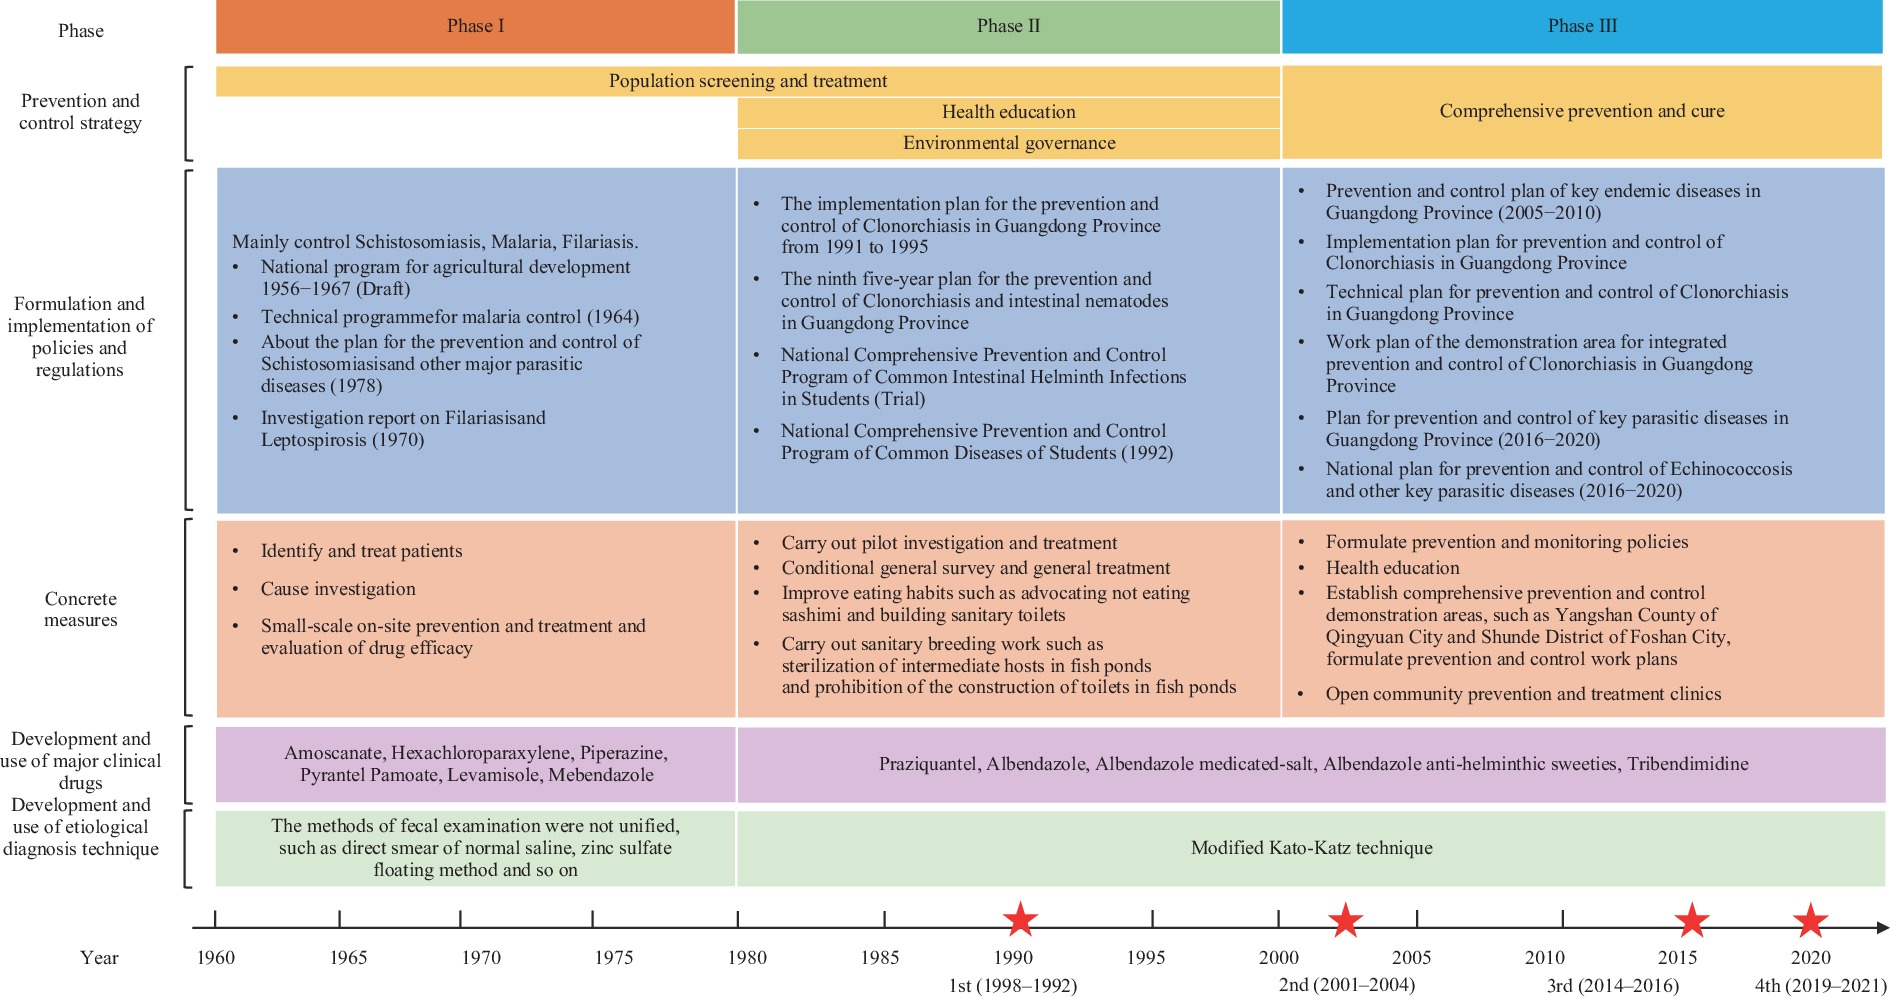
In the early years of China, due to lessened socioeconomic development, poor healthcare systems and facilities (
Supplementary Figure S1 ), and people’s unhealthy hygiene habits, parasitic infection was a severe public health challenge (9). The Chinese government has made a great effort to prevent and control these health-threatening parasitic diseases (2). In Guangdong Province, the prevention and control work can be divided into 3 phases (Supplementary Figure S2 ), and various control measures have been put forward and implemented. These measures improved people’s mode of production and increased awareness of protection, thus substantially reducing the infection of parasites — particularly soil-transmitted helminths.However, the epidemiological characteristics of Clonorchis sinensis infection were substantially different from STH. Compared with the first survey, the infection rate of Clonorchis sinensis increased in the second survey, which is consistent with the national infection rate (4). This phenomenon can be explained by several reasons. First, humans are mainly infected with Clonorchis sinensis by eating raw freshwater fish. Guangdong Province is in subtropical areas, and freshwater aquaculture is an important part of its industry (10), which gives people more opportunities to ingest food containing raw fish. Second, in earlier years in Guangdong Province, particularly in rural areas, simple lavatories without sanitary treatment were usually built adjacent to fishponds. Human excrement containing Clonorchis sinensis eggs was directly excreted into the ponds and contaminated the snails and fish (11). Third, some wrong perceptions about clonorchiasis were popular among people. For example, one myth promulgated the claim that drinking wine while eating raw freshwater fish could prevent the infection of Clonorchis sinensis (12). Fourth, the prevalence of infection is affected by the cumulative effect of long-term survival of Clonorchis sinensis. People infected with Clonorchis sinensis demonstrate appearance of the disease in a chronic process over time, and the symptoms are mostly mild and atypical in the early stages, so it is easy to be ignored by people; alongside this, the public consciousness in these areas around taking the initiative to seek medical treatment is not strong, often resulting in long-term accumulation (7). In addition, socio-economic development is also a key factor in the spread of Clonorchis sinensis. The improvement of China’s economic level has provided the material conditions and convenience necessary for the expansion of freshwater aquaculture and people’s consumption of raw freshwater fish (13). Therefore, more people eat raw freshwater fish when their income increases — which explains why the infection rate of Clonorchis sinensis increased sharply in the second survey during a period of economic growth (7).
The infection rate of Clonorchis sinensis slightly decreased in the third and fourth surveys compared with the second survey, which was related to the comprehensive prevention and cure measures implemented after 2000. For example, most lavatories nearby fishponds were removed, and the environments of fishponds were reconstructed to be more hygienic. However, due to deeply rooted traditions, people in many places have kept their traditional food preparation techniques despite economic development. Therefore, the infection rate of Clonorchis sinensis remained at a high level even in people with higher education levels.
This study further found different effects of gender, age, and occupation on the infection rate of helminths. In the early years (the 1980s–1990s) with less socioeconomic development, women and children were more vulnerable to parasites. However, with socioeconomic and healthcare system development, more efforts were made to protect women’s and children’s health (14), and their infection risks continually decreased in the second, third, and fourth surveys. By contrast, males had more exposure to parasites and a higher risk of infection due to their occupations and dietary habits (having more social activities).
These findings suggest that although most parasitic diseases have been successfully controlled or eliminated, sustained works of prevention and control are also needed, especially on clonorchiasis. A series of measures are recommended by the CDC of the USA, and the WHO, including health education, health promotion, chemotherapy, and environmental reconstruction (15). Health education and promotion programs could improve people’s knowledge regarding the health impacts of clonorchiasis. More attention should be paid to the safety of freshwater fish, and those infected fish should be barred from markets. In addition, more research is needed to estimate the disease burden of clonorchiasis at national and regional levels, which could help make prevention and control policies better.
There are several limitations to this study. First, this study did not collect individual information on dietary habits, behaviors, living environments, and income levels, and did not investigate their impacts on the infection of helminths. Second, education information was not collected in the first survey. As a result, we did not describe the modification of education levels on the infection rate of helminths in the first survey. Third, although the Kato-Katz technique is a relatively simple and low-cost method recommended by the WHO, it may miss low-intensity infections, leading to an underestimation of the actual infection rate.
In conclusion, this study evaluated the spatiotemporal changes of major human helminth infections in the past three decades across Guangdong Province. Integrated measures are needed to maintain the low prevalence level of soil-transmitted helminths; meanwhile, more intensified comprehensive measures are urgently needed to prevent and control Clonorchis sinensis infection.
-
The surveys in Guangdong Province mainly aimed to investigate the infection of helminths including soil-transmitted helminths (e.g., Ascaris lumbricoides, hookworm, and Trichuris trichiura) and food-borne trematodes (e.g., Clonorchis sinensis). In each survey site, clean fecal bags were distributed to study objects who collected egg-sized and early-rise feces from 8:00 to 9:00 am, and sent the samples to the laboratory for detection.
Regions in Guangdong Province 1st (1988–1992) 2nd (2001–2004) 3rd (2014–2016) 4th (2019–2021) Cities/
countiesNumber of survey sites Cities/
countiesNumber of survey sites Cities/
countiesNumber of survey sites Cities/
countiesNumber of survey sites North Shixing 3 Shixing 3 Lechang 3 Shixing 5 Shaoguan 4 Qingyuan 3 Wengyuan 1 Ruyuan 5 Yangshan 3 Xingning 3 Lianshan 2 Yuancheng 5 Liannan 3 − − Qingyuan 2 Heping 5 − − − − − − Longchuan 5 − − − − − − Qingcheng 5 − − − − − − Lianzhou 5 − − − − − − Liannan 5 East Meizhou 3 Longchuan 3 Longchuan 1 Chaoan 5 Xingning 4 Chaoan 3 Xingning 1 Jiedong 5 Fengshun 4 Jiexi 3 Pingyuan 4 − − Dabu 4 Puning 3 Nanao 3 − − Wuhua 4 Luhe 3 Shantou 2 − − Chenghai 4 − − − − − − Chaozhou 4 − − − − − − Jieyang 5 − − − − − − Puning 4 − − − − − − Luhe 3 − − − − − − West Kaiping 4 Gaozhou 3 Xinyi 4 Xuwen 5 Taishan 1 Dianbai 3 Huazhou 3 Chikan 5 Yunan 4 − − Yangxi 3 Luoding 5 Fengkai 4 − − Wuchuan 1 Yangchun 5 Suixi 4 − − Zhanjiang 2 − − Lianjiang 4 − − Lianjiang 3 − − Wuchuan 4 − − − − − − Gaozhou 4 − − − − − − Dianbai 4 − − − − − − Pearl River Delta Zhuhai 4 Zhuhai 3 Kaiping 2 Huadu 5 Naihai 4 Foshan 3 Zhongshan 4 Panyu 5 Panyu 4 Panyu 3 Dongguan 5 Xiangzhou 5 Huaxian 4 Kaiping 3 Zhaoqing 2 Doumen 5 Xinhui 5 Xinhui 3 − − Jinwan 5 Luohu 5 Shenzhen 3 − − Xinhui 10 Zhaoqing 4 Zhongshan 3 − − Zhongshan 10 Qingyuan 5 − − − − Pingshan 5 − − − − − − Dapeng New Area 5 − − − − − − Nanshan 5 − − − − − − Duanzhou 5 − − − − − − Dinghu 5 − − − − − − Chancheng 5 − − − − − − Huidong 5 Total 31 120 17 51 19 48 28 150 −: No survey site was selected. Table S1. Number of survey sites in the first, second, third, and fourth surveys in Guangdong Province, China.
City Study objects 1st (1988–1992)* 2nd (2001–2004)† 3rd (2014–2016)§ 4th (2019–2021)¶ N % N % N % N % Total 61,517 100.0 26,363 100.0 12,401 100.0 31,916 100.0 Chaozhou 2,027 3.3 1,503 5.7 − − 1,000 3.1 Foshan 2,032 3.3 1,561 5.9 − − 1,015 3.2 Guangzhou 4,267 6.9 1,583 6.0 − − 2,034 6.4 Jiangmen 5,108 8.3 3,037 11.5 541 4.4 2,065 6.5 Jieyang 4,569 7.4 3,099 11.8 − − 1,062 3.3 Maoming 4,118 6.7 3,038 11.5 1,796 14.5 − − Meizhou 9,680 15.7 1,663 6.3 1,271 10.2 − − Qingyuan 5,735 9.3 1,506 5.7 1,024 8.3 3,131 9.8 Shantou 2,011 3.3 − − 1,272 10.3 − − Shanwei 1,541 2.5 1,624 6.2 − − − − Shaoguan 3,584 5.8 1,537 5.8 1,033 8.3 2,342 7.3 Shenzhen 2,497 4.1 1,666 6.3 − − 3,428 10.8 Yunfu − − − − − − 1,077 3.4 Zhanjiang 6,122 10.0 − − 1,556 12.5 2,188 6.9 Zhaoqing 6,105 9.9 − − 513 4.1 2,006 6.3 Zhuhai 2,121 3.4 1,494 5.7 − − 3,076 9.6 Yangjiang − − − − 769 6.2 1,004 3.1 Zhongshan − − 1,500 5.7 1,073 8.7 2,042 6.4 Dongguan − − − − 1,297 10.5 − − Huizhou − − − − − − 1,024 3.2 Heyuan − − 1,552 5.9 256 2.1 3,422 10.7 *: The first survey was conducted during 1988–1992, when Yunfu was a county belonged to the administrative division of Zhaoqing City.
†: The second survey was conducted during 2001–2004.
§: The third survey was conducted during 2014–2016.
¶: The fourth survey was conducted during 2019–2021.
−: No survey site was selected.Table S2. Number of study objects in selected cities in the first, second, third, and fourth survey in Guangdong Province, China.
Survey rounds No. of objects No. of infections Infected with only one parasite (%) Infected with two parasites (%) Infected with three parasites (%) Infected with four parasites (%) Coinfection of parasites (%) 1st
(1988–1992)*61,517 40,426 57.73 33.55 8.52 0.20 Ascaris lumbricoides and Trichuris trichura (47.4) Ascaris lumbricoides and hookworm (18.8) Ascaris lumbricoides, hookworm, and
Trichuris trichura (18.4)2nd
(2001–2004)†26,363 6,619 87.10 12.14 0.73 0.03 Ascaris lumbricoides and Trichuris trichura (30.2) Ascaris lumbricoides and hookworm (25.7) Clonorchis sinensis, and hookworm (15.7) 3rd
(2014–2016)§12,401 950 98.99 1.01 0.00 0.00 Ascaris lumbricoides and hookworm (43.1) Trichuris trichura and Clonorchis sinensis (29.5) Trichuris trichura, and hookworm (12.8) 4th (2019–2021)¶ 31,916 1,260 99.58 0.42 0.00 0.00 Trichuris trichura and Clonorchis sinensis (46.6) Trichuris trichura, and hookworm (33.2) Ascaris lumbricoides and Trichuris trichura (20.2) P for trend** − − <0.001 <0.001 <0.001 <0.001 − − − *: The first survey was conducted during 1988–1992.
†: The second survey was conducted during 2001–2004.
§: The third survey was conducted during 2014–2016.
¶: The fourth survey was conducted during 2019–2021.
**: Cochran-Armitage trend test.
−: Not applicable.Table S3. Proportion of human helminth single infection and coinfection in Guangdong Province, China.
City 1st (1988–1992)* 2nd (2001–2004)† 3rd (2014–2016)§ 4th (2019–2021)¶ Total Soil-transmitted helminths Any soil-transmitted helminths Clonorchis sinensis Total Soil-transmitted helminths Any soil-transmitted helminths Clonorchis sinensis Total Soil-transmitted helminths Any soil-transmitted helminths Clonorchis sinensis Total Soil-transmitted helminths Any soil-transmitted helminths Clonorchis sinensis Ascaris lumbricoides Hookworm Trichuris trichiura Ascaris lumbricoides Hookworm Trichuris trichiura Ascaris lumbricoides Hookworm Trichuris trichiura Ascaris lumbricoides Hookworm Trichuris trichiura Chaozhou 88.05 45.08 40.65 74.62 87.99 2.48 11.15 1.82 2.70 6.18 10.25 1.30 − − − − − − 0.00 0.00 0.00 0.00 0.00 0.00 Foshan 56.22 31.98 8.22 30.21 49.56 16.37 55.58 2.35 5.08 2.21 8.91 50.04 − − − − − − 9.74 0.12 0.04 0.00 0.16 9.58 Guangzhou 70.72 43.87 22.68 42.83 69.91 7.49 23.01 0.80 3.30 0.54 4.64 19.89 − − − − − − 1.26 0.00 0.00 0.03 0.03 1.22 Jiangmen 46.48 23.05 13.06 22.26 44.64 3.35 22.78 2.19 3.24 0.63 5.94 17.42 2.11 0.00 0.00 0.00 0.00 2.11 12.20 0.00 0.00 0.19 0.19 12.08 Jieyang 78.74 38.73 21.73 67.23 78.74 0.02 15.72 2.57 11.12 3.32 15.67 0.05 − − − − − − 0.23 0.13 0.00 0.23 0.23 0.00 Maoming 65.47 52.34 24.47 31.57 65.47 0.00 46.90 22.43 19.93 18.86 46.89 0.13 8.96 0.76 7.70 0.37 8.71 0.25 − − − − − − Meizhou 67.38 49.08 17.28 30.99 67.13 0.54 11.71 6.35 3.52 2.61 11.39 0.32 0.55 0.00 0.23 0.06 0.29 0.26 − − − − − − Qingyuan 61.01 51.04 21.68 7.08 59.60 2.29 43.98 28.62 12.06 1.52 36.88 7.88 5.21 0.32 0.00 0.41 0.68 4.58 2.45 0.00 1.44 0.31 1.71 0.74 Shantou 84.29 52.25 8.49 75.19 84.29 0.05 − − − − − − 0.06 0.06 0.00 0.00 0.06 0.00 − − − − − − Shanwei 57.24 41.64 27.16 10.36 57.24 0.00 5.68 2.46 3.02 0.73 5.68 0.00 − − − − − − − − − − − − Shaoguan 68.71 57.50 13.05 27.22 65.82 6.96 27.45 16.75 5.16 5.04 24.98 3.24 2.97 0.26 0.82 0.24 1.33 1.64 0.11 0.00 0.04 47.88 0.09 0.00 Shenzhen 38.64 10.65 12.95 23.63 38.52 0.17 3.51 1.26 0.40 0.72 2.31 1.23 − − − − − − 1.09 0.00 0.00 0.07 0.07 1.04 Yunfu − − − − − − − − − − − − − − − − − − 0.17 0.00 0.07 0.11 0.17 0.00 Zhanjiang 66.61 56.13 20.48 23.44 66.61 0.00 − − − − − − 6.61 1.87 2.53 1.85 6.19 0.41 0.15 0.05 0.00 0.11 0.15 0.00 Zhaoqing 68.21 56.75 8.61 30.82 67.93 0.84 − − − − − − 9.36 0.00 1.18 0.08 1.27 8.19 1.45 0.00 0.00 0.00 0.00 1.45 Zhuhai 59.89 19.57 26.71 38.21 58.56 3.69 9.39 0.43 3.10 0.78 4.22 5.84 − − − − − − 3.23 0.02 0.00 0.05 0.07 3.16 Yangjiang − − − − − − − − − − − − 2.74 0.00 1.89 0.97 2.74 0.00 0.91 0.00 0.00 0.91 0.91 0.00 Zhongshan − − − − − − 55.50 6.02 8.38 7.51 18.68 43.84 34.39 0.00 0.00 0.18 0.18 34.39 4.61 0.15 0.00 0.00 0.15 4.46 Dongguan − − − − − − − − − − − − 0.61 0.00 0.00 0.00 0.00 0.61 − − − − − − Huizhou − − − − − − − − − − − − − − − − − − 0.00 0.00 0.00 0.00 0.00 0.00 Heyuan − − − − − − 20.58 2.02 3.52 0.06 5.35 16.18 20.74 0.00 0.00 0.00 0.00 20.74 13.58 0.00 0.04 0.12 0.15 13.43 P** <0.001 <0.001 <0.001 <0.001 <0.001 <0.001 <0.001 <0.001 <0.001 <0.001 <0.001 <0.001 <0.001 <0.001 <0.001 <0.001 <0.001 <0.001 <0.001 <0.001 <0.001 <0.001 <0.001 <0.001 Note: Any soil-transmitted helminths: Infected with at least one of Ascaris lumbricoides, hookworm, and Trichuris trichiura.
−: No survey site was selected.
Abbreviation: SIRs=standardized infection rates.
*: The first survey was conducted during 1988–1992.
†: The second survey was conducted during 2001–2004.
§: The third survey was conducted during 2014–2016.
¶: The fourth survey was conducted during 2019–2021.
**: Pearson’s χ 2 test.Table S4. SIRs of human helminths in the selected cities/counties in Guangdong Province, China
Occupation 1st (1988–1992)* 2nd (2001–2004)† 3rd (2014–2016)§ 4th (2019–2021)¶ Total Soil-transmitted helminths Any soil-transmitted helminths Clonorchis sinensis Total Soil-transmitted helminths Any soil-transmitted helminths Clonorchis sinensis Total Soil-transmitted helminths Any soil-transmitted helminths Clonorchis sinensis Total Soil-transmitted helminths Any soil-transmitted helminths Clonorchis sinensis Ascaris lumbricoides Hookworm Trichuris trichiura Ascaris lumbricoides Hookworm Trichuris trichiura Ascaris lumbricoides Hookworm Trichuris trichiura Ascaris lumbricoides Hookworm Trichuris trichiura Manual worker 41.46 26.98 4.58 26.32 40.29 2.36 26.82 3.21 4.81 2.47 9.21 18.99 8.24 0.22 0.55 0.33 0.88 7.42 3.03 0.04 0.09 0.06 0.20 2.85 Farmer 70.82 47.33 22.68 36.08 70.07 2.36 27.40 7.84 8.50 3.20 15.22 11.68 7.21 0.31 2.19 0.26 2.71 4.54 3.31 0.01 0.37 0.20 0.56 2.76 Businessman 33.47 22.46 1.15 19.69 31.81 1.67 24.93 1.59 4.04 1.90 6.86 19.54 4.32 0.00 0.28 0.08 0.36 3.96 1.91 0.00 0.00 0.00 0.00 1.91 Government official and clerk 33.46 16.33 1.66 15.33 30.42 4.36 15.47 3.93 2.04 0.46 5.61 9.87 5.16 0.00 0.00 0.24 0.24 4.92 8.31 0.00 0.00 0.00 0.00 8.31 Medical staff and teacher 17.82 9.40 1.33 7.10 15.69 2.12 13.59 1.26 1.96 1.64 4.13 9.68 3.52 0.00 0.62 0.00 0.62 2.89 6.12 0.03 0.00 0.08 0.11 6.05 Student 34.15 22.23 7.21 18.33 34.11 1.23 9.33 3.83 1.98 2.63 7.19 2.44 2.05 0.32 0.28 0.21 0.79 1.26 0.97 0.01 0.02 0.03 0.05 0.92 Preschooler 15.92 11.32 1.42 6.92 14.45 1.48 1.62 0.94 0.19 0.43 1.40 0.27 0.30 0.12 0.03 0.05 0.20 0.11 0.05 0.00 0.01 0.01 0.03 0.02 Others 44.05 26.31 6.45 25.82 43.15 1.74 19.90 3.11 4.86 3.63 10.10 10.73 10.01 0.03 0.83 0.29 1.15 8.86 4.53 0.00 0.01 0.02 0.02 4.51 P** <0.001 <0.001 <0.001 <0.001 <0.001 <0.001 <0.001 <0.001 <0.001 <0.001 <0.001 <0.001 <0.001 <0.001 <0.001 <0.001 <0.001 <0.001 <0.001 <0.001 <0.001 <0.001 <0.001 <0.001 Note: Any soil-transmitted helminths: Infected with at least one of Ascaris lumbricoides, hookworm, and Trichuris trichiura.
Abbreviation: SIRs=standardized infection rates.
*: The first survey was conducted during 1988–1992.
†: The second survey was conducted during 2001–2004.
§: The third survey was conducted during 2014–2016.
¶: The fourth survey was conducted during 2019–2021.
**: Pearson’s χ 2 test.Table S5. SIRs of human helminths by occupation in four surveys in Guangdong Province, China.
Education (years) 2nd (2001–2004)* 3rd (2014–2016)† 4th (2019–2021)§ Total Soil-transmitted helminths Any soil-transmitted helminths Clonorchis sinensis Total Soil-transmitted helminths Any soil-transmitted helminths Clonorchis sinensis Total Soil-transmitted helminths Any soil-transmitted helminths Clonorchis sinensis Ascaris lumbricoides Hookworm Trichuris trichiura Ascaris lumbricoides Hookworm Trichuris trichiura Ascaris lumbricoides Hookworm Trichuris trichiura No formal education 30.28 10.56 10.15 8.96 23.47 7.29 4.12 0.12 0.56 0.06 0.74 3.38 2.69 0.00 0.09 0.01 0.11 2.58 1–9 27.85 7.96 6.97 4.70 16.85 12.18 7.35 0.44 2.17 0.47 3.01 4.38 3.30 0.02 0.20 0.19 0.39 2.91 10–12 26.17 3.08 8.22 2.87 12.72 14.55 6.82 0.32 0.28 0.42 1.03 5.79 5.48 0.04 0.11 0.10 0.24 5.24 ≥13 11.00 1.17 2.75 1.52 4.24 7.17 8.95 0.00 0.10 0.15 0.25 8.69 5.45 0.00 0.02 0.04 0.06 5.42 Missing 18.73 2.99 8.94 0.00 11.93 6.80 0.00 0.00 0.00 0.00 0.00 0.00 0.00 0.00 0.00 0.00 0.00 0.00 P¶ <0.001 <0.001 <0.001 <0.001 <0.001 <0.001 <0.001 <0.001 <0.001 <0.001 <0.001 <0.001 <0.001 <0.001 <0.001 <0.001 <0.001 <0.001 Note: Education information was not investigated in the first survey.
Any soil-transmitted helminths: Infected with at least one of Ascaris lumbricoides, hookworm, and Trichuris trichiura.
Abbreviation: SIRs=standardized infection rates.
*: The second survey was conducted during 2001–2004.
†: The third survey was conducted during 2014–2016.
§: The fourth survey was conducted during 2019–2021.
¶: Pearson’s χ 2 test.Table S6. SIRs of human helminths by education level in the second, third and fourth surveys in Guangdong Province, China.
HTML
Survey Sites and Objects
Detection of Helminth Eggs in Feces
Collection of Socioeconomic Information
Statistical Analysis
Ethics Statement
General Characteristics of Survey Objects
Spatiotemporal Changes of the SIRs of Helminths
Modification of Demographic Characteristics on the Infection of Helminths
Collection of Fecal Samples
| Citation: |

|