

 Download:


-
Since the beginning of the coronavirus disease 2019 (COVID-19) pandemic, caused by severe acute respiratory syndrome coronavirus 2 (SARS-CoV-2), more than 440 million people have been infected and 6 million have died worldwide as of March 2022: posing a serious public health challenge (1). Vaccination provides robust protection for preventing and controlling the spread of COVID-19 (2). However, although the largest scale COVID-19 vaccination yet has been launched in China, outbreaks of COVID-19 are still occurring across the country (3-5). Sero-epidemiological investigations are key to evaluating whether a population has reached an effective immunization barrier and to finding any immunization gaps (6). A crucial hindrance to such investigations, particularly in young children, is the feasibility of collecting large-scale representative blood samples. Oral fluid (OF) has been successfully used for decades to evaluate the antibody levels of childhood immunization programs for measles and rubella (7). OF is a mixed exudate derived from several anatomical sources, including the saliva and gingival crevicular fluid, which contains the same IgG and IgM antibodies as those in the serum. Detection of SARS-CoV-2-induced antibodies in OF can thus provide a non-invasive method for assessing host responses to infection or vaccination.
In this study, an adapted magnetic particle-based chemiluminescence immunoassay (CLIA) was developed to detect IgG antibodies against SARS-CoV-2 in OF. Recipients of inactivated vaccines against COVID-19 were recruited and paired serum and OF samples were collected for comparison. Further, the sensitivity and specificity of this non-invasive immunoassay (OF assay) for SARS-CoV-2 IgG antibody detection were evaluated.
-
Paired serum and OF samples were collected from individuals who had received a booster dose (third dose) of inactive COVID-19 vaccine (vaccine group) as well as those who were a part of the population that was unvaccinated or uninfected with COVID-19 (control group). In the vaccine group, participants were voluntarily recruited from the Beijing Center for Disease Control and Prevention and from Beijing Haidian Hospital in November 2021. In the control group, due to the high coverage rate of COVID-19 vaccine in Beijing in 2021, individuals who had collected paired serum and OF samples in 2018 before the COVID-19 pandemic were included from Beijing Haidian Hospital. Additionally, OF samples from healthy preschool children who were not vaccinated because of the COVID-19 immunization age restriction were also collected to assess the quality of pediatric OF sampling. All participants and guardians, on behalf of the pre-school children, provided written informed consent prior to enrollment in the study.
The self-collection device (Oracol, S10, Malvern Medical Developments, UK) was used to collect OF samples (according to the manufacturer’s instructions). As a brief overview, the sponge swab was brushed at the junction between the teeth and gums of participants repeatedly for at least 90 seconds until completely soaked, and then placed back into the tube and capped. OF was extracted using 0.6 mL elution buffer (phosphate-buffered saline containing 10% fetal calf serum, 500 µg/mL gentamicin, and 1 mL penicillin-streptomycin solution). The tube was centrifuged at 250 ×g for 1 minute to remove cellular debris; then, the sponge swab was removed and discarded. Next, the supernatant OF was collected for further analysis. Blood samples were collected in blood collection tubes (Becton, Dickinson and Company) and stored at room temperature until coagulated before transport to the laboratory. The blood samples were then centrifuged at 1,500 ×g for 10 minutes to separate the serum.
For detecting SARS-CoV-2 IgG antibodies in OF, an adapted in-house SARS-CoV-2 IgG magnetic particle-based CLIA for OF was developed (8). Simply, 75 µL of OF samples and 50 µL of recombinant SARS-CoV-2 antigens, labeled with fluorescein isothiocyanate (FITC), were added into a reaction tube to form the antigen-antibody complex. Meanwhile, 35 µL of magnetic particles conjugated with anti-FITC antibodies were added and incubated at 37 °C for 20 minutes to form IgG antibody-antigen-magnetic particle complexes. After washing away the unbound components, 75 µL of alkaline phosphatase-labeled mouse anti-human IgG monoclonal antibody was added. After incubation, the complex was washed again; finally, 100 µL of substrate solution was added, and the chemiluminescence value of each OF sample was measured.
For detection of SARS-CoV-2 IgG antibody in the serum, a commercial SARS-CoV-2 IgG magnetic particle-based CLIA (Bioscience, Tianjin, China; Lot number: G202108003) was used according to the manufacturer’s protocol. The SARS-CoV-2 IgG antibody levels are presented as a ratio (S/CO, chemiluminescence value of sample/cutoff value). Samples with ratios exceeding or equal to 1 were considered positive and those with ratios of less than 1 were considered negative.
To ensure the quality of OF sampling, the total human IgG antibody (HIgG) content in the OF was selected as the biological index for sampling quality. The content of HIgG in each OF sample was measured using an HIgG antibody detection kit (Bioscience, Tianjin, China; Lot number: G202108003). A reference value range (one-sided) of 95% of HIgG was evaluated to establish the quality standard of OF sampling.
The sensitivity and specificity of the OF immunoassay for SARS-CoV-2 IgG detection were calculated and compared to those of a commercial magnetic particle-based CLIA. The best cutoff value for the in-house OF immunoassay was assessed using receiver operating characteristic curve (ROC) analysis. The Pearson chi-square test was used to test the differences among sampling methods. Statistical analysis and ROC analysis were performed using SPSS software (version 19, IBM, NY, USA). A value of P less than 0.05 was considered statistically significant.
-
During the study period, a total of 579 paired serum and OF samples were collected, with 364 and 215 from the vaccine and control group, respectively. The median age of the participants in the vaccine group was 45 years (interquartile range [IQR], 35–53 years). In the control group, the median age was 34 years (IQR, 29–39 years). Further, 172 OF samples were collected from preschool children with a median age of 4 years (IQR, 3–5 years).
To evaluate the quality of OF sampling, the total HIgG concentrations in 751 OF samples (579 adults and 172 children) were determined. Overall, the mean concentration of HIgG in OF samples was 1.85±0.83 µg/mL. The mean concentration of HIgG in OF samples from children was 2.02±1.02 µg/mL, which was significantly higher than that of the adults at 1.85±0.77 µg/mL (t=2.223, P<0.05). Further, the mean HIgG concentration in the OF samples from the vaccine group was 2.01±0.72 µg/mL, which was significantly higher than that of the control group at 1.59±0.77 µg/mL (t=6.616, P<0.001) (Figure 1). However, there was no significant correlation between the HIgG concentration in the OF and the titer of IgG antibody against SARS-CoV-2 in the serum (R2=0.062). The threshold for HIgG concentration in qualified OF samples could be set to 0.3 µg/mL, as more than 95% of OF samples contained higher concentrations of HIgG. Based on this cutoff, 8 and 12 OF samples from the vaccine and control groups, respectively, were excluded from the study.
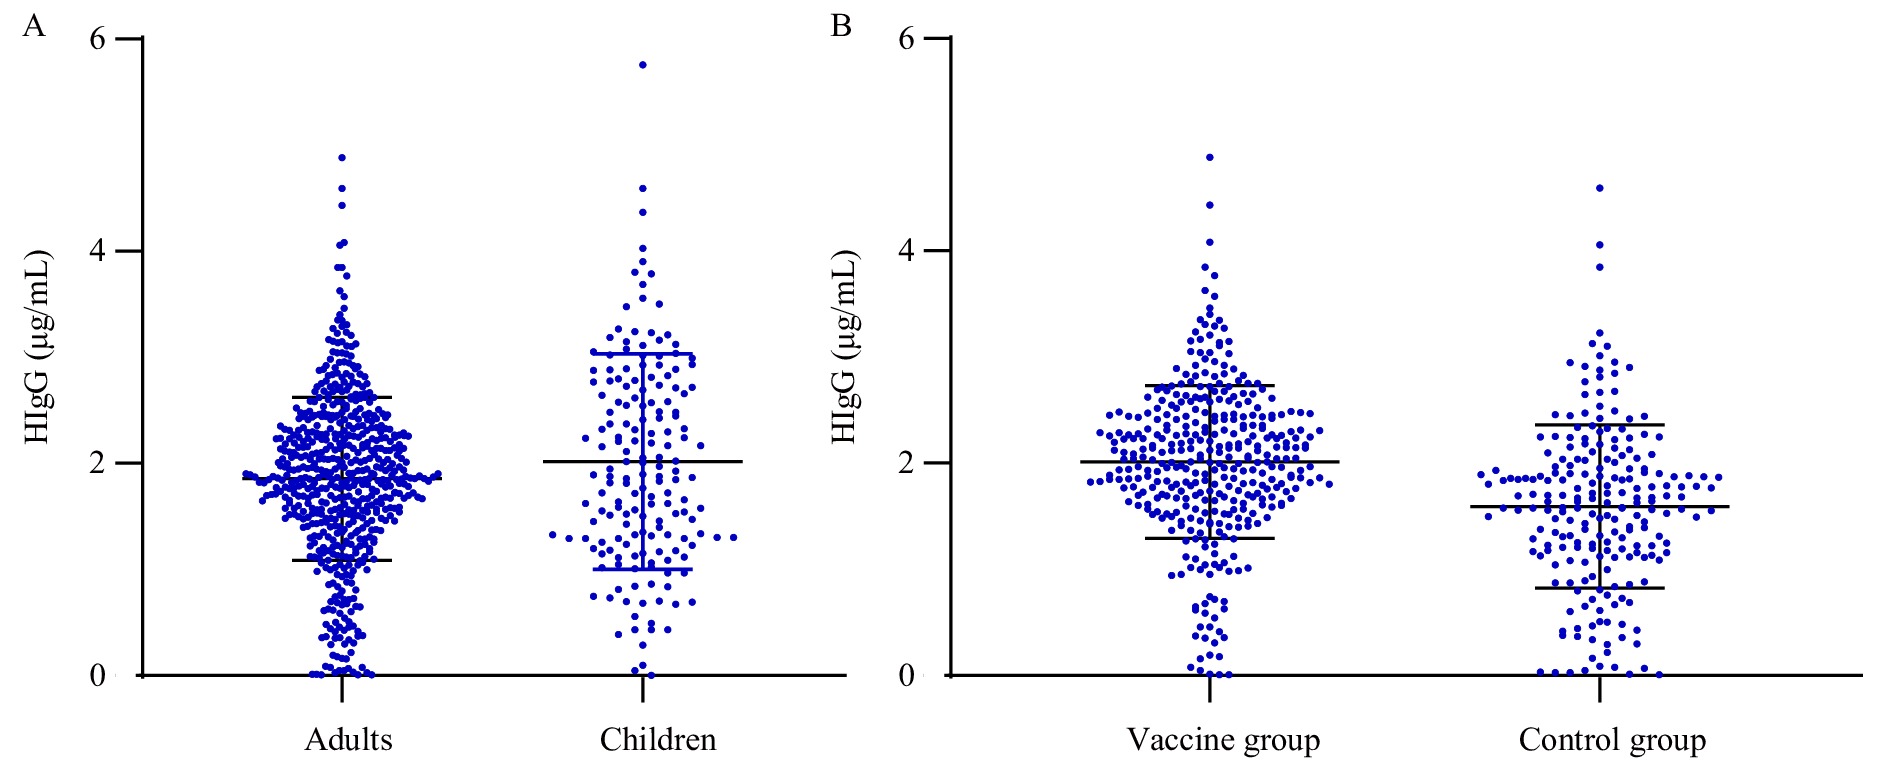 Figure 1.
The distribution of HIgG titers in OF samples based on age and immune state. (A) The different levels of HIgG antibodies between adults group (over 18 years old) and children group (younger than 14 years); (B) The different levels of HIgG antibodies between vaccine group (received booster dose of COVID-19 vaccine) and control group (without COVID-19 infection or vaccination history).
Abbreviation: HIgG=human immunoglobulin G; OF=oral fluid; SARS-CoV-2=severe acute respiratory syndrome coronavirus 2; COVID-19=coronavirus disease 2019.The SARS-CoV-2 IgG antibody was detected in 397 paired OF and serum samples (194 from the vaccine group and 203 from the control group) using both the adapted in-house immunoassay and commercial magnetic particle-based CLIA. Compared to the titer of SARS-CoV-2 IgG in serum, a ROC curve was plotted for detecting SARS-CoV-2 IgG antibody in OF samples. The area under the ROC curve for SARS-CoV-2 IgG antibody in OF samples was 0.988, and the chemiluminescence cutoff value was set as 105,566.5 (Figure 2).
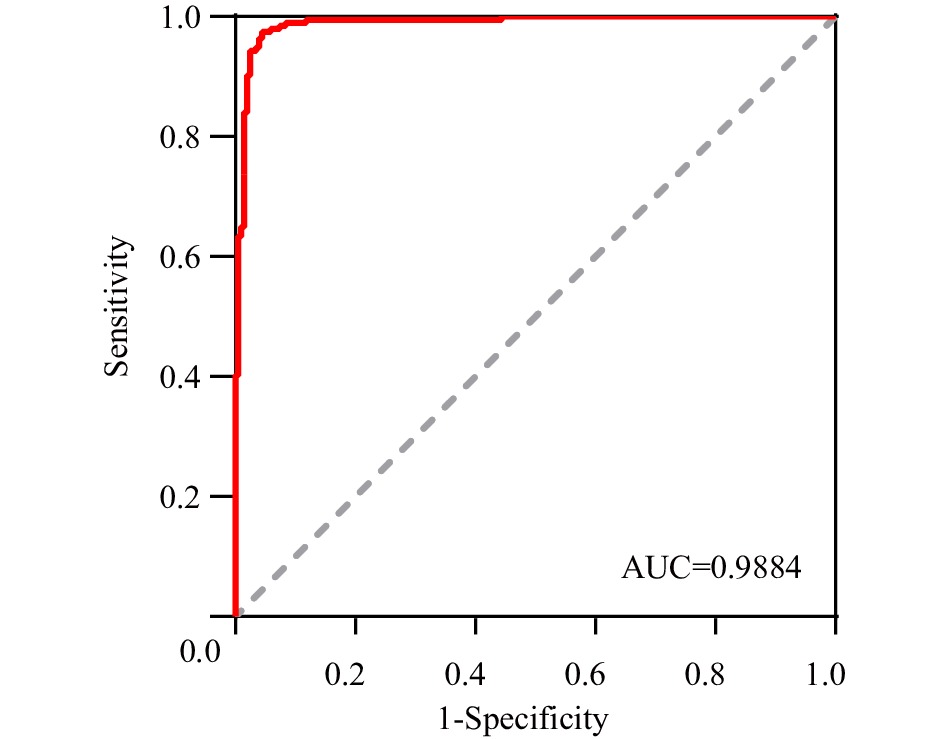 Figure 2.
The ROC curve for SARS-CoV-2 IgG antibody detection in OF samples.
Note: The true positive rate (sensitivity) of SARS-CoV-2 IgG antibodies in OF is plotted in function of the false positive (1-specificity) for different cut-off points.
Abbreviation: ROC=receiver operating characteristic; OF=oral fluid; AUC=area under curve; SARS-CoV-2=severe acute respiratory syndrome coronavirus 2.
Based on the cutoff value of SARS-CoV-2 IgG antibodies in the OF, among 162 paired OF and serum samples in the vaccine group, 161 (99.38%) serum samples and 153 OF samples (94.44%) tested positive for SARS-CoV-2 IgG (Table 1). Compared with the serum test, the in-house OF assay had 95.06% accuracy, 95.03% sensitivity, and 100% specificity. Of the eight false-negative OF samples, the range of S/CO values in the OF samples was 0.187–0.881, whereas that in the matched serum samples was 1.574–10.776. The concentration of SARS-CoV-2 IgG in OF was significantly correlated with that of the serum (R2=0.62, P<0.001) (Figure 3).
Detection of
SARS-CoV-2 IgGSARS-CoV-2 IgG in serum Total Positive Negative SARS-CoV-2 IgG in OF Positive 153 0 153 Negative 8 1 9 Total 161 1 162 Abbreviation: SARS-CoV-2=severe acute respiratory syndrome coronavirus 2; OF=oral fluid. Table 1. Comparison of SARS-CoV-2 IgG antibody levels between the OF and serum samples in the vaccine group.
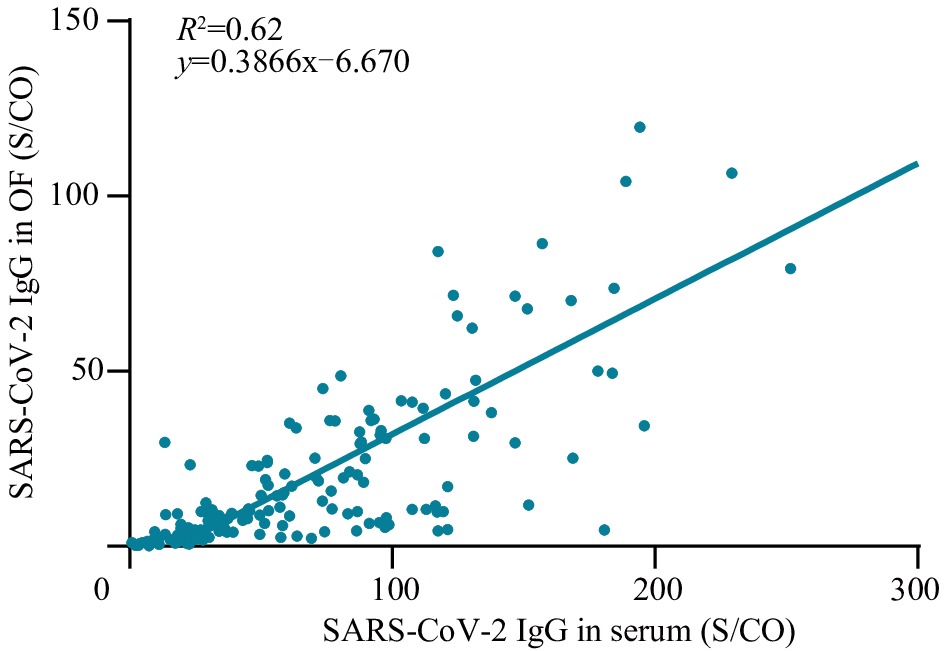 Figure 3.
The correlation analysis of SARS-CoV-2 IgG between OF and serum samples.
Note: Scatter plots of S/CO value of SARS-CoV-2 IgG concentration in OF (y-axis) and S/CO value of SARS-CoV-2 IgG concentration in serum (x-axis).
Abbreviation: SARS-CoV-2=severe acute respiratory syndrome coronavirus 2; S/CO=chemiluminescence value of sample/cutoff value; OF=oral fluid.
-
To date, several assays for the non-invasive detection of SARS-CoV-2 antibodies in OF have been established using different methods, such as enzyme-linked immunosorbent assays (ELISA) or lateral flow immune assays (LFIA) (9). However, the sensitivity of these commercial assays ranges from 53%–80%, which may not meet the requirements of the antibody prevalence survey (9-10). In this study, we evaluated a magnetic particle-based CLIA with high sensitivity to detect SARS-CoV-2 IgG antibodies in OF; this assay combined several advantages, including high sensitivity, high-throughput, and non-invasiveness. The in-house OF immunoassay showed that the SARS-CoV-2 specific IgG antibody levels in OF were similar to those observed in the serum, with 95.06% concordance. This assay achieved 95.03% sensitivity, which was higher than that of the above mentioned, commercial, non-invasive assays for SARS-CoV-2 specific antibody detection.
The OF comprises saliva and gingival crevicular fluid, which is rich in human IgG antibodies, but only represents a 1/1,000 dilution of that of the serum (11). Therefore, the quality of OF collection is critical for detecting SARS-CoV-2 IgG antibodies using the in-house OF assay. In this study, each participant was instructed by healthcare workers to brush the gumline at least for 90 seconds to stimulate the transudation of fluid. Further, the total HIgG content of each OF sample was measured to monitor the process of OF sampling. The threshold of HIgG for qualified OF samples was set as 0.3 µg/mL. Previous studies reported that the HIgG concentration in OF from children was lower than that in adults (9). However, our results indicate that OF samples from children have higher HIgG levels than those from adults. Further studies need to be conducted to clarify this phenomenon. In addition, vaccinated adults were found to have higher concentrations of total HIgG in OF than those in unvaccinated adults, possibly because of their active immune status at the time of OF sample collection.
However, this study has several limitations. First, as the quality of self-collected OF is highly dependent on proper operation and ease of using the collection device, the difference in total HIgG contents between samples from children and adults might be attributed to sampling bias; at the same time, all OF samples were collected only from adults over 18 years old and children under 14 years old, which also may lead to sampling bias. Second, the paired OF and serum samples in this study were only collected from the adult population and were not representative of the SARS-CoV-2 antibody in the OF from children and elderly individuals. Finally, the SARS-CoV-2 IgG antibody levels in OF from patients with COVID-19 have not been assessed in this study.
In summary, our results demonstrate the high potential of OF as a replacement for serum for serological surveillance and immunization effect assessment in the context of large-scale immunization programs for the inactivated COVID-19 vaccine in China. However, further studies are needed to improve the performance of the in-house OF assay, including enhancement of thermal stability, quantification, and standardization of the SARS-CoV-2 IgG titers in OF samples.
HTML
| Citation: |

|