
 Download:


-
The global spread of mutant strains is the main reason why coronavirus disease 2019 (COVID-19) is difficult to control. In March 2022, the subtype mutant strain BA.2 of Omicron was found in localized cases in at least 9 regions of China (such as Jilin Province, Shanghai Municipality, Fujian Province, etc.). Due to its insidious nature and rapid transmission (1-2), a large number of widely dispersed cases emerged in a short period of time. This posed a great risk of spillover to surrounding areas and made it extremely difficult for China to achieve its goal of maintaining a dynamic ‘COVID-zero’ policy.
By reviewing our previously constructed COVID-19 transmission dynamics models, we found that most studies have only focused on assessing the spread of COVID-19 within the overall region (3-7), and failed to consider the differences in control strategies among regions in cross-regional transmission epidemics. This could easily lead to misjudgment of the division of blockade control areas, thus causing unnecessary economic losses and the wastage of health resources. The dynamical mechanism of cross-regional transmission is consistent with the spatial decay characteristics of the gravitational model (8), i.e., where spatial spread is proportional to size and inversely proportional to distance. Therefore, constructing a cross-regional transmission model and considering interregional population movement to simulate morbidity trends are helpful in achieving China’s political goal through supporting multi-regional joint prevention and control.
In this study, a cross-region transmission epidemic in Xi’an City, Shaanxi Province in December 2021 was selected as the research case to analyze the characteristics of core-peripheral vertical spread in the Yanta District of Xi’an, and to assess the effect of population movement containment among regions in different outbreak periods, through constructing a Cross-Regional-Gravitational-Dynamic model (CRGD).
-
Data on reported cases from December 9, 2021, to January 20, 2022, were collected from the website of the Shaanxi Provincial Health Commission (
http://sxwjw.shaanxi.gov.cn/ ). Demographic data and geographical distribution data were obtained from the Shaanxi Provincial Statistical Yearbook (http://tjj.shaanxi.gov.cn/upload/2021/zk/indexch.htm ). -
The inter-regional transmission mechanism of COVID-19 from Yanta District to its surrounding areas is similar to the attractiveness between a place and other surrounding places as described by the local gravity model. This study combined the transmission dynamics model with the local gravity model and used the Susceptible-Exposed-Infectious-Recovered (SEIR) model to form the overall framework of COVID-19 propagation. It adjusted relevant parameters according to the definition of the local gravity model (Figure 1). Specifically, our model is based on the following assumptions: 1) Only cross-regional transmission from Yanta District to other districts was considered, with consistent transmission across districts and different cross-regional transmission excluded; 2) The model divides the population into susceptible persons a (Sa), exposed persons a (Ea), infectious persons a (Ia), and recovered persons a (Ra) in Yanta District and susceptible persons i (Si), exposed persons i (Ei), infectious persons i (Ii), and recovered persons i (Ri) in other districts; 3) The coefficient of transmission rate in other regions and Yanta District are βi and βa, respectively. The coefficient of transmission rate across regions is βai; 4) ω is the latent coefficient; 5) Symptomatic patients are defined as removed persons after an infectious period of 1/γ; 6) Natural births, deaths, and deaths after illness of the population are not considered in this model for short time outbreak.
 Figure 1.
CRGD model framework of COVID-19 in Xi’an City.
Note: The arrows in the figure denote the transmission coefficient of Yanta District spreading to the surrounding areas, indicated by Gai, ${G}_{ai}=\int \left({N}_{ai}\cdot {K}_{ai}\cdot c\right)={\beta }_{ai}={\beta }_{a}\times \frac{{N}_{a}\times {N}_{i}}{{K}_{i}}\times c$; Na denotes the number of residents in Yanta District, Ni denotes the number of residents in other districts, Ki denotes the distance between Yanta District and each other district, and c is a constant, βai is proportional to the population size and inversely proportional to the distance, a denotes Yanta District, i denotes other District. Circle M denotes SEIR model, the size of the circle denotes the number of cases in this District, and the number (or a) after M denotes for Districts (a: Yanta District; 1: Beilin District; 2: Lianhu District; 3: Xincheng District; 4: Baqiao District; 5: Weiyang District; 6: Lintong District; 7: Gaoling District; 8: Yanliang District; 9: Lantian County; 10: Chang’an District; 11: Huyi District; 12: Zhouzhi County).
Abbreviation: COVID-19=coronavirus disease 2019; CRGD=Cross-Regional-Gravitational-Dynamic; SEIR=susceptible-exposed-infectious-recovered.
The equations of the model are as follows:
$$ \frac{d{S}_{a}}{dt}=-{\beta }_{a}{S}_{a}{I}_{a} $$ (1) $$ \frac{d{E}_{a}}{dt}={\beta }_{a}{S}_{a}{I}_{a}-\omega {E}_{a} $$ (2) $$ \frac{d{I}_{a}}{dt}=\omega {E}_{a}-\gamma {I}_{a} $$ (3) $$ \frac{d{R}_{a}}{dt}=\gamma {I}_{a} $$ (4) $$ \frac{d{S}_{i}}{dt}=-{\beta }_{i}{S}_{i}{I}_{i}-{\beta }_{ai}{S}_{i}{I}_{a} $$ (5) $$ \frac{d{E}_{i}}{dt}={\beta }_{i}{S}_{i}{I}_{i}+{\beta }_{ai}{S}_{i}{I}_{a}-\omega {E}_{i} $$ (6) $$ \frac{d{I}_{i}}{dt}=\omega {E}_{i}-\gamma {I}_{i} $$ (7) $$ \frac{d{R}_{i}}{dt}=\gamma {I}_{i} $$ (8) The values of the parameters in this study were taken from previous studies (9). We set the parameter of
$ \omega $ to 0.5, the parameter γ to 0.3 (10), and the parameters βi, βa, and βai were set from fitting and extrapolating the actual data. -
βai denotes the transmission coefficient of Yanta District spreading to the surrounding areas. Before the intervention, it conforms to the decay law of the gravity model (Gai) representing disease transmission, i.e., βai is proportional to the population size and inversely proportional to the distance. βai is calculated as follows: Na denotes the number of residents in Yanta District, Ni denotes the number of residents in other districts, Ki denotes the distance between Yanta District and each other district, and c is a constant. After the intervention, the cross-district transmission is blocked and βai is 0.
$$ {G}_{ai}=\int \left({N}_{ai} \cdot {K}_{ai} \cdot c\right)={\beta }_{ai}={\beta }_{a}\times \frac{{N}_{a}\times {N}_{i}}{{K}_{i}}\times c $$ (9) -
Before the intervention, βi is calculated by fitting actual reported data and transmission dynamics model curves. After the intervention, according to previous studies, the most effective prevention and control of the outbreak can be achieved when the transmissibility is reduced by 50% (5), accelerating the end of the epidemic. It is therefore assumed that the transmissibility within each district can be reduced by a factor of 50 after the intervention, as follows:
$$ {\beta }_{i}\text{'}={\beta }_{i}/50 $$ (10) -
According to a previous study (6), the effective reproductive number (Reff) can be used as an indicator to assess the transmissibility of COVID-19, as follows:
$$ {R}_{{eff}_{i/ai}}=\frac{{\beta }_{i/ai}\times {\mathrm{S}}_{i}}{\gamma } $$ (11) -
Three scenarios were hypothesized and simulated using the constructed model based on the possible time points for implementing prevention and control strategies for this outbreak in Xi’an. Scenario 1 is no intervention in all districts of Xi’an; Scenario 2 is a lockdown measure for all districts in the city on December 23 following lockdown measures for Yanta District on December 18; and Scenario 3 is a lockdown measure for all districts in the city on December 23. We used the software Berkeley Madonna (version 8.3.18, Copyright©1993–2001 Robert I. Macey & George F. Oster and developed by Robert Macey and George Oster of the University of California at Berkeley in USA.) to perform the curve fitting and simulation.
-
OpenGeoDa software (version 1.2.0, Copyright©2011–2020 Luc Anselin & Mark McCann and developed by Arizona State University, Phoenix, AZ, US) was used to calculate the global Moran’s I coefficient and detect the overall spatial autocorrelation. The range of Moran’s I coefficient is [–1, 1]. When the value is greater than 0, the spatial correlation is positive: the larger the value, the stronger the spatial clustering. When the value is less than 0, the spatial correlation is negative. The closer the value is to –1, the greater the spatial difference (the space itself is irrelevant). Of note, the significance of Moran’s I coefficient is based on the Z and P values.
-
From December 12, 2021 to January 13, 2022, there were 2,037 cases of this outbreak in Xi’an, and the outbreak lasted for 32 days. The outbreak involved a total of 11 districts. It was largely attributed to an intra-district spread in the Yanta District of Xi’an from December 10 to 18, 2021 before spreading to other areas of the city after December 18, 2021. According to the fitted and calculated equations, the coefficients of transmission rates and Reff within and across districts of Xi’an city without intensive interventions (
Supplementary Table S1 ).The assumptions of Scenario 1 resulted in a much larger outbreak of the epidemic than what actually occurred in real life. Scenario 1 simulated epidemic peaked on January 30, 2022, with a peak population of 493,212 cases, and the epidemic lasted for 175 days, ending on June 5, 2022. The cumulative number of simulated cases reached approximately 8,901,425. In other words, Scenario 1 was shown to be 99.98% less effective than the comprehensive prevention and control measures actually used in the real world Xi’an outbreak.
The assumptions of Scenario 2 resulted in a much smaller outbreak of the epidemic than what actually occurred in real life. Scenario 2 simulation results indicated that the epidemic in Xi’an would have peaked on December 23, 2021, with a peak number of 20 cases and an epidemic duration of 18 days, and would have ended on December 30, 2021, with a cumulative number of 178 cases. This represents a 91.26% reduction in the cumulative number of cases compared to the real world epidemic situation in Xi’an. In this simulated scenario, there were also no cases predicted to appear in Baqiao District, Huyi District, Lintong District, Xincheng District, or Yanliang District.
The assumptions of Scenario 3 resulted in a much smaller outbreak of the epidemic than what actually occurred in Xi’an in real life, although still showed a larger outbreak than Scenario 2. Scenario 3 assumed that if all areas of Xi’an were in direct lockdown on December 23, 2021, then this outbreak would be in all districts of the city on December 23, 2021. According to the results of this simulation, the epidemic in Xi’an would have peaked on December 23, 2021, with a peak number of 85 cases. The duration of the epidemic would have been 22 days, and the cumulative number of cases would have been 474 at the end of the epidemic on January 3, 2022. This simulated prevention and control strategy reduced the cumulative number of cases by 76.73% compared to the real world epidemic situation in Xi’an. In this simulated scenario, there were also no cases predicted to appear in Huyi District, Lintong District, or Yanliang District.
The epidemiological situations for the above three scenarios are shown in Table 1, Figure 2, and Figure 3.
Scenario Area Cumulative number
of casesCumulative attack
rate (%)Lasting time
(days)Time of peak number
of cases (m/d/y)Peak number
of casesScenario 1 Xi’an City 8,901,425 68.721 175 1/30/2022 493,212 Yanta District 1,880,632 91.783 109 1/30/2022 117,349 Baqiao District 732,590 71.752 131 2/4/2022 35,512 Beilin District 603,768 79.653 112 2/1/2022 34,201 Huyi District 108,750 18.847 163 2/6/2022 3,909 Lianhu District 907,175 89.026 108 1/30/2022 55,058 Lintong District 213,623 31.601 170 2/7/2022 7,554 Weiyang District 1,472,621 94.641 105 1/28/2022 95,543 Xixian New Area 1,088,536 83.438 120 2/2/2022 60,107 Xincheng District 402,634 65.151 117 2/2/2022 20,984 Yanliang District 11,066 3.652 106 2/4/2022 510 Chang’an District 1,479,973 93.315 106 1/29/2022 94,778 Scenario 2 Xi’an City 178 0.001 18 12/23/2021 20 Yanta District 38 0.002 11 12/18/2021 7 Baqiao District – – – – – Beilin District 3 0.001 7 12/18/2021 1 Huyi District – – – – – Lianhu District 17 0.002 13 12/23/2021 2 Lintong District – – – – – Weiyang District 48 0.003 16 12/23/2021 7 Xixian New Area 10 0.001 13 12/23/2021 2 Xincheng District – – – – – Yanliang District – – – – – Chang'an District 38 0.002 16 12/23/2021 6 Scenario 3 Xi’an City 474 0.004 22 12/23/2021 85 Yanta District 155 0.008 19 12/23/2021 26 Baqiao District 13 0.001 14 12/23/2021 3 Beilin District 23 0.003 15 12/23/2021 5 Huyi District – – – – – Lianhu District 47 0.005 16 12/23/2021 9 Lintong District – – – – – Weiyang District 101 0.007 18 12/23/2021 20 Xixian New Area 24 0.002 15 12/23/2021 5 Xincheng District 10 0.002 13 12/23/2021 2 Yanliang District – – – – – Chang'an District 80 0.005 18 12/23/2021 16 Note: “–” means no data. Table 1. Epidemiological results of interventions in Xi’an City and its sub-districts under three scenarios.
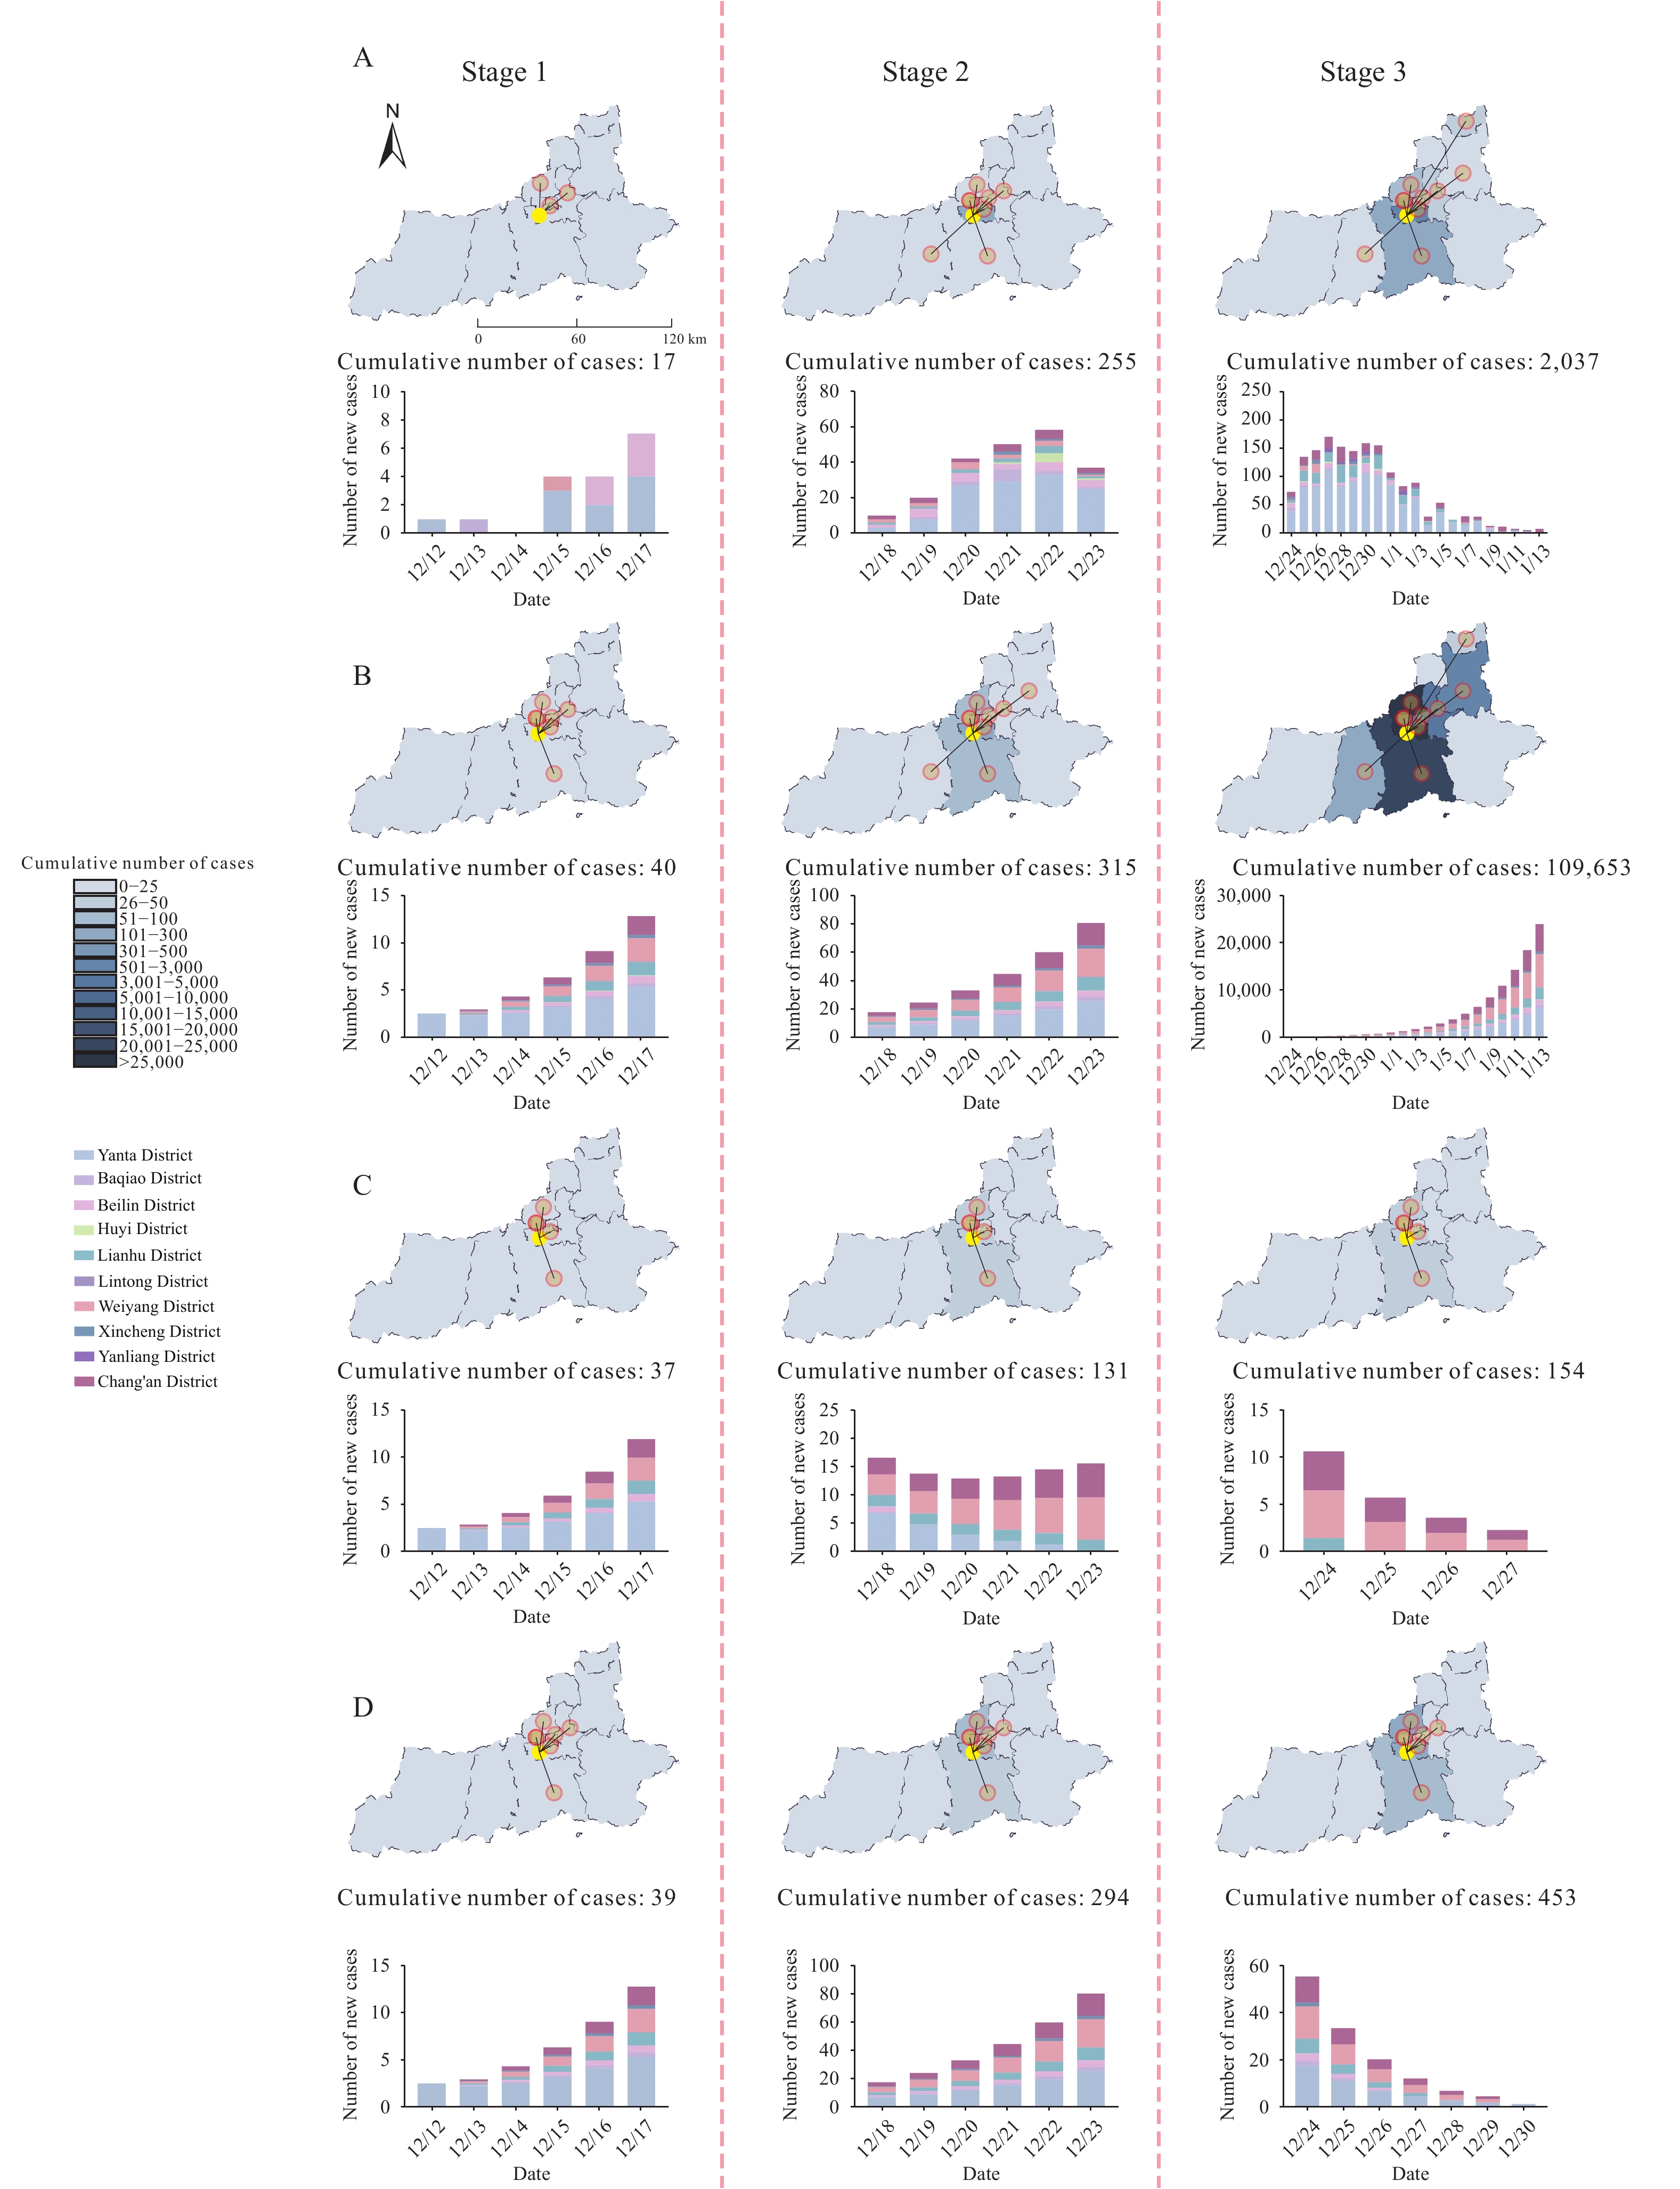 Figure 2.
Changes in cases at different stages of prevention and control in various districts of Xi’an under different scenarios. (A) Actual scenario; (B) Scenario 1; (C) Scenario 2; (D) Scenario 3.
Note: The trend of this epidemic is divided into 3 stages (Stage 1: before December 18, 2021; Stage 2: from December 18 to 23, 2021; Stage 3: after December 23, 2021). The yellow circle denotes the area where the COVID-19 outbreak started — Yanta District. Other circles denote the spread of COVID-19 from the Yanta district to other areas thereby causing other regional spread. Figure 3.
Curves of epidemic of different scenarios in Xi’an City and it's sub-districts. (A) Yanta District; (B) Baqiao District; (C) Beilin District; (D) Huyi District; (E) Lianhu District; (F) Lintong District; (G) Weiyang District; (H) Xixian New Area; (I) Xincheng District; (J) Yanliang District; (K) Chang’an District; (L) Xi’an District.
The global Moran’s I coefficients for COVID-19 in Xi’an from December 12, 2021 to January 13, 2022, were not significantly different (P>0.05), and the COVID-19 distribution showed no spatial correlation across the districts (
Supplementary Table S2 ). -
The cross-regional transmission model constructed in this study provides a method to assess the likelihood and epidemic scale of regional cluster outbreaks to neighboring regions based on previous transmission dynamic models as well as incorporates the local gravitational effects of disease transmission. The current epidemic status and containment scale of COVID-19 vary among countries, and modeling the impact of a new epidemic in one region on other regions allows relevant authorities to prepare medical stockpiles in advance to deal with epidemics in other countries. This assessment method can thus provide ideas for inter-regional movement and transmission of diseases, and provide a theoretical basis for the prevention and control of endemic diseases.
Combining the results of the incidence map and the global autocorrelation analysis in Xi’an, we found no spatial correlation between the differences in COVID-19 incidence in the various districts of Xi’an, implying that the cases were randomly distributed across the districts without regional aggregation. This suggested that cases were effectively managed and isolated between most districts in the early stages of the outbreak in Xi’an. Outbreaks in other districts were due to transmission and spread of individual cases from the Yanta District into the district resulting in transmission within the district, which is consistent with the simulation results of the CRGD model — where the transmissibility from the Yanta District into other districts was less than 1 and the transmissibility within each district was more than 1. The real world epidemiological response in Xi’an reduced the number of cases by 99.98% and the duration of the epidemic by 175 days compared to Scenario 1, indicating that the comprehensive interventions implemented in Xi’an were effective. However, Scenario 2 and Scenario 3 could reduce the cumulative number of cases by a further 91.26% and 76.73%, respectively, compared to the outbreak in real life. This indicates that if the first source of the epidemic (Yanta District) was blocked in time at the beginning of the epidemic, the scale of the further spread of epidemic could have been better prevented and the expected effect of preventing and controlling the epidemic could have been achieved. Also, if intra- and inter-regional transmission had been strictly controlled and blocked in all areas on December 23, 2021, it would have had a better control effect than how it spread in real life without these controls. This suggests that the implementation of outbreak control in Xi’an needs further improvement, and that timely two-way blockade control measures in the outbreak regions and potential spillover areas are key to avoiding cross-regional transmission. As such, these findings provide a compelling control strategy for avoiding cross-regional transmission in other areas in the future.
There were some limitations to this study. First, the number of cases collected in this paper was calculated based on the reported date, and thus may have overestimated the transmissibility of the district at the beginning of the outbreak by ignoring the occult transmission that had already occurred before the report. Second, since cross-transmission between districts is less likely after the adoption of blockade control in each district, this study only considered the spread of the disease from Yanta District to other districts; cross-transmission between other districts was not considered in this study, which may have overestimated the cross-district spread of the disease in Yanta District. Finally, future studies should also measure spatial stratified heterogeneity (SSH) to further interrogate the inter-regional transmission pattern of this and similar outbreaks (11-12). However, in terms of this study, a lack of detailed case locations due to data quality limitations would have led to spatial applicability issues in assessing epidemiological spatial distribution for the simulation results of the three scenarios selected for this study in particular, which is why SSH was not included. However, as the aim of this study was to provide a methodological study of cross-regional transmission of the risk of spillover from the epidemic source to other areas, non-inclusion of SSH did not have a major impact on the construction of this model or its resulting simulations.
-
No conflicts of interest.
-
Participants who provided the data and the field investigators who collected the data.
HTML
Data Collection
Model Framework


Pre- and Post-Intervention Cross-Regional Transmission Coefficients

Pre- and Post-Intervention Intra-Regional Transmission Coefficients

Quantitative Evaluation of Transmissibility

Scenario Setting
Global Spatial Autocorrelation Analysis
| Citation: |

|