

 Download:


-
Since its first report in South Africa on November 24, 2021, the severe acute respiratory syndrome coronavirus 2 (SARS-CoV-2) Omicron variant has rapidly replaced the Delta variant as the globally predominant variant. The mainland of China also reported the first case of Omicron variant infection on December 14, 2021, which was a closed-loop control entry traveler in Tianjin Municipality. As of January 15, 2022, local outbreaks of Omicron variant have occurred in 6 provincial-level administrative divisions (PLADs) in China, with a total of over 400 infections. The World Health Organization (WHO) briefing on January 15, 2022 reported that 58.5% of the gene sequences uploaded globally in the past 30 days were Omicron variant. Although the disease caused by the Omicron variant is relatively mild, the rapid increase in the number of cases can still put a heavy strain on global health systems.
Existing studies have shown that the Omicron variant has a stronger transmissibility than the Delta variant. Jiahui Chen et al. conducted a comprehensive quantitative analysis using an artificial intelligence model and found that the Omicron variant’s infectiousness and immune evasion ability were about twice those of the Delta variant (1). Hiroshi Nishiura et al. modeled and analyzed the substitution process of the dominant variant in Gauteng, South Africa, and found that the effective reproduction number of the Omicron variant was about 4.2 times that of the Delta variant, and its transmission was 3.3 times that of the Delta variant (2). Li Zhang et al. analyzed the sensitivity of 28 serum samples from coronavirus disease 2019 (COVID-19) convalescent patients infected with the SARS-CoV-2 original strain and found that the Omicron variant had a more significant immune evasion ability against immune protection caused by infection or even by vaccine (3).
The XXIV Winter Olympic Games (WOG) were held in Beijing from February 4 to February 20, 2022. At that time, Yanqing District of Beijing and Zhangjiakou of Hebei Province welcomed many foreigners. Although the domestic epidemic has been relatively under control, the Omicron variant has the world. Considering the evasion ability of Omicron variant against existing vaccines, the entry of a large number of foreign personnel undoubtedly posed a huge challenge to the epidemic prevention and control work within the closed-loop management of the Beijing 2022 WOG.
If the number of secondary cases generated during the Beijing 2022 WOG can be reasonably estimated, preparations for epidemic prevention and control can be made in advance to avoid wider spread of the epidemic. The purpose of this paper is to establish an improved dynamics model of the spread of COVID-19 to analyze the spread of the epidemic within the closed-loop management during the Beijing 2022 WOG.
-
According to the relevant regulations in the “Beijing 2022 Winter Olympics and Paralympic Games Athletes and Accompanying Officials Epidemic Prevention Manual (Second Edition)” (4), during the Beijing 2022 WOG, all Olympic-related personnel were under closed-loop management. Closed-loop management implements strict epidemic prevention and control measures, including vaccination, social distancing, daily nucleic acid testing, etc. Based on the closed-loop management policy of the Beijing 2022 WOG, we proposed the following assumptions:
1) We divided all Olympic-related personnel into two subgroups. One part was inbound personnel, including foreign athletes and their entourages, foreign media reporters, foreign referees, and volunteers, etc.; the other part was domestic local personnel, including domestic athletes and their entourage, domestic volunteers, referees and related service personnel, etc.
2) We assumed that there was some degree of admixture between the two populations: a) the spread of the epidemic between the two groups of people was affected by this parameter, and b) the spread within the two groups of people was not affected by this parameter.
3) We assume that a certain percentage of exposed people were not detected, and that all infected people could be detected.
Based on the above assumptions, we established an improved model of the transmission dynamics of COVID-19. The model divides the population of Olympic-related personnel into the following seven compartments: susceptible among inbound personnel (
${S_1}$ ), exposed among inbound personnel (${E_1}$ ), infected among inbound personnel (${I_1}$ ), susceptible among domestic natives (${S_2}$ ), exposed among domestic natives (${E_2}$ ), infected among domestic natives (${I_2}$ ), quarantined ($Q$ ), recovered ($R$ ). Its dynamics flowchart is shown in Figure 1. The red box indicates that the compartment is infectious, and the blue box indicates that the compartment is not infectious.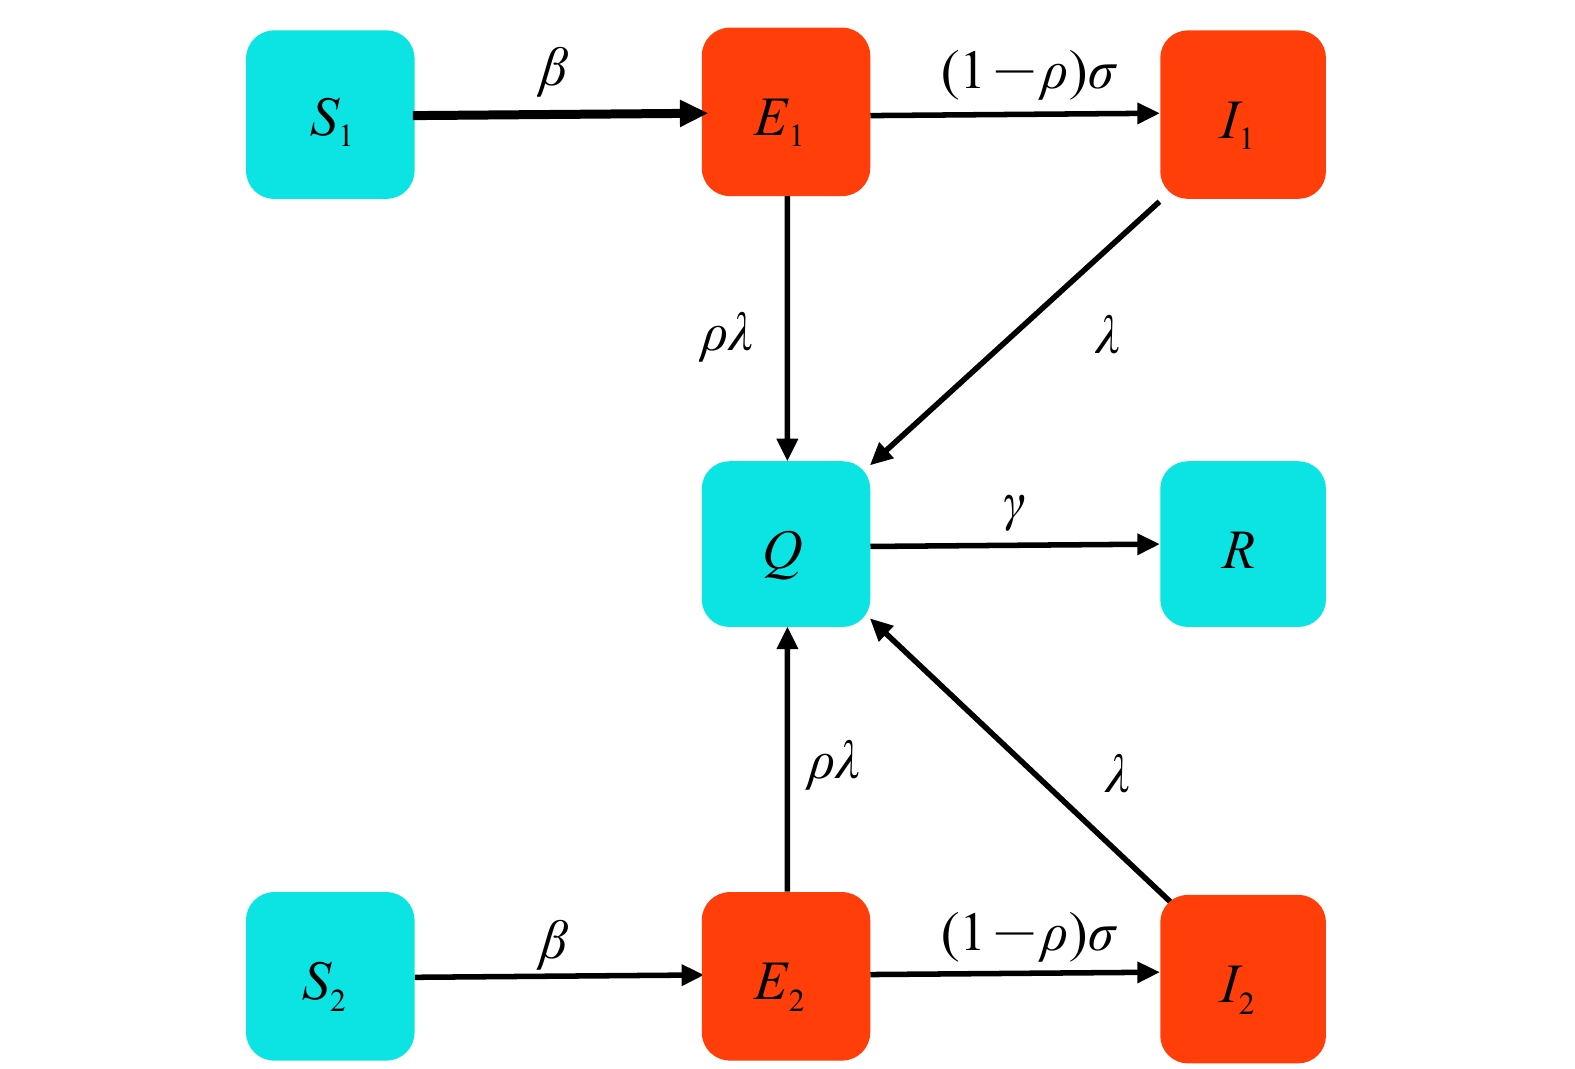 Figure 1.
Improved COVID-19 transmission flowchart.
Abbreviation: COVID-19=coronavirus disease 2019.The corresponding transmission dynamics equations were constructed as follows.
$$ {\left\{ \begin{gathered} \frac{{d{S_1}}}{{dt}} = - \beta {S_1}\left( {{E_1} + {I_1}} \right) - \beta {S_1}\left( {1 - \theta } \right)\left( {{E_2} + {I_2}} \right) \\ \frac{{d{E_1}}}{{dt}} = \beta {S_1}\left( {{E_1} + {I_1}} \right) + \beta {S_1}\left( {1 - \theta } \right)\left( {{E_2} + {I_2}} \right) - \rho \lambda {E_1} - \left( {1 - \rho } \right)\sigma {E_1} \\ \frac{{d{I_1}}}{{dt}} = \left( {1 - \rho } \right)\sigma {E_1} - \lambda {I_1} \\ \frac{{d{S_2}}}{{dt}} = - \beta {S_2}\left( {{E_2} + {I_2}} \right) - \beta {S_2}\left( {1 - \theta } \right)\left( {{E_1} + {I_1}} \right) \\ \frac{{d{E_2}}}{{dt}} = \beta {S_2}\left( {{E_2} + {I_2}} \right) + \beta {S_2}\left( {1 - \theta } \right)\left( {{E_1} + {I_1}} \right) - \rho \lambda {E_2} - \left( {1 - \rho } \right)\sigma {E_2} \\ \frac{{d{I_2}}}{{dt}} = \left( {1 - \rho } \right)\sigma {E_2} - \lambda {I_2} \\ \frac{{dQ}}{{dt}} = \rho \lambda \left( {{E_1} + {E_2}} \right) + \lambda \left( {{I_1} + {I_2}} \right) - \gamma Q \\ \frac{{dR}}{{dt}} = \gamma Q \\ \end{gathered} \right. }$$ (1) The explanation of relevant parameters is shown in Table 1.
Parameter Definition Value Source β Base spread rate 7.440×10⁻⁹ Estimated σ Exposure to infected conversion rate 0.227 (5) λ Conversion rate from testing positive to being quarantined 2.000 (4) ρ Proportion of exposed persons detected 0.500–0.900 −* γ Recovery rate for quarantined people 0.200 Estimated θ Degree of admixture between the two populations 0.500–0.900 −* * These two parameters need to be adjusted manually in the analysis. Table 1. Explanation of relevant parameters in system (1).
The disease state compartments in system (1) are
${E_1}$ ,${I_1}$ ,${E_2}$ ,${I_2}$ ,$Q$ . To calculate the control regeneration number of system (1), we take$$ \begin{aligned} & {F}=\left( {\begin{array}{*{20}{c}} {\beta {S_1}\left( {{E_1} + {I_1}} \right) + \beta {S_1}\left( {1 - \theta } \right)\left( {{E_2} + {I_2}} \right)} \\ 0 \\ {\beta {S_2}\left( {{E_2} + {I_2}} \right) + \beta {S_2}\left( {1 - \theta } \right)\left( {{E_1} + {I_1}} \right)} \\ 0 \\ 0 \end{array}} \right), \\ & {V}= \left( {\begin{array}{*{20}{c}} {\rho \lambda {E_1} + \left( {1 - \rho } \right)\sigma {E_1}} \\ { - \left( {1 - \rho } \right)\sigma {E_1} + \lambda {I_1}} \\ {\rho \lambda {E_2} + \left( {1 - \rho } \right)\sigma {E_2}} \\ { - \left( {1 - \rho } \right)\sigma {E_2} + \lambda {I_2}} \\ { - \rho \lambda \left( {{E_1} + {E_2}} \right) - \lambda \left( {{I_1} + {I_2}} \right) + \gamma Q} \end{array}} \right). \end{aligned}$$ (2) The Jacobian matrices of F and V are obtained as
$$ \begin{aligned} & F = \left( {\begin{array}{*{20}{c}} {\beta {S_1}}&{\beta {S_1}}&{\beta {S_1}\left( {1 - \theta } \right)}&{\beta {S_1}\left( {1 - \theta } \right)}&0 \\ 0&0&0&0&0 \\ {\beta {S_2}}&{\beta {S_2}}&{\beta {S_2}\left( {1 - \theta } \right)}&{\beta {S_2}\left( {1 - \theta } \right)}&0 \\ 0&0&0&0&0 \\ 0&0&0&0&0 \end{array}} \right), \\ & V = \left( {\begin{array}{*{20}{c}} {\rho \lambda + \left( {1 - \rho } \right)\sigma }&0&0&0&0 \\ { - \left( {1 - \rho } \right)\sigma }&\lambda &0&0&0 \\ 0&0&{\rho \lambda + \left( {1 - \rho } \right)\sigma }&0&0 \\ 0&0&{ - \left( {1 - \rho } \right)\sigma }&\lambda &0 \\ { - \rho \lambda }&{ - \lambda }&{ - \rho \lambda }&{ - \lambda }&\gamma \end{array}} \right). \end{aligned} $$ (3) The control reproduction number is the spectral radius of the matrix
$ F{V}^{-1} $ at the disease-free equilibrium point${P^ * }{\text{ = }}\left( {S_1^ * \;0\;0\;S_2^ * \;0\;0\;0\;{R^ * }} \right)$ . Therefore, the control regeneration number is$$ {{R}_C} = \frac{{\beta \left( {S_1^ * + \left( {1 - \theta } \right)S_2^ * } \right)\left( {\lambda + \left( {1 - \rho } \right)\sigma } \right)}}{{\lambda \left( {\rho \lambda + \left( {1 - \rho } \right)\sigma } \right)}}. $$ (4) -
Given the dynamics parameters of system (1) and the initial population of all compartments, we predicted the daily increase in the number of quarantined persons (
$Q$ ). According to the actual situation, we assumed that the initial value of each compartment in system (1) is$$\begin{aligned} & \left( {{S_1}(0)\;{E_1}(0)\;{I_1}(0)\;{S_2}(0)\;{E_2}(0)\;{I_2}(0)\;Q\;R} \right) =\\ &\left( {30000\;10\;0\;37000\;0\;0\;0\;0} \right). \end{aligned} $$ (5) The initial value of the exposed persons among inbound personnel (
${E_1}(0)$ ) changed in the subsequent analysis. When the initial value of each compartment was fixed, we analyzed the influence of the proportion of exposed persons being detected ($\rho $ ) and the degree of admixture between the two populations ($\theta $ ) on quarantined persons. As shown in Figure 2, when$\rho $ ,$\theta $ varied between 0.5 and 0.9, the daily increase of$Q$ hardly changed, and the final size remained between 46 and 47. Fitted data seeSupplementary Table S1 . From the predicted results, it can be seen that these two parameters have a certain influence on the daily new number of people and the final size of$Q$ . However, since the magnitude of the total number of people in the closed-loop management of the Beijing 2022 WOG was not high, it has little impact on the absolute number of$Q$ . Figure 2.
The comparison chart of the daily new number of people of quarantined persons (
$Q$ ) with respect to the changes of the parameters$\rho $ ,$\theta $ .When the dynamics parameters of the system (1) were fixed, we analyzed the impact of the initial value of the exposed among inbound personnel (
${E_1}(0)$ ) on the quarantined persons. As shown in Figure 3, assuming$\rho$ =0.9 and$\theta$ =0.9, when${E_1}(0)$ changes between 10, 20, and 30, the daily new number of$Q$ increases significantly. Fitted data seeSupplementary Table S2 . According to Figure 3, we can see that when${E_1}(0)$ increases by 10 people, the final scale of$Q$ increases by about 50 people, so there is an obvious positive linear relationship between${E_1}(0)$ and the final scale of$Q$ .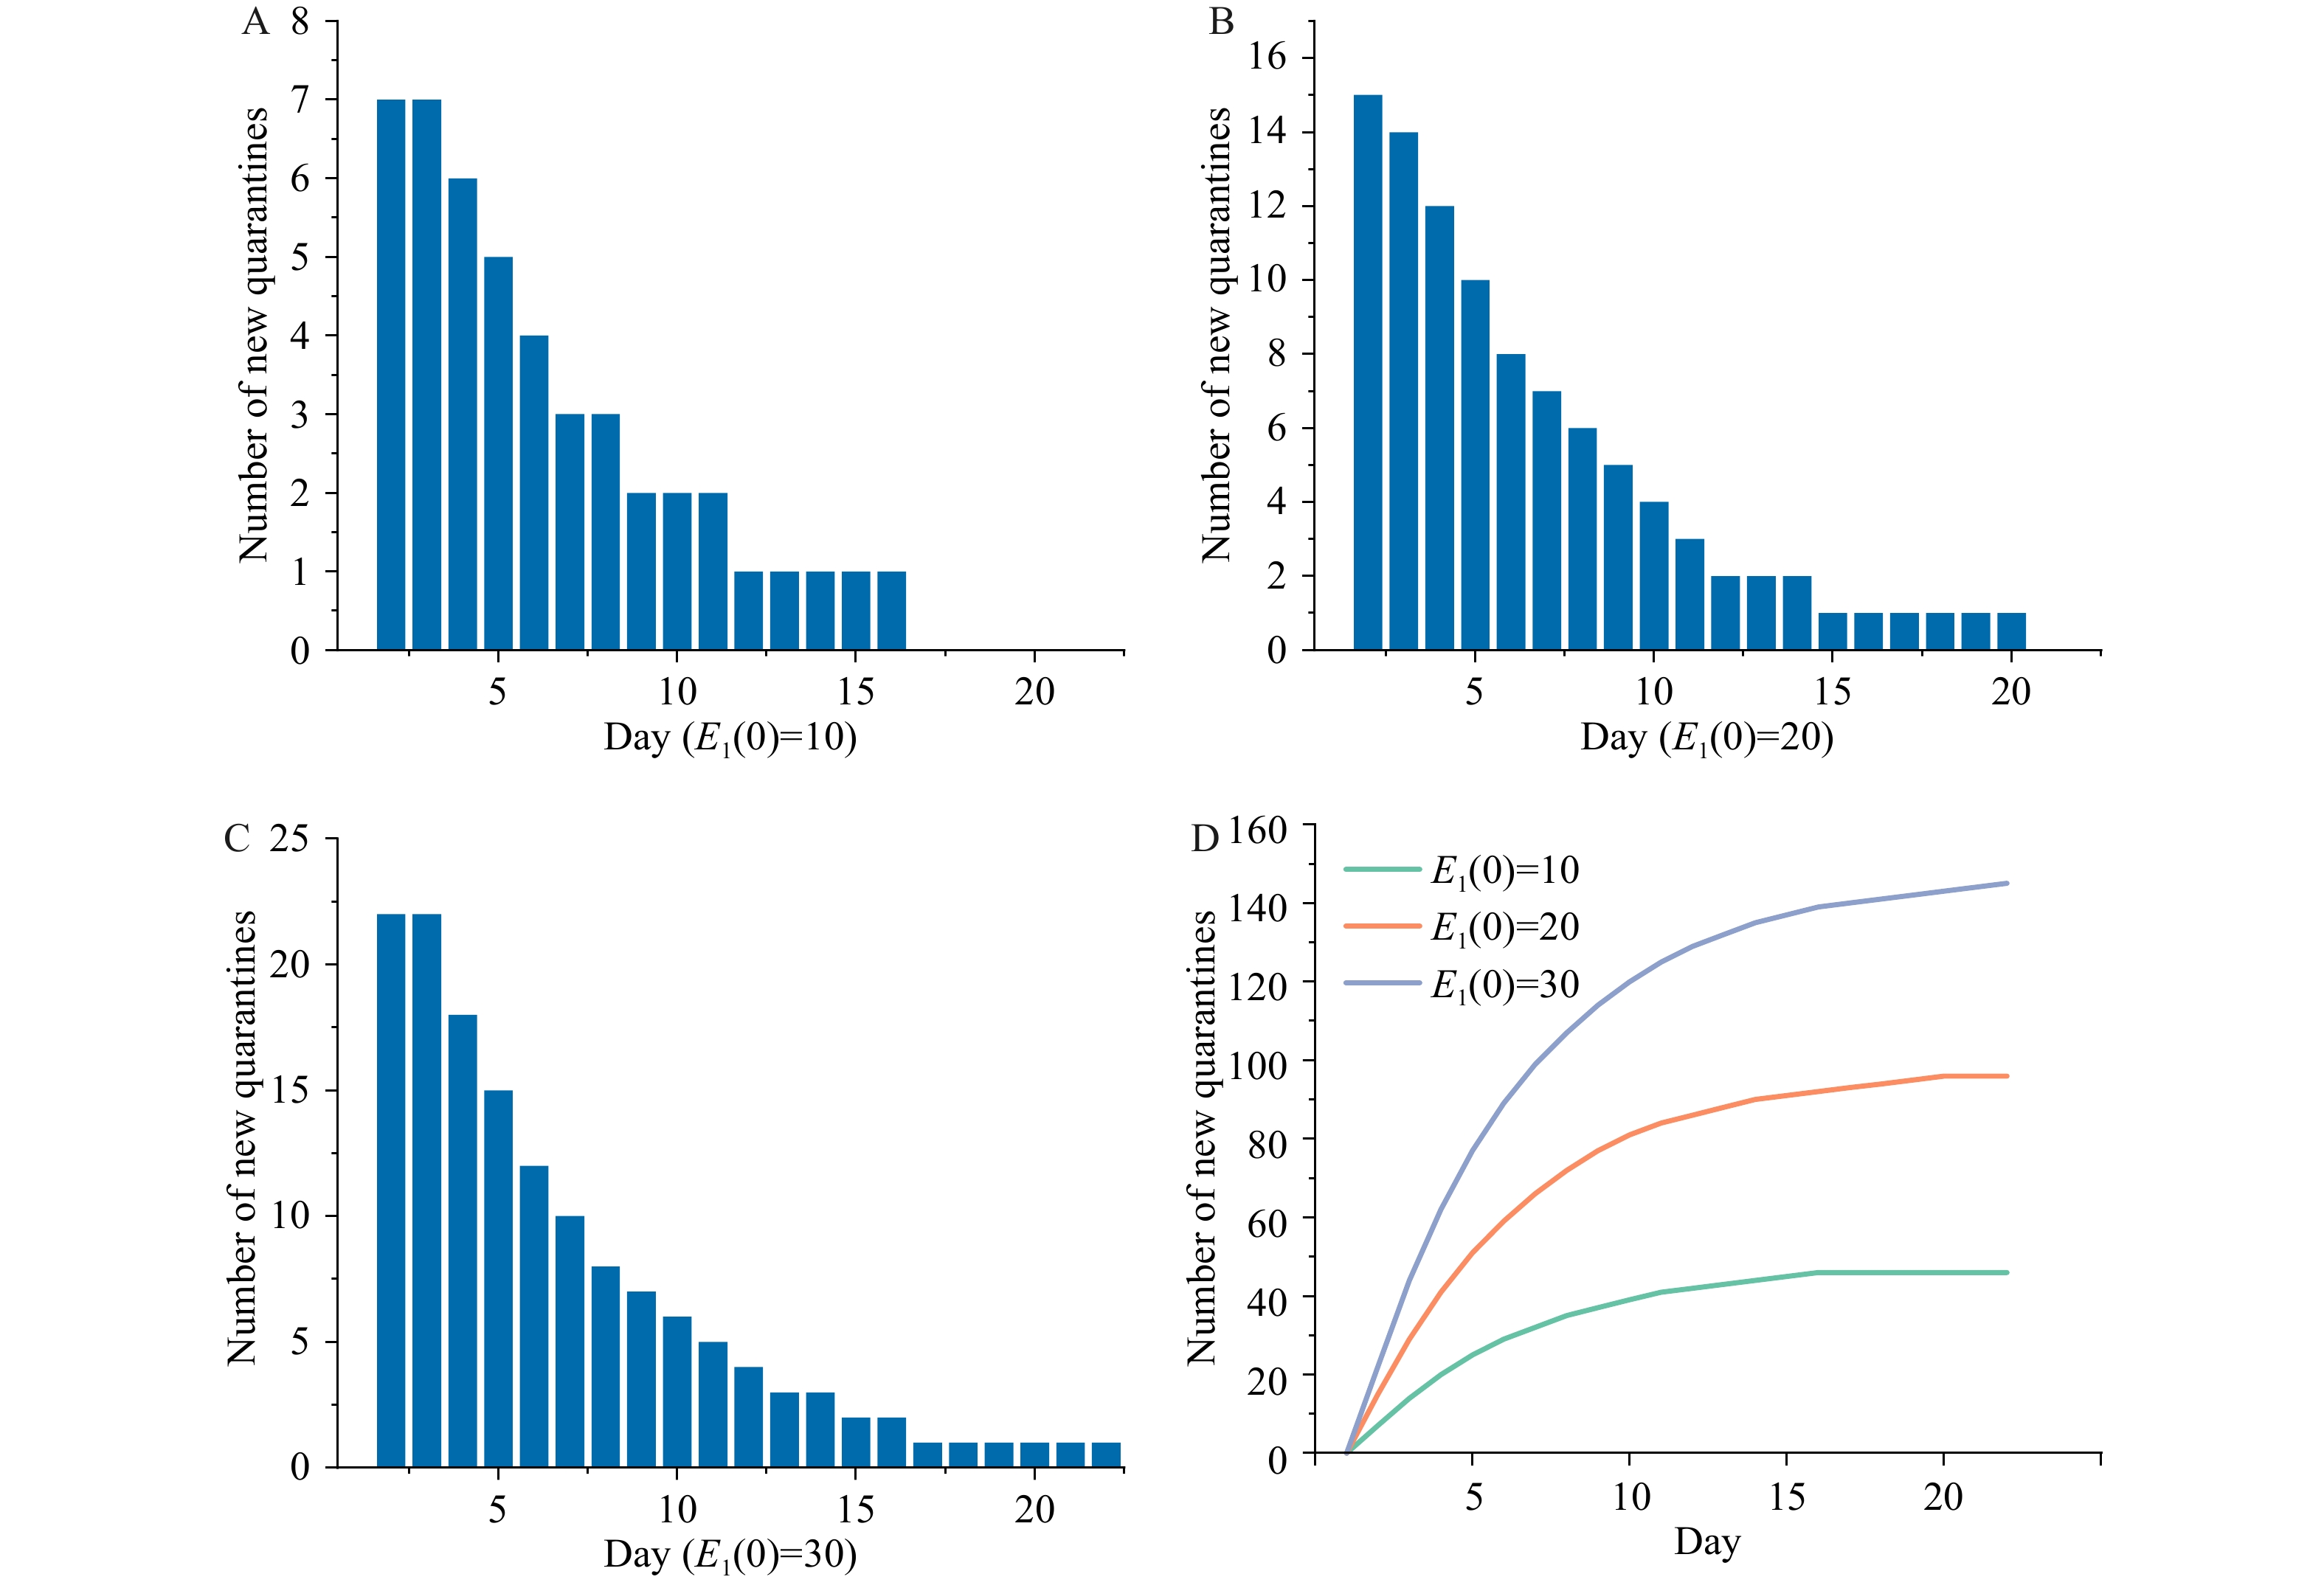 Figure 3.
The comparison chart of the daily new number of people and the final size of quarantined persons (
$Q$ ) with respect to the changes of the${E_1}(0)$ . (A) The daily new prediction results of quarantined persons with${E_1}(0){\text{=}}10$ ; (B) The daily new prediction results of quarantined persons with${E_1}(0){\text{=}}20$ . (C) The daily new prediction results of quarantined persons with${E_1}(0){\text{=}}30$ . (D) The change of the cumulative amount of quarantined persons, when${E_1}(0)$ takes different values. -
From the predicted results, we can see that compared with the parameters
$\rho $ ,$\theta $ , the initial value of the exposed among inbound personnel (${E_1}(0)$ ) had a more obvious impact on the system (1). This showed that for the epidemic prevention and control within the closed-loop management of the Beijing 2022 WOG, the most effective method was to control the initial number of exposed among inbound personnel. This requires relevant departments to make full preparations for the entry of foreign personnel and try to detect potential virus carriers among inbound personnel at the initial stage as much as possible.Potential transmission from domestic audiences is not considered in our model. According to press releases from the Beijing Winter Olympics Organizing Committee, the audience policy has been adjusted from the method of public sales of tickets to the targeted organization of audiences to watch the game on site. Considering the strict epidemic prevention measures during the Beijing 2022 WOG, it is difficult to have significant contact between audiences, athletes, and staff. Therefore, for domestic audience groups, only the spread of the epidemic within the group needs to be considered. In addition, the spread of the epidemic due to the environment is not included in our model. Taking into account the prevention and control measures in closed-loop management, as long as sufficient disinfection work is done, the spread caused by the environment can be effectively limited. Finally, epidemic prevention measures are not as strict outside the closed-loop, so it is necessary to avoid the occurrence of epidemic spillovers from inside the loop to outside.
According to the final actual effect, the epidemic prevention and control of the Beijing Winter Olympics was quite successful. We can make a horizontal comparison with the Tokyo Olympics. During the entire operation cycle of the Tokyo Olympics, outbreaks of epidemics occurred in various regions of Japan. However, during and after the operation cycle of the Beijing Winter Olympics, there was no outbreak of the epidemic in Beijing and related areas, which shows that the closed-loop management policy has a very significant effect on epidemic control.
This study also has some limitations. The Beijing Winter Olympics is a very complex process, so our model can only roughly describe the actual situation and cannot make accurate data predictions. In addition, our research can only stay in the qualitative analysis stage because there is no real data to support it.
HTML


| Citation: |

|