
 Download:


-
Ambient air pollution and temperature are leading environmental challenges to global public health. In 2019, PM2.5 was responsible for an estimated 4.14 million deaths and 118 million disability-adjusted life years (DALYs) (1). Temperature is an important predictor of many diseases and has been perceived as a key environmental factor in climate change scenarios (2). Air pollution was identified as the fourth leading risk factor for death worldwide (3). Short-term exposure to PM2.5 can increase the risk of death from chronic diseases (4).
In the context of climate change, health risk assessment of the joint effect of air pollution and temperature has attracted growing public concern (5). In Chengdu, China for example, stronger associations between air pollution and hospital admission for chronic obstructive pulmonary disease (COPD) were found at low-temperatures than at moderate temperatures (6). However, other studies have failed to identify synergetic health effects of air pollution and temperature. For example, Jhun and co-authors found that the interaction between ozone and temperature was not statistically significant in 97 US cities (7). In addition, potential variations of exposure-response patterns under various temperature levels have been less well documented. As an extension of distributed lag models, the varying-coefficient distributed lag model has been flexibly applied to explore interactive and time-lagged effects between different exposure hazards (8).
We aimed to establish the exposure-response association between PM2.5 and mortality at different temperature strata using the varying coefficient distributed lag model in Guangzhou, China, and to explore synergetic mortality risks from PM2.5 and temperature on vulnerable populations.
-
The study period was 2013–2020. We obtained daily mortality data in Guangzhou from Guangzhou Center for Disease Control and Prevention. Causes of death were classified according to International Classification of Diseases, Tenth Revision: non-accidental causes (A00–R99), cardiovascular disease (I00–I99), ischemic heart disease (IHD, I20–I25), stroke (I60–I69), respiratory disease (J00–J98), and COPD (J40–J47). Daily counts of non-accidental deaths were stratified by age (<75 and ≥75 years), gender, and educational level (≤9 and >9 years). We obtained daily concentrations of air pollutants (O3, PM2.5, PM10, NO2, SO2, and CO) from Guangzhou monitoring stations and daily meteorological data from basic weather stations in Guangzhou from the China Meteorological Data Service Center (
http://data.cma.cn/ ).The varying coefficient distributed lag model, based on generalized linear models with a quasi-Poisson family (9), was used to estimate the modifying effect of temperature on the association between PM2.5 and mortality. We incorporated several covariates in the model: a natural cubic spline with 7 degrees of freedom (df) per year for a time variable; a natural cubic spline with 3 df for relative humidity, air pressure, and moving average temperature (with time lags of 0–10 days); and holidays and day of the week as indicator variables. The cross-product of categorical temperature levels [low (<25th percentile), medium (25th–75th), and high (>75th percentile)] and PM2.5 was used to examine the interaction between air pollution and temperature. In addition, stratified analyses were conducted by gender, age group, and education. Relative differences of RRs across strata [relative risk ratios (RRR)] were calculated to detect potential effect modifications by temperature. To verify the robustness of our results, we performed a series of sensitivity analyses. Details of the model are provided in the
Supplementary Material . All statistical analyses were conducted in the R language environment (R Core Team 2021, Vienna, Austria) using the “dlnm”, “mgcv”, and “splines” packages. -
Table 1 depicts summary statistics on daily air pollution, weather conditions, and mortality. The average PM2.5 value was 35.1 μg/m3 during 2013–2020. During the study period, there were 403,492 deaths registered in Guangzhou, among which cardiovascular diseases, IHD, stroke, respiratory disease, and COPD accounted for 39.5%, 16.7%, 10.3%, 14.4%, and 6.1%, respectively.
Variable Mean Minimum Percentiles Maximum 25th 50th 75th Temperature (℃) 22.2 3.4 17.4 23.3 27.3 32.0 Low (<25th) 13.6 4.6 11.8 14.0 15.8 17.7 Medium (25th–75th) 23.1 17.8 20.7 23.3 25.7 27.3 High (>75th) 28.9 27.4 27.9 28.8 29 .6 31.9 Mean humidity (%) 80.4 31.0 75.0 81.5 88.0 100.0 Mean pressure (hPa) 1,007.1 985.7 1,000.3 1,005.4 1,010.8 3,276.6 PM2.5 (μg/m³) 35.1 3.5 20.0 30.0 45.0 150.0 Cause (Number of deaths per day) Non-accidental 131 79 115 128 143 238 Cardiovascular disease 55 21 45 53 62 115 Ischemic heart disease 23 6 18 22 27 51 Stroke 14 0 11 14 17 34 Respiratory disease 20 6 15 19 24 48 COPD 8 0 6 8 11 30 Abbreviation: COPD=chronic obstructive pulmonary disease. Table 1. Summary statistics for daily weather conditions, air pollution, and mortality in Guangzhou, 2013–2018.
Supplementary Figure S1 shows Spearman’s correlations between air pollution and weather conditions. There were negative correlations between temperature and relative humidity and air pollutants (except for O3) and positive correlations among air pollutants.Figure 1 shows lag patterns of PM2.5 on cause-specific mortality at different temperature levels. Effect of PM2.5 on the daily death toll of different diseases had consistent and evident trends in which mortality risks reached maximum within 1–2 lag days of exposure, then leveled off, and disappeared within 4–5 days.
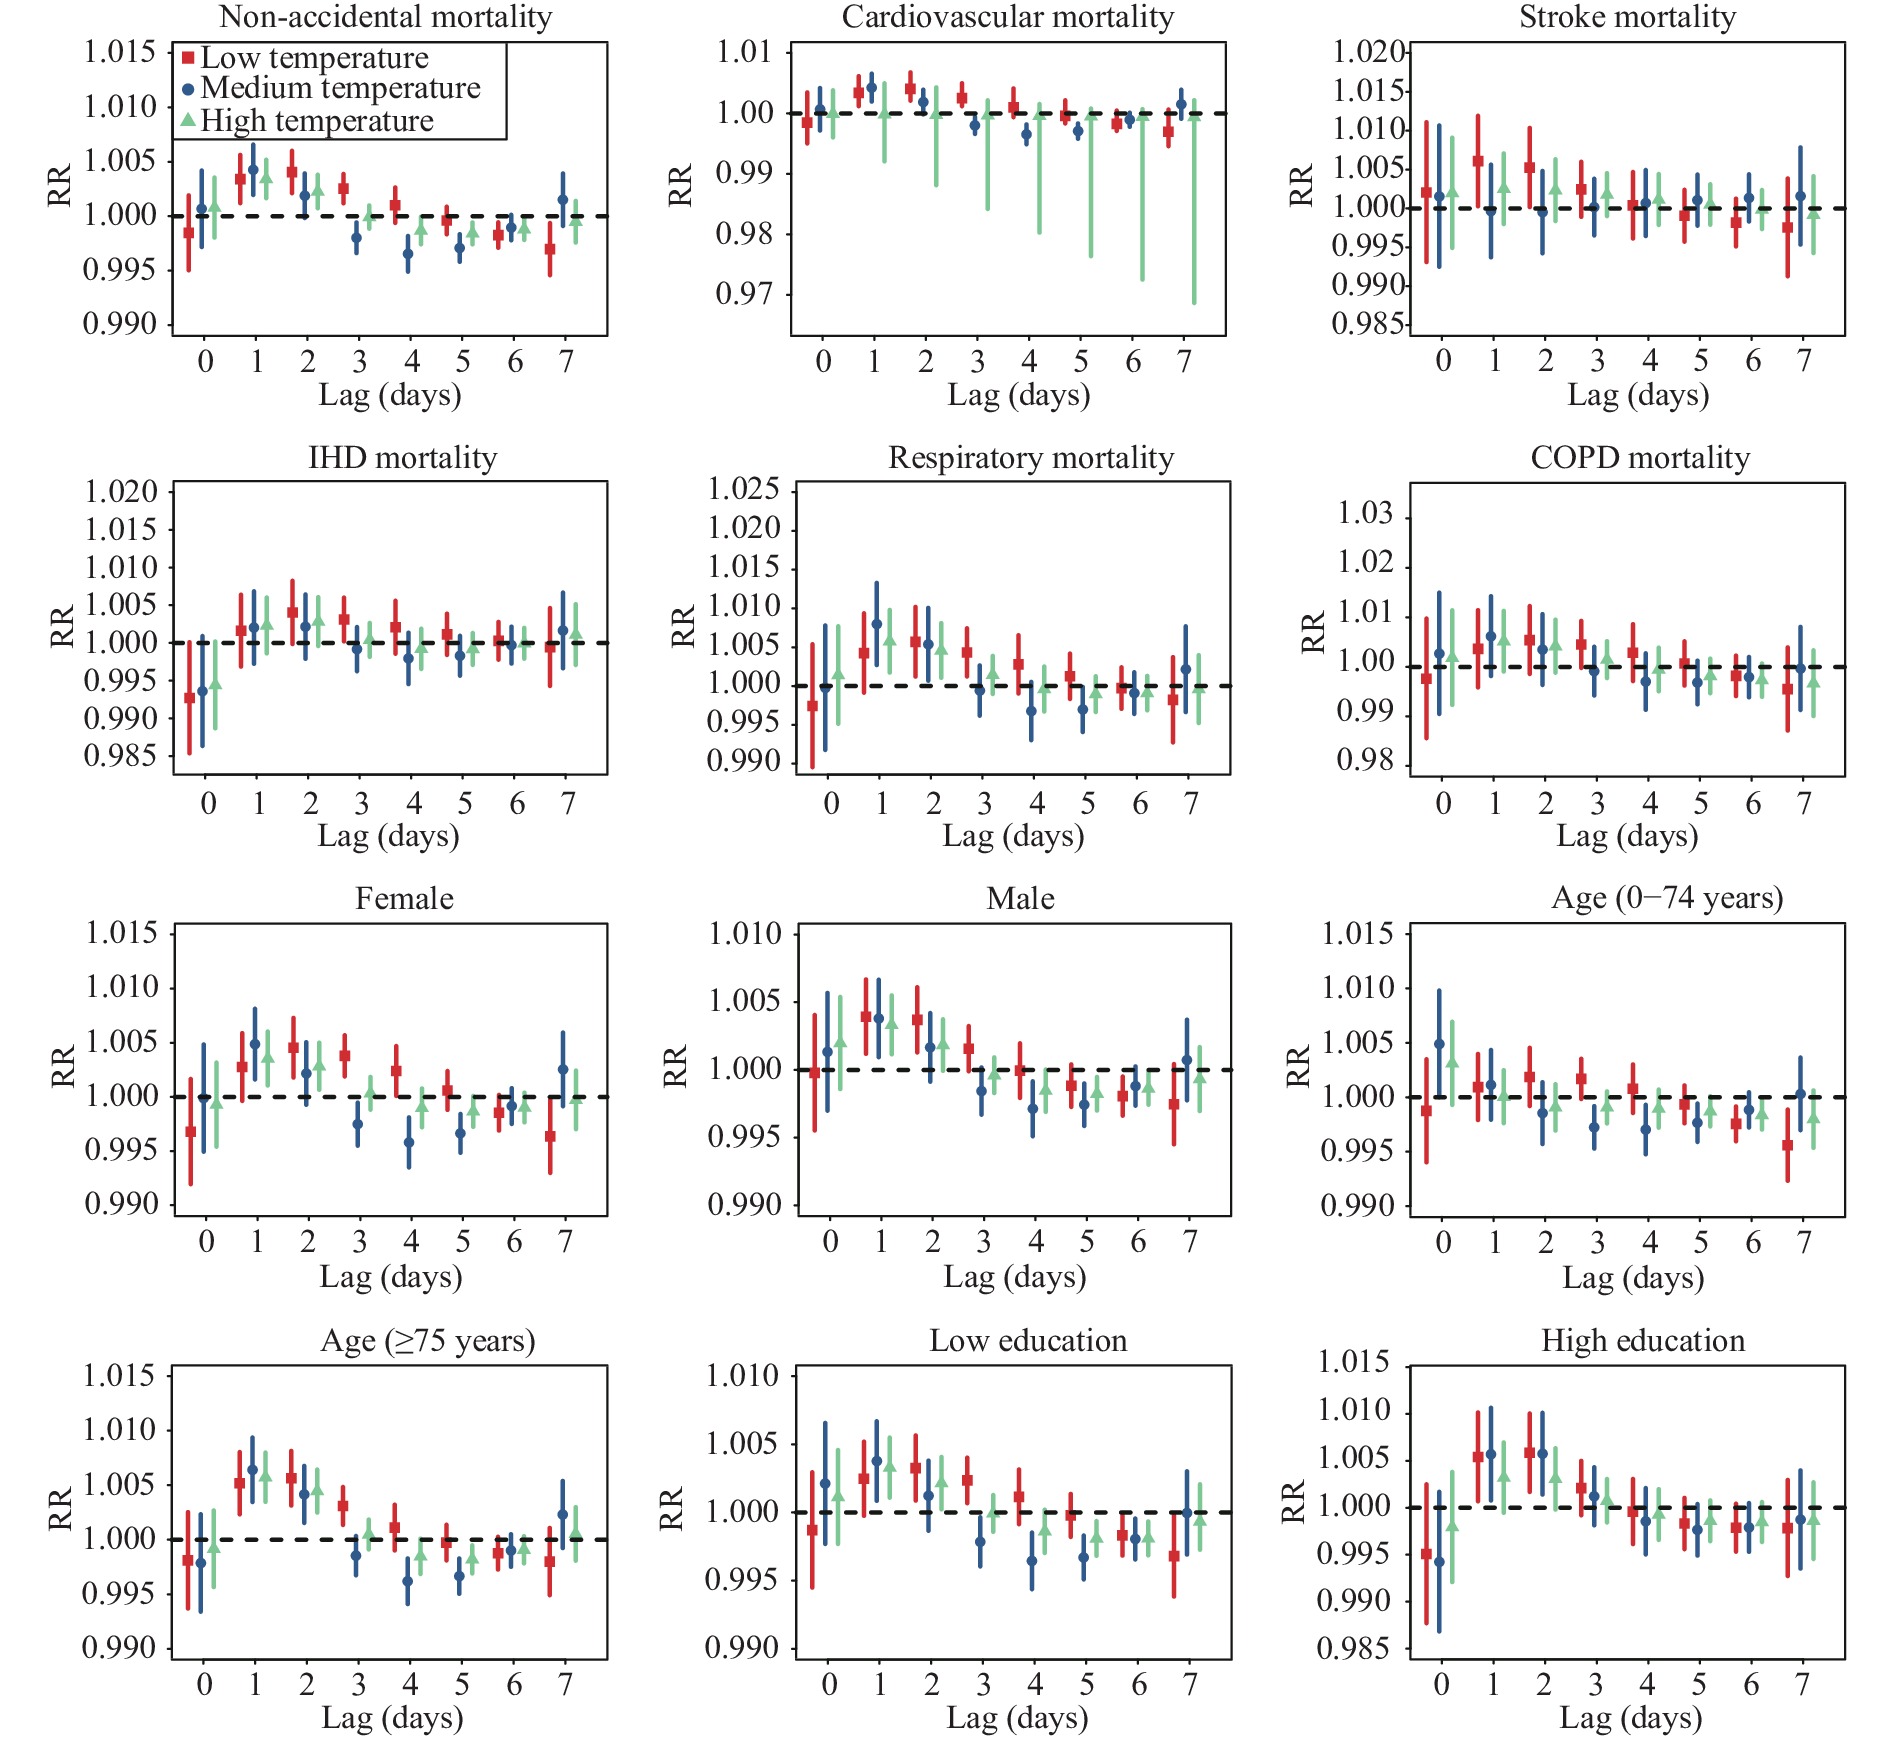 Figure 1.
RR (95% CI) of mortality associated with 10 μg/m3 increase of PM2.5 by a time lag of 0–7 days.
Note: dots and vertical lines represent point estimates and 95% confidence intervals of PM2.5 at individual lag days.
Abbreviations: RR=relative risk; IHD=ischemic heart disease; COPD=chronic obstructive pulmonary disease; CI=confidence interval.
Figure 2 shows the estimates of exposure-response relationships between PM2.5 and mortality at different temperature levels. We found approximately linear associations between PM2.5 and mortality. The highest effect estimates of PM2.5 on mortality were consistently observed at the lower temperatures, while lower effect estimates were seen at the higher temperatures. Each 10 μg/m³ increase of PM2.5 in low, medium, and high temperature strata was associated with respective increments of 0.73% [95% confidence interval (CI): 0.38%, 1.09%], 0.12% (95% CI: −0.27%, 0.52%), and 0.46% (95% CI: 0.11%, 0.81%) in non-accidental mortality (Table 2). There was an RRR of 1.01 (95% CI: 1.00, 1.01) between low and medium temperatures (P=0.02) (
Supplementary Table S1 ). For cause-specific mortality, statistically significant differences between the risk of PM2.5 across temperature levels were only observed for cardiovascular mortality, with effect estimates of 0.88% (95% CI: 0.37%, 1.39%), 0.04% (95% CI: −0.52%, 0.60%) and 0.50% (95% CI: 0.00%, 0.99%) at low, medium and high temperature levels (Table 2), and an RRR of 1.01 (95% CI: 1.00, 1.02) between low temperature and medium temperature (P=0.03). The highest effect of PM2.5 was found in respiratory mortality at low temperatures, with an effect estimate of 1.57% (95% CI: 0.75%, 2.39%); however, difference by temperature was not statistically significant.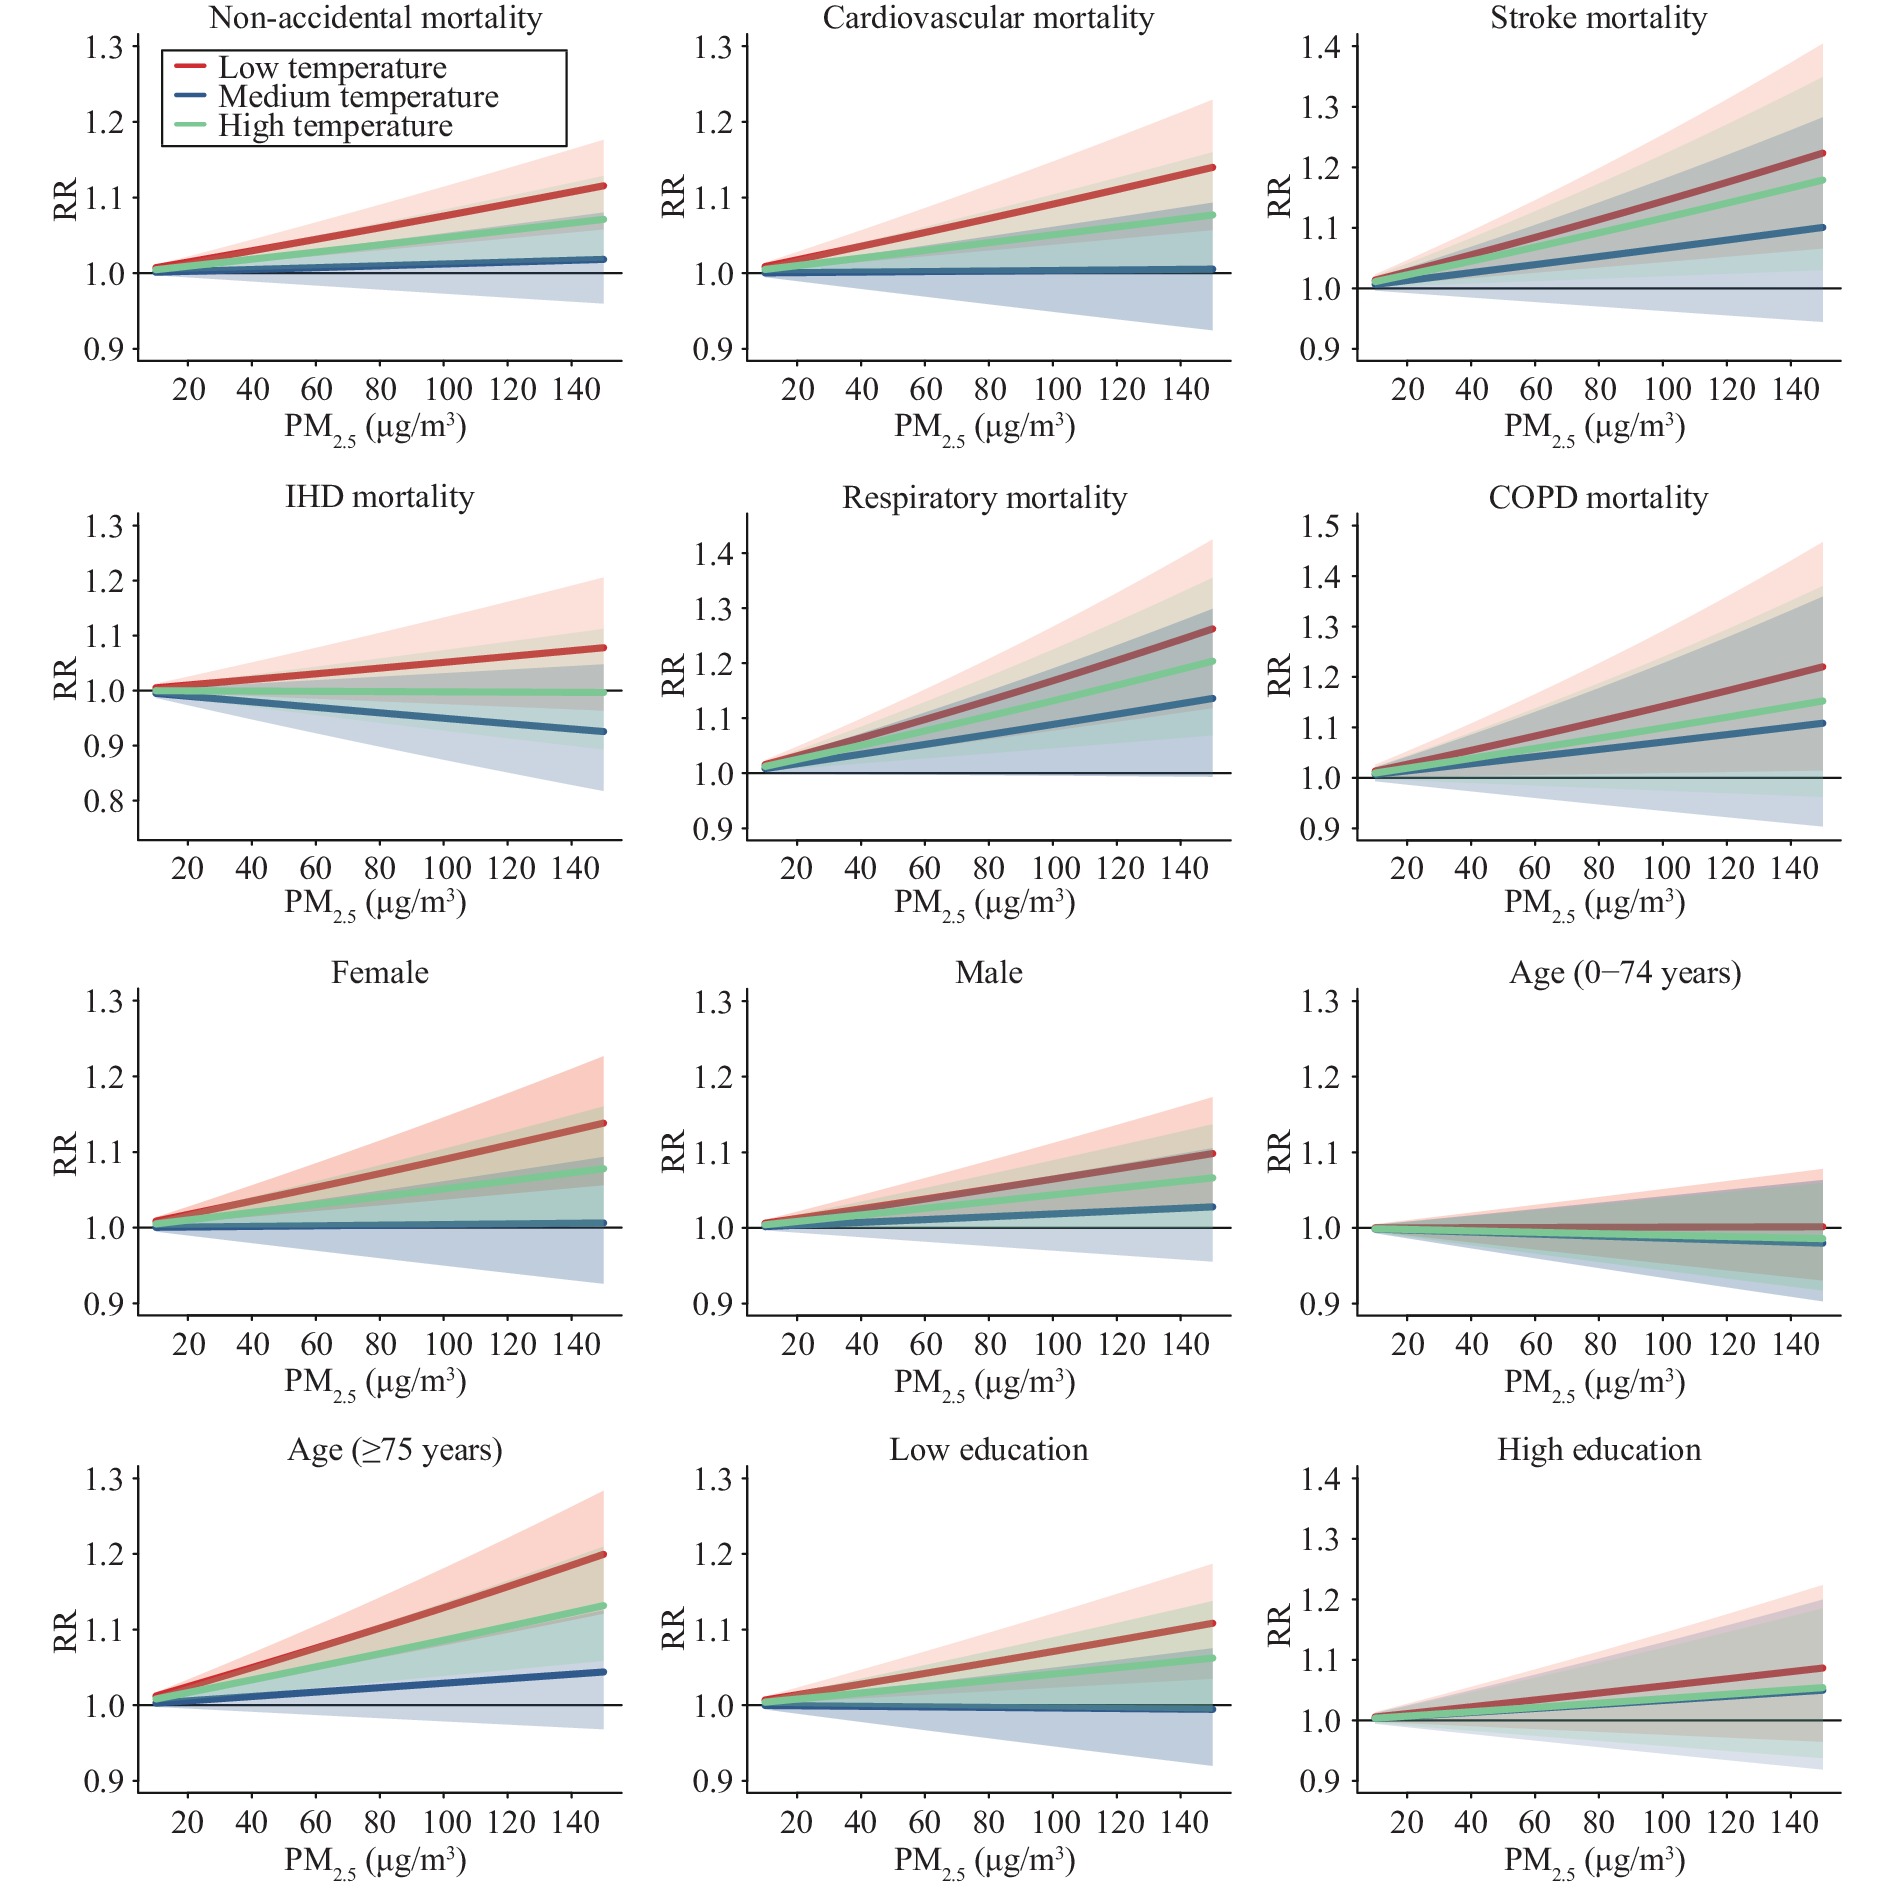 Figure 2.
Concentration-response associations between PM2.5 and mortality under different temperature conditions.
Abbreviations: RR=relative risk; IHD=ischemic heart disease; COPD=chronic obstructive pulmonary disease.Variable Low temperature Medium temperature High temperature ER% 95% CI ER% 95% CI ER% 95% CI Non-accidental mortality 0.73* (0.38, 1.09)* 0.12 (−0.27, 0.52) 0.46* (0.11, 0.81)* Cardiovascular mortality 0.88* (0.37, 1.39)* 0.04 (−0.52, 0.60) 0.50* (0.00, 0.99)* Stroke mortality 1.35* (0.43, 2.29)* 0.64 (−0.38, 1.67) 1.10* (0.20, 2.02)* Ischemic heart mortality 0.50 (−0.25, 1.25) −0.52 (−1.33, 0.31) −0.02 (−0.64, 0.77) Respiratory mortality 1.57* (0.75, 2.39)* 0.85 (−0.04, 1.76) 1.24* (0.45, 2.05)* COPD mortality 1.34* (0.10, 2.59)* 0.69 (−0.67, 2.07) 0.95 (−0.26, 2.17) Gender Female 0.87* (0.37, 1.37)* 0.04 (−0.51, 0.60) 0.50* (0.01, 1.00)* Male 0.63* (0.19, 1.07)* 0.18 (−0.30, 0.67) 0.43* (0.00, 0.86)* Age (years) 0–74 0.01 (−0.48, 0.50) −0.13 (−0.68, 0.41) −0.09 (−0.57, 0.39) ≥75 1.22* (0.76, 1.68)* 0.29 (−0.22, 0.79) 0.83* (0.38, 1.28)* Education Low education 0.69* (0.23, 1.15)* −0.04 (−0.56, 0.48) 0.40 (−0.05, 0.86) High education 0.55 (−0.24, 1.35) 0.32 (−0.56, 1.22) 0.32 (−0.43, 1.14) Abbreviations: ER=excess risk; CI=confidence interval; COPD=chronic obstructive pulmonary disease.
* indicates statistically significant results.Table 2. Cumulative (lag 0–4 days) mortality risk of each 10 μg/m³ increase in PM2.5 at different temperature strata (ER, 95% CI).
In analyses stratified by personal characteristics, we found consistently higher effects of PM2.5 at low temperatures compared with medium temperatures, but the only statistically significant difference was among individuals of 75 years or older. Each 10 μg/m³ increase of PM2.5 in the low, medium, and high temperature strata was associated with increments of 1.22% (95% CI: 0.76%, 1.68%), 0.29% (95% CI: −0.22%, 0.79%), and 0.83% (95% CI: 0.38%, 1.28%) in mortality of the elderly, respectively, with RRR of 1.01 (95% CI: 1.00, 1.02) between low and medium temperature strata (P=0.01). The elderly were more susceptible to PM2.5 compared with younger age groups under both low and high temperature conditions.
Using different degrees of freedom for time trend analyses adjusting for co-pollutants changed the effect estimates only slightly (
Supplementary Tables S2 –S3 ), indicating robustness of our main results. Using different temperature cutoffs (Supplementary Table S4 ) and different PM2.5 time-lags (Supplementary Table S5 ) did not remarkably change the estimates of temperature-stratified air pollution effects on mortality. -
To the best of our knowledge, this is one of the few studies exploring exposure-response associations between air pollution and mortality under different temperature conditions. Our study consistently observed greater mortality risks from PM2.5 in lower temperatures than in moderate temperatures across different causes of death. Interaction effects between PM2.5 and low temperatures were more pronounced in the elderly than in younger people.
We observed the highest effect of PM2.5 on mortality in low temperature strata compared with high and medium temperature strata. Low temperatures have consistently been found to enhance the effect of PM2.5 on cardiovascular mortality in Beijing (10), natural and respiratory mortality in Hong Kong (11), and COPD mortality in Chengdu (6). For instance, Li and coauthors found that each 10 μg/m³ increment of PM2.5 during the lowest temperature range was associated with a 1.27% (95% CI: 0.38%, 2.17%) increase in cardiovascular mortality, compared with 0.59% (95% CI: 0.22%, 1.16%) across the whole temperature range (10). Likewise, the association between PM2.5 and mortality in Hong Kong was stronger at low temperatures than at higher temperatures, with corresponding effect estimates of 0.94% (0.95% CI: 0.65%, 1.24%) and 0.47% (95% CI: 0.65%, 1.24%) for each 10 μg/m³ increment in PM2.5 (11). The reduced beat frequency of nose and trachea cilia on cold days, which affects the clearance rate of particulate matter and makes people more susceptible to PM2.5, is suspected as an underlying mechanism for the greater effect of PM2.5 on mortality at low temperatures in Guangzhou (12). Some studies found that people living in warm regions probably experience a higher mortality risk during cold weather than do people living in cold regions (13). In addition, low temperatures may exacerbate airway inflammation and increase the burden on respiratory functions (14).
We also found relatively higher effect estimates of PM2.5 on mortality in high temperatures compared to moderate temperatures, although the difference was not statistically significant, consistent with previous studies (6,10). However, another study reported a statistically significant higher health effect of PM2.5 in high temperature strata (15). The discrepant results may be explained by differences in population structure and air pollution exposure patterns.
In this study, we observed a significant modification of the effect of PM2.5 on cardiovascular mortality by low temperatures. As ambient temperature decreases, cold receptors in the skin are stimulated, the sympathetic nervous system increases catecholamine levels, blood vessels near the skin constrict to reduce heat loss, and blood pressure suddenly increases (10). High blood pressure can lead to oxygen deficiency, myocardial ischemia, or arrhythmia, and become a risk factor for vascular spasms and ruptures of atherosclerotic plaque that cause thromboses (12). Such marked changes make people more susceptible to adverse cardiovascular outcomes caused by PM2.5. The findings are important from a public health perspective, as 39.5% of all non-accidental deaths in Guangzhou were cardiovascular deaths.
Our analysis also found significant interaction effects of PM2.5 and low temperature among the elderly but not among young people, which is consistent with a previous study (6). The body’s homeostasis and thermoregulatory functions, and the capacity to eliminate chemicals from the body decrease with age (16), which may contribute to the combined health hazards of PM2.5 and temperature change. The elderly also suffer from higher rates of comorbidities, which may further enhance their vulnerability to environmental exposure.
The study was subject to some limitations. First, we substituted measured air pollution and air temperature at fixed outdoor monitoring stations for personal exposures, which will lead to some exposure measurement errors. Second, only adverse associations of PM2.5 were examined in this study, leaving confounding by other factors unexplored. Last, our results may not generalize to areas with different population structures and air pollution compositions.
In summary, we observed an interaction between PM2.5 and low temperature on mortality, especially for non-accidental and cardiovascular mortality and among the elderly. Considering the synergetic health risks of air pollution and temperature, cooperation from multiple sectors with the aim of protecting vulnerable populations may mitigate health challenges from climate change and air pollution.
HTML
| Citation: |

|