
 Download:


-
The National Free Antiretroviral Therapy Program has been scaled-up since 2003 in China, resulting in a remarkable reduction of human immunodeficiency virus or acquired immune deficiency syndrome (HIV/AIDS)-related morbidity and mortality (1). With wide coverage of antiretroviral therapy (ART), a certain degree of HIV drug resistance was anticipated. The prevalence of pretreatment drug resistance (PDR) ranges from 3.5% to 25.8% in various countries (2). PDR surveillance was conducted among individuals prior to initiating ART in 31 provincial-level administrative divisions (PLADs) of China in 2018 (2018 PDR survey). The prevalence of PDR was at a moderate level and was relatively high in regions with higher HIV/AIDS burdens. This study analyzed the follow-up data after one year of ART among individuals with and without PDR in order to investigate the effect of PDR and other risk factors on the virological response of ART in China. The main finding was that the overall virological failure (viral load ≥1,000 copies/mL) in participants in this study was 10.1% after one year of ART, and individuals with PDR of non-nucleoside reverse transcriptase inhibitors (NNRTIs) had an even higher risk of virological failure. This study therefore provided further information and valuable references for optimizing regimens.
According to the 2014 World Health Organization (WHO) surveillance guidelines for HIV PDR and the pilot work using HIV resistance surveys in some regions of China in 2017 (3-4) and based on a cross-sectional survey of PDR in 31 PLADs in 2018, a one-year prospective follow-up survey of ART was conducted in 2019. In the 2018 PDR survey (source population of 5,151 people), 352 individuals with PDR were detected (cases), then those without PDR (controls) were selected according to a 1∶2 individual matching scheme at the same time. All individuals had to be aged 18 years or older. Individuals in case and control groups were followed up with after one-year of ART. While among individuals with PDR, 35 patients never started ART, 42 patients did not start ART immediately and therefore did not complete one year of ART by the follow-up appointment, 104 patients did not have a viral load test at the follow-up appointment, and 23 patients were unable to receive follow-up at all. In the end, this study included 464 participants, of whom 148 individuals had PDR. Institutional review board approval was granted by the National Center for AIDS/STD Control and Prevention and the Chinese Center for Disease Control and Prevention. Informed consent was obtained from all participants involved in the study. Plasma samples were also collected, and the HIV viral load was measured. Virological failure was defined as HIV RNA viral load ≥1,000 copies/mL one year after treatment initiation. HIV genotype drug resistance tests were performed on plasma samples from all subjects before ART, and from individuals with virological failure after one-year of ART. The outcome variable was virological failure (viral load ≥1,000 copies/mL). All the demographic and clinical characteristics were included in univariate logistic regression analyses. Variables with P<0.1 were entered multivariable logistic regression analyses. In addition, PDR was stratified by all antiretroviral drugs (ARVs), ARV classes, and specific ARVs. The SAS (version 9.4, SAS Institute, Cary, NC, USA) was used to conduct all analyses. Two-sided P<0.05 was considered statistically significant.
A total of 464 participants (148 and 316 individuals with and without PDR, respectively) were included in this study (Table 1), of which 47.8% and 45.7% of the participants were infected through heterosexual and homosexual contact, respectively. The proportions of participants with CRF01_AE, CRF07_BC, and CRF08_BC HIV-1 strains were 33.8%, 36.0%, and 12.5%, respectively. The initial ART regimen for 81.3% of participants was tenofovir (TDF) and lamivudine (3TC) in combination with efavirenz (EFV) or nevirapine (NVP). Individuals with and without PDR were comparable in age, gender, education level, HIV infection route, initial ART regimen, and CD4 cell counts before ART, and there was no statistically significant difference.
Variable No. of participants,
n (%)No. of individuals
with PDR, n (%)No. of individuals
without PDR, n (%)Total 464 (100.0) 148 (100.0) 316 (100.0) Age (years) 18–29 108 (23.3) 23 (15.5) 85 (26.9) 30–39 119 (25.6) 43 (29.1) 76 (24.1) 40–49 96 (20.7) 34 (23.0) 62 (19.6) ≥50 141 (30.4) 48 (32.4) 93 (29.4) Gender Male 385 (83.0) 125 (84.5) 260 (82.3) Female 79 (17.0) 23 (15.5) 56 (17.7) Ethnicity Han 401 (86.4) 123 (83.1) 278 (88.0) Other 63 (13.6) 25 (16.9) 38 (12.0) Education Illiterate 18 (3.9) 5 (3.4) 13 (4.1) Primary and junior middle school 226 (48.7) 77 (52.0) 149 (47.2) Senior middle school and higher 206 (44.4) 61 (41.2) 145 (45.9) Missing 14 (3.0) 5 (3.4) 9 (2.8) Route of HIV infection Heterosexual 222 (47.8) 72 (48.6) 150 (47.5) Homosexual 212 (45.7) 65 (43.9) 147 (46.5) Injection drug use 11 (2.4) 3 (2.0) 8 (2.5) Other 17 (3.7) 7 (4.7) 10 (3.2) Missing 2 (0.4) 1 (0.7) 1 (0.3) Subtype CRF01_AE 157 (33.8) 48 (32.4) 109 (34.5) CRF07_BC 167 (36.0) 53 (35.8) 114 (36.1) CRF08_BC 58 (12.5) 20 (13.5) 38 (12.0) CRF55_01B 19 (4.1) 13 (8.8) 6 (1.9) B 28 (6.0) 4 (2.7) 24 (7.6) Other 35 (7.5) 10 (6.8) 25 (7.9) Initial ART regimen AZT+3TC+EFV/NVP 57 (12.3) 20 (13.5) 37 (11.7) AZT+3TC+LPV/r 9 (1.9) 2 (1.4) 7 (2.2) TDF+3TC+EFV/NVP 377 (81.3) 120 (81.1) 257 (81.3) TDF+3TC+LPV/r 16 (3.4) 6 (4.0) 10 (3.2) Other 5 (1.1) 0 (0.0) 5 (1.6) CD4 cell count before initial ART regimen (cells/mm3) 0–199 168 (36.2) 50 (33.8) 118 (37.3) 200–349 147 (31.7) 48 (32.4) 99 (31.3) 350–499 92 (19.8) 28 (18.9) 64 (20.3) ≥500 54 (11.6) 21 (14.2) 33 (10.4) Missing 3 (0.6) 1 (0.7) 2 (0.6) Missed doses in the past month No 283 (61.0) 87 (58.8) 196 (62.0) Yes 36 (7.8) 12 (8.1) 24 (7.6) Unknown 145 (31.2) 49 (33.1) 96 (30.4) Abbreviations: PDR=pretreatment drug resistance; HIV=human immunodeficiency virus; CRF=circulating recombinant form; ART=antiretroviral therapy; AZT=Zidovudine; 3TC=Lamivudine; EFV=Efavirenz; NVP=Nevirapine; LPV/r=Lopinavir/r; TDF=Tenofovir. Table 1. Demographic and clinical characteristics of participants with and without PDR.
Based on the HIV genotype drug resistance analysis, 148 individuals were shown to have PDR. Among them, 8.8% (13/148) of the participants were resistant to nucleoside reverse-transcriptase inhibitors (NRTIs), which carried M184VI (2.7%, 4/148), T215ANS (2.7%, 4/148), and other drug resistance mutations (Figure 1A). 59.5% (88/148) of the participants were resistant to NNRTIs. For NNRTIs, E138AGK (33.8%, 50/148) was the most common PDR mutation, and other frequent PDR mutations included V179DE (23.0%, 34/148), K103NQR (14.2%, 21/148), and V106MI (6.1%, 9/148). E138AGK caused low-level reductions in susceptibility to rilpivirine (RPV), the combination of V179DE and E138G synergistically acted to reduce EFV, NVP, and RPV susceptibility at a low level, and the combination of V179DE and other NNRTIs drug resistance mutations caused intermediate- or high-level reductions in susceptibility to EFV and NVP. There were 12.8% and 15.5% of participants that showed high-level PDR to EFV and NVP, respectively (Figure 1B). 35.8% (53/148) of the participants were resistant to protease inhibitors (PIs), and the main mutations were M46LI (14.2%, 21/148) and Q58E (17.6%, 26/148). After one-year of ART, 33 (7.1%, 33/464) patients had drug-resistant mutations. Among them, 21 patients had PDR before ART and 12 did not. 6.5% (30/464) of patients were mainly resistant to NNRTIs after ART.
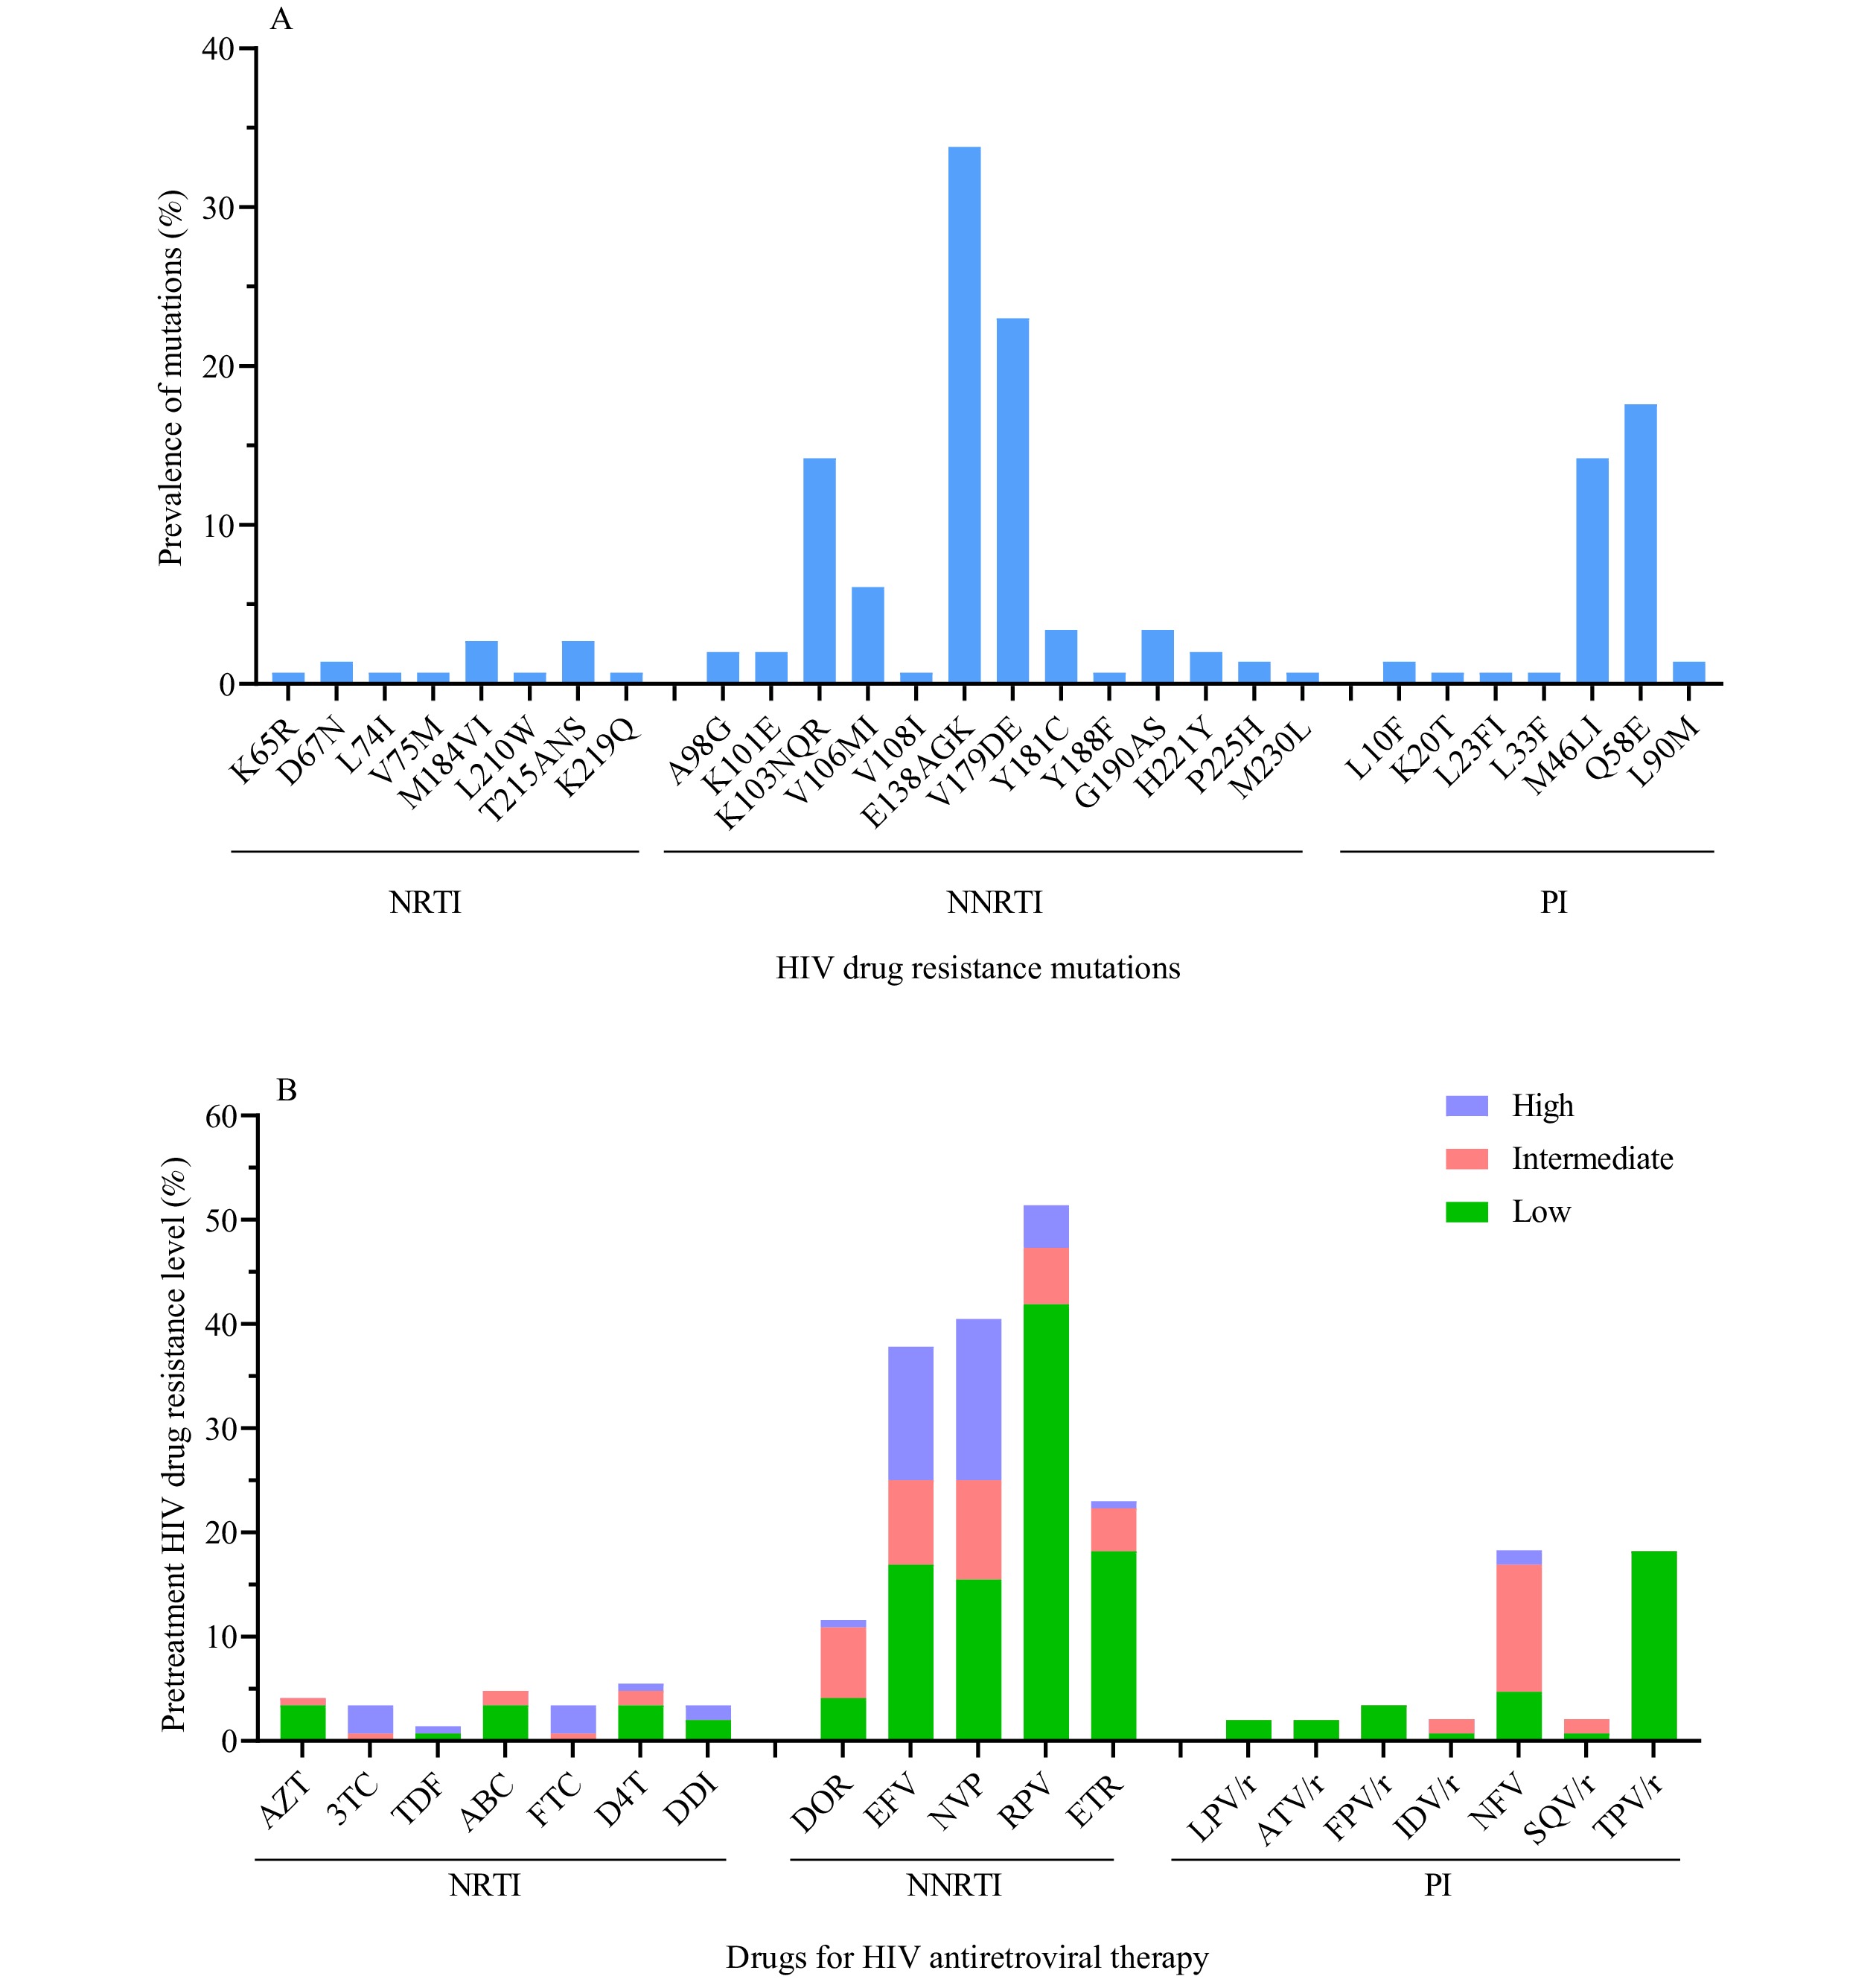 Figure 1.
HIV drug resistance mutations and antiretroviral drugs among 148 individuals with PDR. (A) Analysis of HIV drug resistance mutations among 148 individuals with PDR; (B) Analysis of HIV drug resistance levels among 148 individuals with PDR.
Notes: The estimated level of HIV resistance to a drug was determined by the Stanford HIVdb program from Sanger sequences. Once the total score was calculated, the estimated level of resistance was calculated as follows: low-level resistance (total score 15 to 29), intermediate resistance (total score 30 to 59), high-level resistance (total score ≥60).
Abbreviations: PDR=pretreatment drug resistance; HIV=human immunodeficiency virus; NRTI=nucleoside reverse-transcriptase inhibitor; AZT=Zidovudine; 3TC=Lamivudine; TDF=Tenofovir; ABC=Abacavir; FTC=Emtricitabine; D4T=Stavudine; DDI=Didanosine; NNRTI=non-nucleoside reverse-transcriptase inhibitor; DOR=Doravirine; EFV=Efavirenz; NVP=Nevirapine; RPV=Rilpivirine; ETR=Etravirine; PI=protease inhibitor; LPV/r=Lopinavir/r; ATV/r=Atazanavir/r; FPV/r=Fosamprenavir/r; IDV/r=Indinavir/r; NFV=Nelfinavir; SQV/r=Saquinavir/r; TPV/r=Tipranavir/r.
Next, 47 (10.1%, 47/464) people experienced virological failure one year after receiving an initial ART. Among them, 23 (15.5%, 23/148) were individuals with PDR, and 24 (7.6%, 24/316) without PDR. Risk factors of virological failure after one year of ART were assessed using logistic regression. The univariate logistic regression analysis showed that ethnicity, route of HIV infection, subtype, initial ART regimen, missed doses in the past month, and PDR were possible predictors of virological failure. After adjusting for demographic and clinical characteristics: age, gender, ethnicity, education, routes of HIV infection, subtype, and CD4 cell count before initial ART regimen, initial ART regimen, and missed doses in the past month, multivariate regression analysis stratified by the study was used to estimate the risk of virological failure. This study found that the risk of virological failure after one year of ART for individuals with PDR was 2.3 [95% confidence interval (CI): 1.2–4.6, P=0.01] times that of those without PDR (model 1, Table 2). Compared with populations without PDR, individuals who were resistant to NNRTIs before initial ART had a 2.8-fold (95% CI: 1.3–6.2, P=0.01) increase in the risk of virological failure (model 2, Table 2). Moreover, the results show that compared with individuals without PDR, the risk of virological failure among individuals resistant to EFV/NVP [adjusted OR (aOR)=3.2, 95% CI: 1.3–8.2] is statistically significantly higher (model 3, Table 2).
Model Factors Total No. of
VL ≥1,000
copies/mL (%)OR (95% CI) P Adjusted OR (95% CI) P Total 464 47 (10.1) − − − − Model 1 PDR Without 316 24 (7.6) 1.0 1.0 With 148 23 (15.5) 2.2 (1.2–4.1) 0.01 2.3 (1.2–4.6) 0.01 Model 2 For drug categories Without resistance 316 24 (7.6) 1.0 − 1.0 − Resistance to NRTIs 10* 1 (10.0) 1.4 (0.2–11.1) 0.78 1.6 (0.2–15.2) 0.66 Resistance to NNRTIs 88 16 (18.2) 2.7 (1.4–5.4) <0.01 2.8 (1.3–6.2) 0.01 Resistance to PIs 50* 6 (12.0) 1.7 (0.6–4.3) 0.30 1.7 (0.6–5.0) 0.30 Model 3 For antiretroviral drugs Without resistance 316 24 (7.6) 1.0 − 1.0 − Resistance to EFV/NVP 60 10 (16.7) 2.4 (1.1–5.4) 0.03 3.2 (1.3–8.2) 0.01 Resistance to other drugs 88 13 (14.8) 2.1 (1.0–4.3) 0.04 1.9 (0.8–4.3) 0.12 Note: “−” means not applicable.
Abbreviations: VL=viral load; HIV=human immunodeficiency virus; AIDS=acquired immune deficiency syndrome; OR=odds ratio; CI=confidence interval; PDR=pretreatment drug resistance; NNRTI=non-nucleoside reverse-transcriptase inhibitor; NRTI=nucleoside reverse-transcriptase inhibitor; PI=protease inhibitor; EFV=Efavirenz; NVP=Nevirapine.
* This number refers to individuals who were only resistant to PIs or NRTIs, excluding the three individuals with multi-drug resistance.Table 2. Factors associated with virological failure (VL ≥1,000 copies/mL) in HIV/AIDS populations one year after initial antiretroviral therapy.
-
A prospective survey in 31 PLADs of China was conducted to investigate the impact of HIV PDR on virological failure after one-year of ART. A total of 464 participants (148 participants with PDR and 316 participants without PDR) were included in the analysis. Compared with individuals without PDR, the risk of virological failure was higher in individuals with PDR.
After one year of ART, the overall virological failure (viral load ≥1,000 copies/mL) in the participants in this study was 10.1%. Among them, 15.5% and 7.6% of individuals with and without PDR had virological failure, respectively. Virological failure was defined as a viral load ≥400 copies/mL after one-year of ART. The results showed that the overall virological failure was 12.1% (56/464). The proportions of virological failure in individuals with and without PDR were 16.2% (24/148) and 10.1% (32/316), respectively. In addition, we found that 18.2% of individuals with NNRTIs pretreatment resistance experienced virological failure after one year of initial ART. A cross-sectional study of HIV PDR in parts of China showed that the overall prevalence of PDR was 6.8%, while the prevalence of NNRTIs PDR was 4.6% (3). This was consistent with the present study in which the majority of participants with PDR were resistant to NNRTIs. Previous studies and meta-analysis (5-6) also found that the prevalence of NNRTI-related PDR was higher than that of NRTIs. Compared to individuals without PDR, those with PDR that initiated NNRTIs had an increased risk of virological failure.
The findings in this study were in line with the cohort study of Hamers et al. (7), which found an odds ratio of approximately two for virological failure in individuals with PDR. Furthermore, we found that participants who were resistant to NNRTIs before ART were more likely to have an increased risk of virological failure than those without PDR. In addition, resistance to EFV/NVP in prescribed drugs, had an odds ratio of 3.2 for virological failure in patients with PDR. Furthermore, we observed that the resistance prevalence of RPV was as high as 51.4%, which was caused by the mutation E138AGK. Even if RPV was not in first line or second line ART regimens in China, it still needed to be monitored and used with caution. Therefore, when people living with HIV or AIDS initially receive ART, the possibility of baseline drug resistance must be considered.
The study was subject to some limitations. First, the number of patients with PDR was limited. This is indicative of the relatively low level of PDR in China. In the 2018 PDR survey, PDR to all ARVs was only 6.8% and the level of PDR to EFV/NVP was even lower to 2.7%. Secondly, only 42% of the patients with PDR in 2018 survey were included in this study. However, the patients with PDR that were included had the same profile of drug resistance mutations as those not included and had comparable demographic characteristics (data not shown). Therefore, the study’s population could largely represent the whole PDR group in 2018 survey. Moreover, the findings that PDR to EFV/NVP could compromise the efficacy of ART were similar to observations in other countries. Thus, while the results can be extrapolated, caution should be taken to understand the datasets.
In conclusion, PDR significantly reduced the efficacy of ART, especially as resistance to NNRTIs was prone to virological failure. Therefore, HIV genotype drug resistance surveillance should be strengthened before initial ART in order to guide the selection of the initial regimen and avoid virological failure in individuals with PDR. There should also be routine monitoring of HIV drug resistance at the population level to ensure the continued effectiveness of ART in order to achieve the global goal of eliminating AIDS as a public health threat by 2030.
-
No conflicts of interest.
-
31 provincial-level CDCs and Dr. Edward C. Mignot.
HTML
| Citation: |

|