
 Download:


-
Deaths from noncommunicable diseases are on the rise. According to a World Health Organization’s (WHO) report, 7 out of the top 10 global leading causes of death in 2019 were noncommunicable diseases (1). Stroke, which is the second leading cause of death in the world, has been ranked as the first cause of death for decades in China. It is estimated that at least 1 out of every 5 deaths in China is resulted from stroke (2). The burden is expected to increase further as a result of population ageing, socioeconomic development, urbanization, and the resulting lifestyle shifts and expanding prevalence of certain risk factors.
Strengthening prevention and control measures for stroke has risen as a national responsibility. The Chinese government has paid increasing attention to the prevention and treatment of strokes, including the establishment of the National Stroke Center, which launched the Stroke Screening and Intervention for High-Risk Population Program and several other important initiatives focused on reducing deaths associated with cardiovascular issues. One of the most important policies is “Healthy China 2030”, which summarizes stroke mortality in China and proposes initiatives to minimize its disease burden (3). This report described the trends in stroke mortality in China from 2004 to 2019 in order to evaluate the stroke prevention and control efforts taken by the Chinese government during this time. Finally, this report provided evidence-based stroke planning recommendations for the future.
HTML
-
Data analyzed in this study was obtained from the National Disease Surveillance Point (DSP) system, forming a nationally-representative sample of mortality in China. Initially, data was gathered only from “unrepresentative surveillance points”, then the system gradually expanded to 161 points in 2004 and included 605 surveillance points by 2013, covering 24% of the population (over 300 million people). Considering the expanded quality and comprehensiveness of the data, the mortality data from 2004 to 2019 was analyzed.
Stroke deaths were identified by the International Classification of Diseases 10th Revision (ICD-10), including I60–I64 (codes I60–I62 for identifying hemorrhagic stroke, I63 for ischaemic stroke, and I64 for unspecified type of stroke) (4). For the significant differences in the mortality rate of stroke among different populations, to identify key populations for stroke prevention and control, we categorized the population by sex (male and female); age (<40, 40–49, 50–59, 60–69, 70–79, and ≥80); region {east [3 municipalities (Beijing, Tianjin, and Shanghai) and 8 provinces (Hebei, Liaoning, Jiangsu, Zhejiang, Fujian, Shandong, Guangdong, and Hainan)]; central [8 provinces (Shanxi, Jilin, Heilongjiang, Anhui, Jiangxi, Henan, Hubei, and Hunan)]; and west [1 municipality (Chongqing), 6 provinces (Sichuan, Guizhou, Yunnan, Shaanxi, Gansu, and Qinghai), and 5 autonomous regions [Inner Mongolia, Guangxi, Xizang (Tibet), Ningxia, and Xinjiang]]}; and area type (urban and rural).
The crude mortality rate (CMR) of stroke was calculated by dividing the number of deaths by the associated population. The CMR was adjusted by the underreporting rate of data, with the equation:
$$ \begin{aligned} {\rm{Adjusted}} \;{\rm{mortality}}\; {\rm{rate}}\; ({\rm{AMR}}) = \\ {\rm{CMR}}/ (1-{\rm{underreporting}}\; {\rm{rate}}) \end{aligned} $$ The overall underreporting rate of stroke (12.9%) was based on the propensity score weighting established in a previous study (5). Age-standardized mortality rate (ASMR) was adjusted to the Seventh National Population Census in 2020 by the direct method. Analyses were conducted by pathological type and by region. R software (version 4.0.3, R Development Core Team, Vienna, Austria) was applied for statistical analysis.

-
The results regarding total deaths, AMR, and ASMR of stroke in 2004 and 2019 are shown in Table 1. From 2004 to 2019, the AMR decreased from 125.0/100,000 to 113.2/100,000, a decrease of 9.4%. The ASMR of stroke decreased from 195.0/100,000 to 117.4/100,000, a decrease of 39.8%. The ASMR of different subgroups all decreased. However, the AMR of stroke in the central and western regions increased by 1.2% and 20.4%, respectively, reaching 136.8/100,000 and 125.8/100,000; the AMR of ischemic stroke increased by 40.3%, reaching 49.8/100,000 in 2019.
Items 2004 2019 2004 vs. 2019 Deaths
(n)Proportion
(%)AMR
(1/100,000)ASMR
(1/100,000)Deaths
(n)Proportion
(%)AMR
(1/100,000)ASMR
(1/100,000)AMR
(%)ASMR
(%)Total 82,567 100.0 125.0 195.0 334,124 100.0 113.2 117.4 −9.4 −39.8 Age group (years) <40 1,227 1.5 3.0 − 3,527 1.1 2.4 − −20.0 − 40– 3,506 4.2 35.8 − 10,955 3.3 23.0 − −35.8 − 50– 8,380 10.1 109.2 − 27,330 8.2 59.1 − −45.9 − 60– 16,852 20.4 386.7 − 57,932 17.3 182.0 − −52.9 − 70– 29,133 35.3 1146.3 − 95,815 28.7 602.5 − −47.4 − ≥80 23,469 28.4 3450.1 − 138,565 41.5 2076.2 − −39.8 − Sex Male 46,474 56.3 137.5 225.4 187,816 56.2 124.7 136.9 −9.3 −39.3 Female 36,093 43.7 111.8 166.4 146,308 43.8 101.1 98.9 −9.6 −40.6 Area type Urban 26,061 31.6 108.7 155.4 105,769 31.7 85.8 91.1 −21.1 −41.4 Rural 56,506 68.4 134.2 221.2 228,355 68.3 132.8 135.7 −1.0 −38.7 Region East 31,234 37.8 131.2 189.2 120,203 36.0 90.5 91.5 −31.0 −51.6 Central 31,606 38.3 135.2 215.8 119,331 35.7 136.8 141.2 1.2 −34.6 West 19,727 23.9 104.5 175.6 94,590 28.3 125.8 138.0 20.4 −21.4 Pathological type Ischemic stroke 23,430 28.4 35.5 57.3 147,161 44.0 49.8 52.1 40.3 −9.1 Hemorrhagic stroke 52,736 63.9 79.8 122.1 170,445 51.0 57.7 59.5 −27.7 −51.3 Stroke, not specified 6,401 7.8 9.7 15.6 16,518 4.9 5.6 5.8 −42.3 −62.8 Abbreviations: AMR=adjusted mortality rate; ASMR=age-standardized mortality rate.
–: Not applicable.Table 1. Mortality rate and age-standardized mortality rate (ASMR) of stroke categorized by age group, sex, area type, region, and pathological types ― China, 2004 and 2019.
From 2004 to 2019, despite substantial reductions in ASMR, the decrease in mortality rate was less substantial and relatively stable (Figure 1). Overall, different trends were found in different pathological types. For example, the mortality rate decreased for hemorrhagic stroke but increased for ischemic stroke, which is the most common type of stroke.
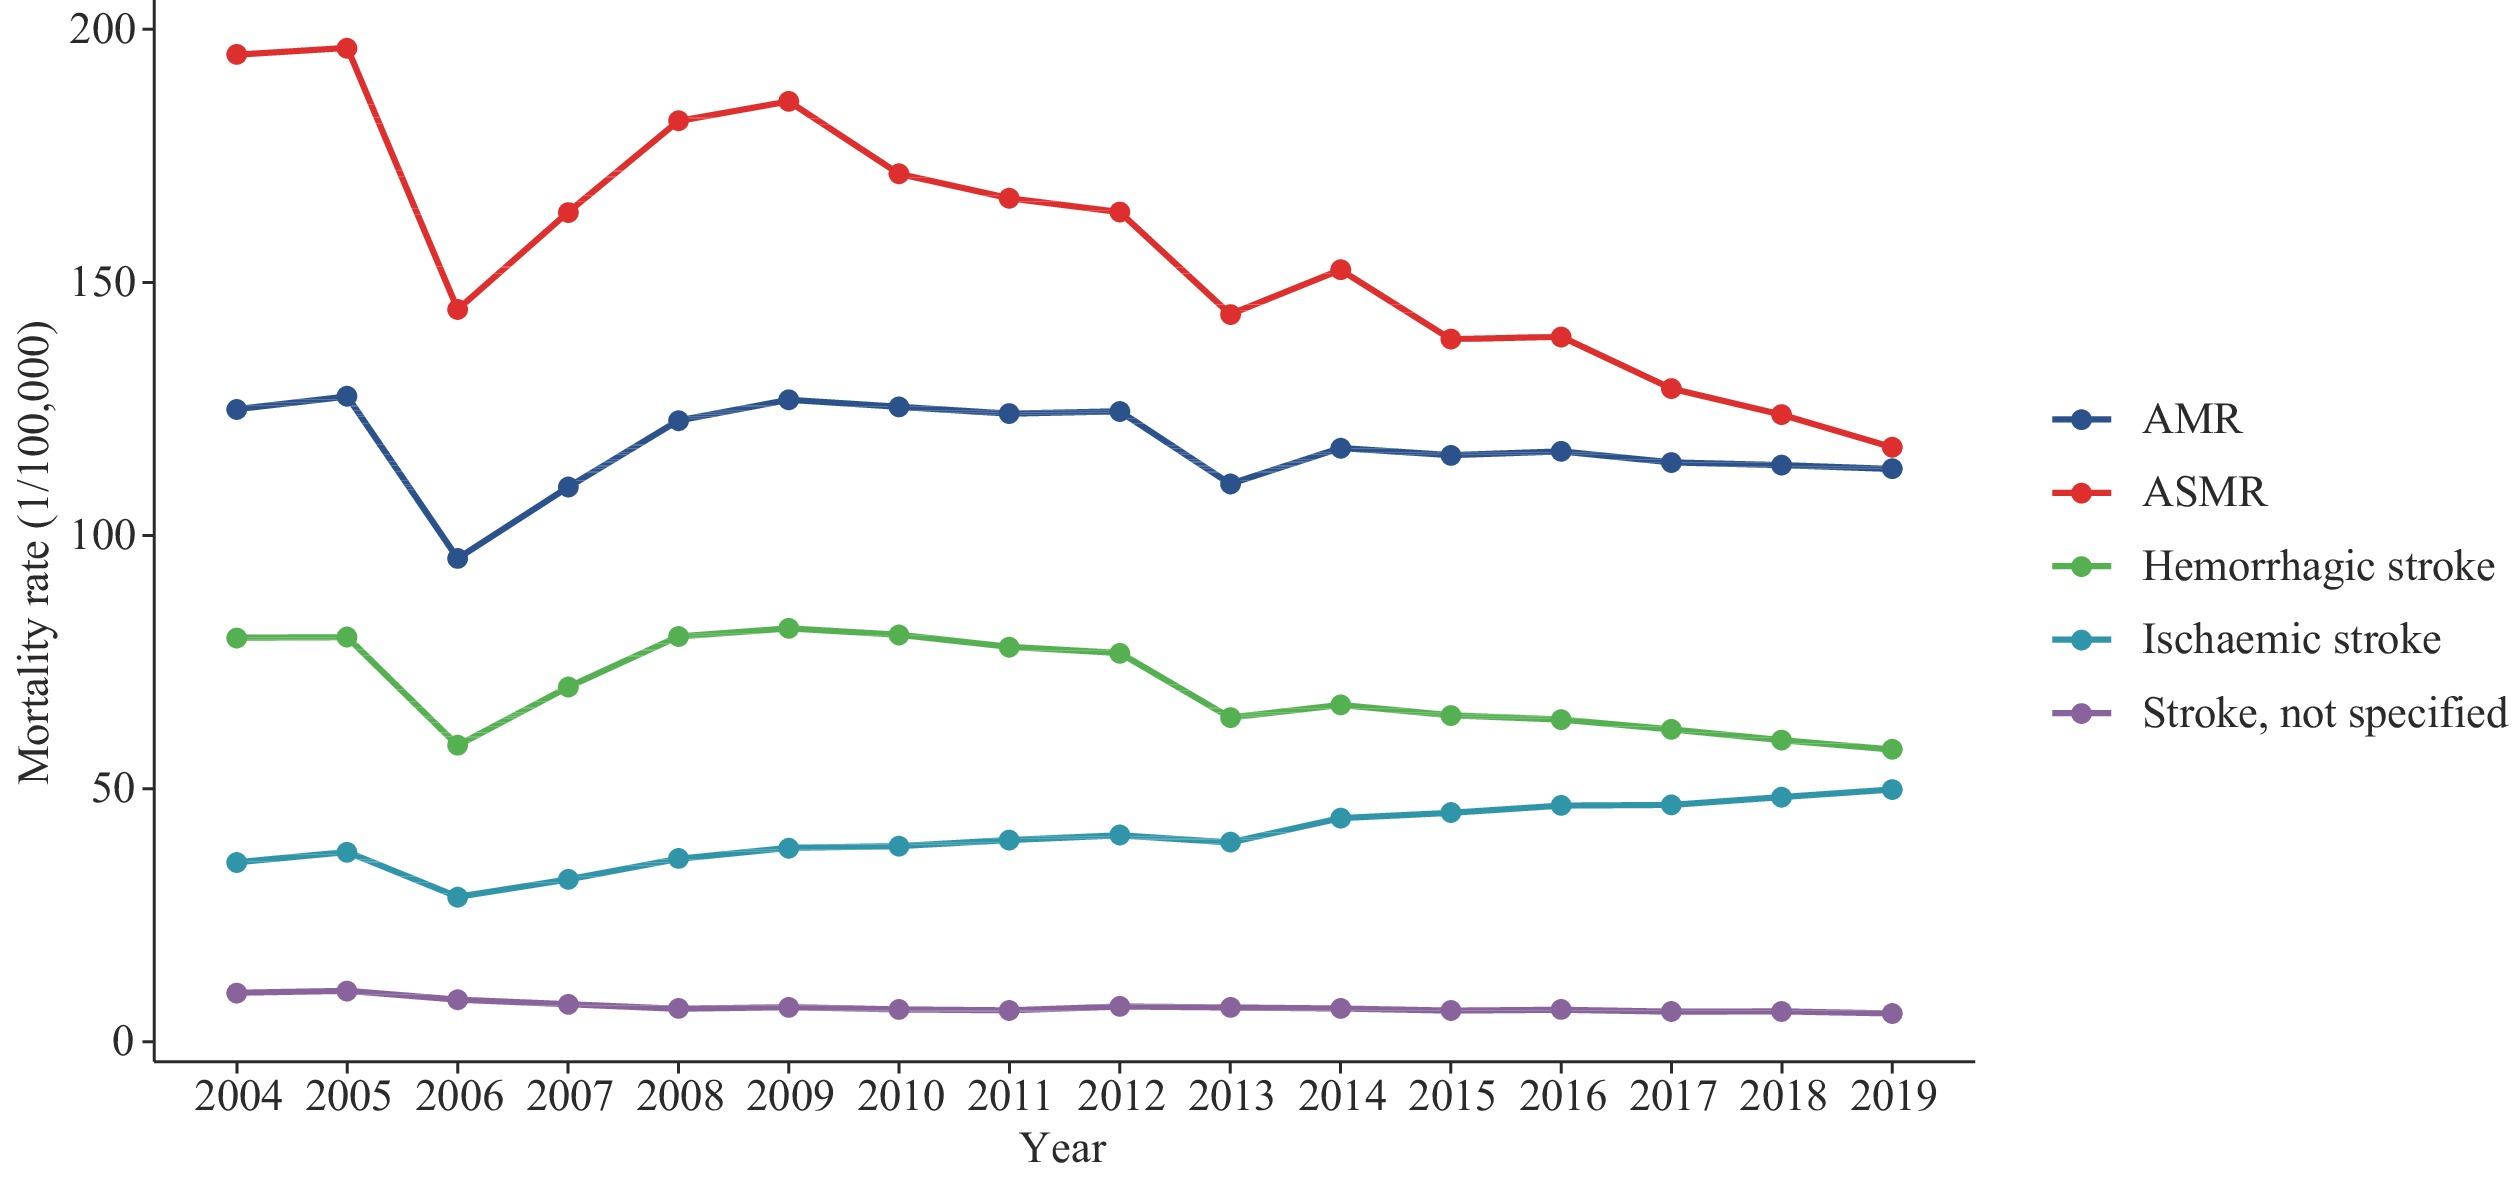 Figure 1.
AMR, ASMR, and mortality rates of stroke categorized by pathology ― China, 2004–2019.
Abbreviations: AMR=adjusted mortality rate; ASMR=age-standardized mortality rate.Despite the observed improvements in stroke mortality at national level in China, the analysis revealed a large subgroup disparity. The patterns of trends in males and females are similar but the mortality rates were much higher among males than females in all regions (Figure 2). Notably, the stroke mortality rate in rural areas was consistently higher than in urban areas. Stroke-related mortality was undulatory in rural areas, whereas in urban areas, the trend was relatively stable and slightly decreased (Figure 2A–B). A geographical gradient in mortality of stroke was apparent with the rate increasing in the west, decreasing in the east, and remaining relatively stable in central China (Figure 2C–E).
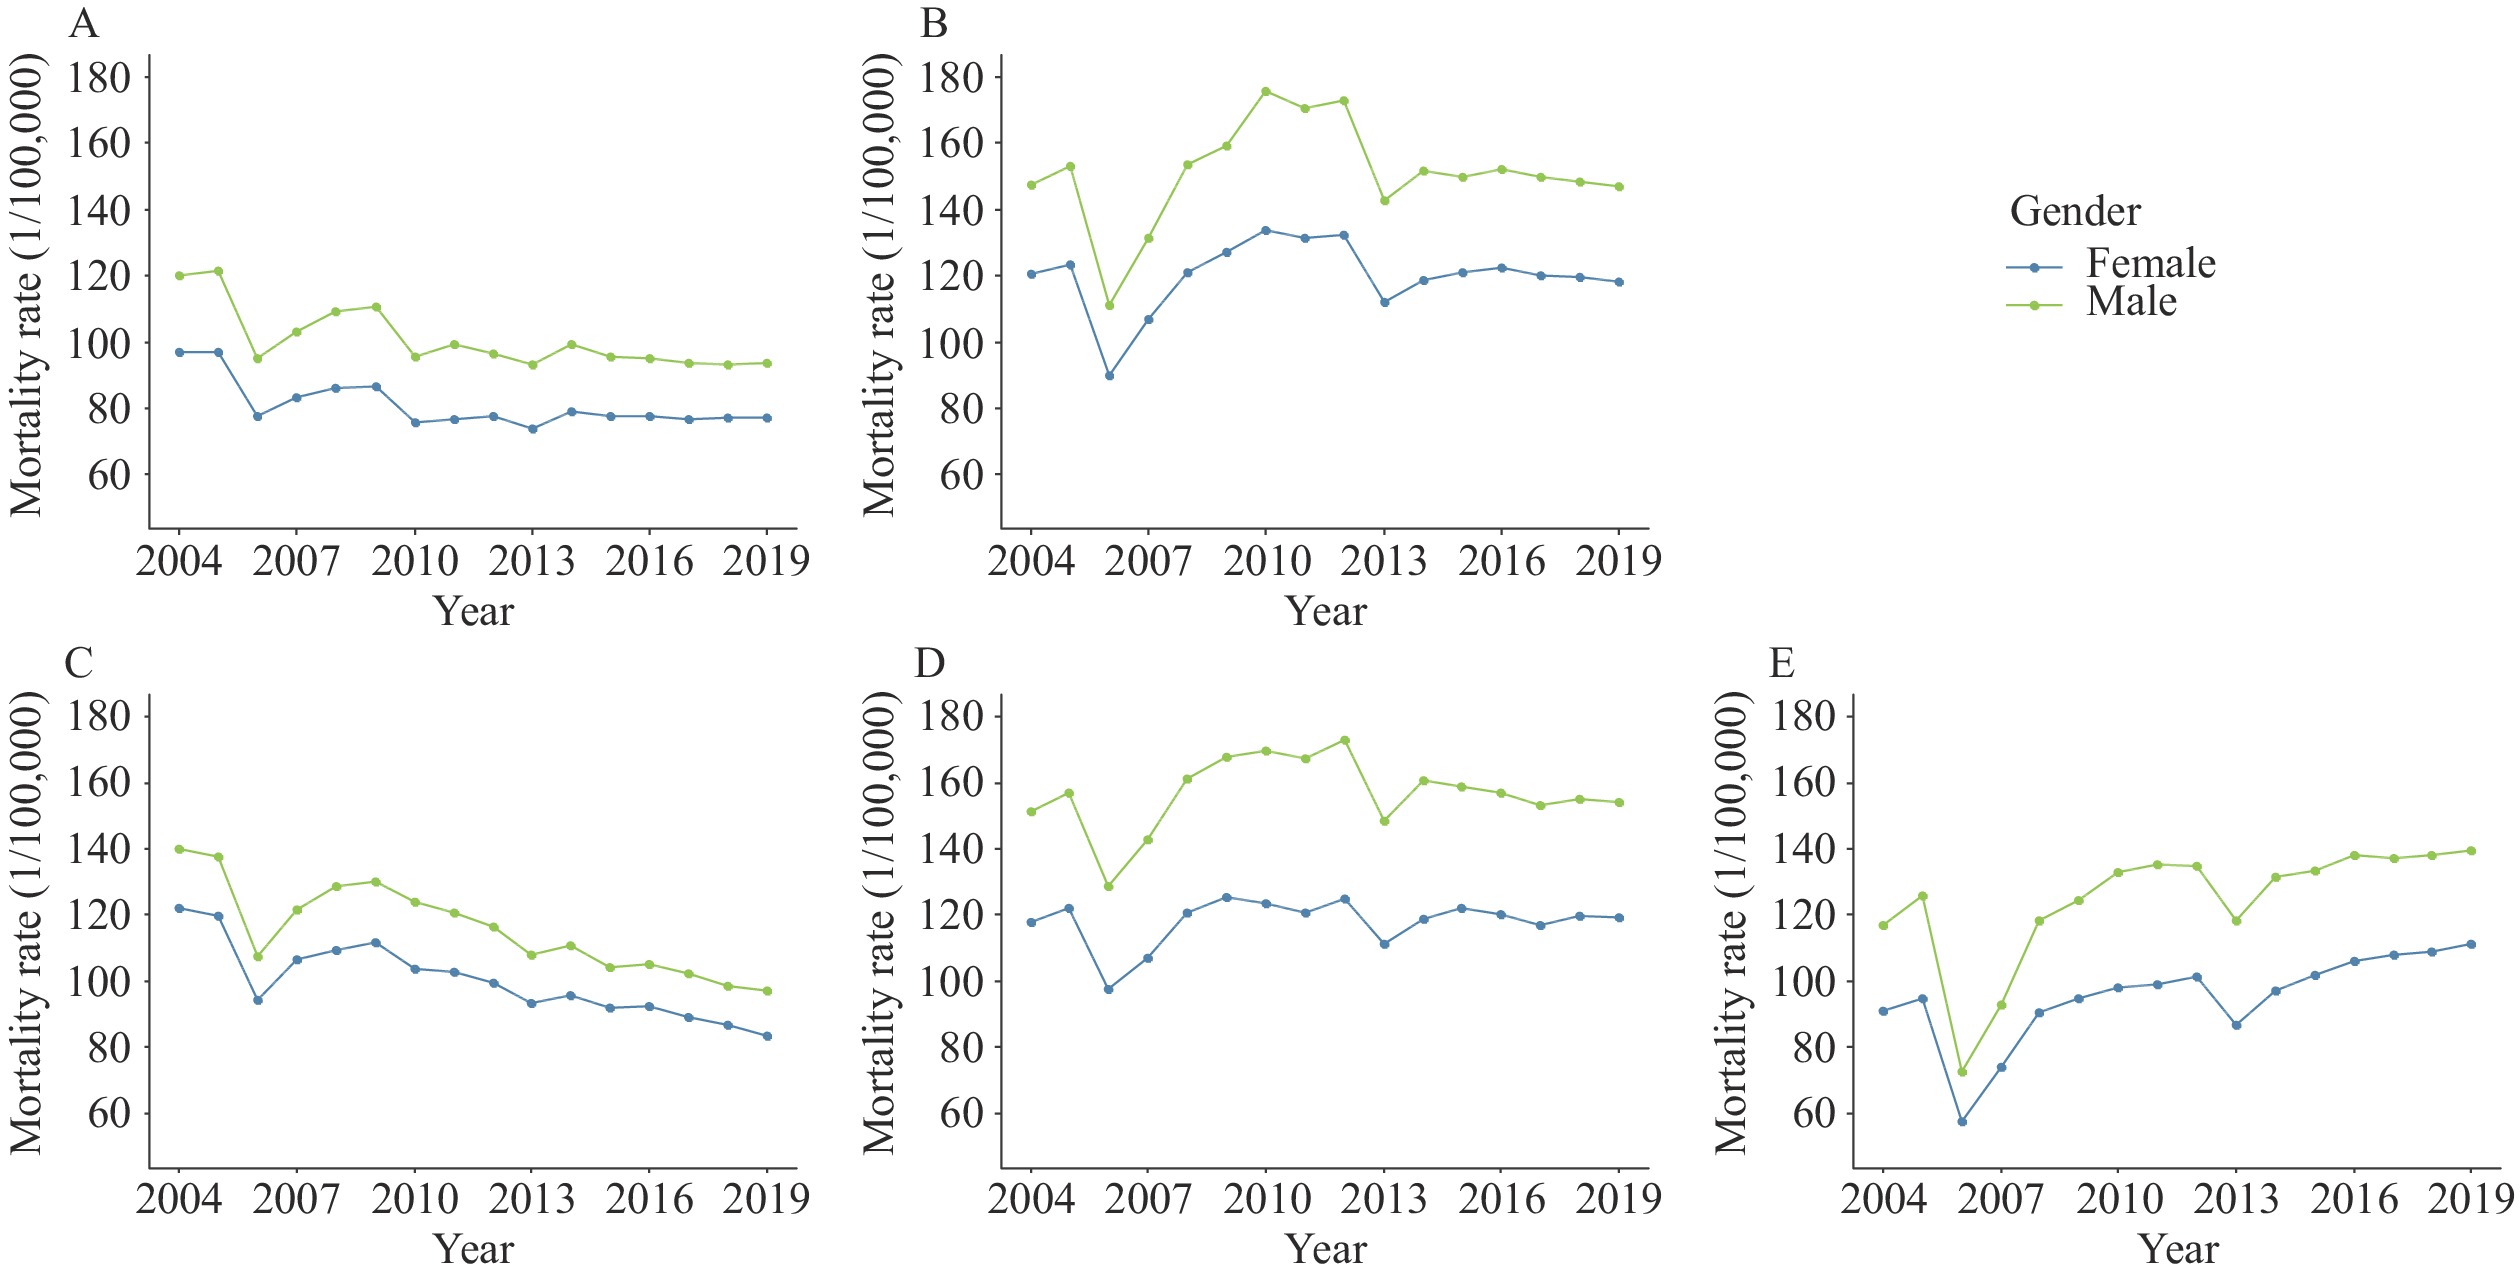 Figure 2.
The mortality rate of stroke categorized by area type and region broken down by sex ― China, 2004–2019. (A) The mortality rate of stroke in urban areas from 2004 to 2019 in China; (B) The mortality rate of stroke in rural areas from 2004 to 2019 in China; (C) The mortality rate of stroke in eastern China from 2004 to 2019; (D) The mortality rate of stroke in central China from 2004 to 2019; (E) The mortality rate of stroke in western China from 2004 to 2019.
-
This article demonstrated the sex and regional differences in mortality rate for ischemic strokes, hemorrhagic strokes, and strokes not specified as hemorrhagic or ischemic in China. Long-term trends in stroke-related deaths in China from 2004 to 2019 indicated that the burden of stroke in China was still severe.
Our results on stroke mortality in men and women are comparable to previous studies (6). The mortality rate of stroke in China is significantly greater than in other low-middle sustainable development index (SDI) countries like Mexico (30.3/100,000), Brazil (60.5/100,000), and Thailand (72.8/100,000) (7). From 2004 to 2019, the ASMR of stroke was substantially decreased, which might be attributable to higher healthcare coverage, improved treatment, increased public knowledge of stroke, and support from the government (8). For example, in 2009, the government launched a stroke screening and prevention project, and in 2011, the Stroke Prevention and Control Engineering Committee was formally established. However, AMR, which represents the actual mortality level in China, remained relatively stable. The stagnant mortality rates suggest that China has not achieved a sufficient decline in stroke burden to offset the demographic forces of population growth and ageing. The ageing trend is also unlikely to be reversed in the near future and the burden of stroke is likely to remain high despite recent changes to the childbearing policy.
Next, the mortality rate of hemorrhagic stroke in China decreased from 2004 to 2019. However, the mortality rate of hemorrhagic stroke is still greater than that of ischemic stroke. This pattern is consistent with previous studies in China (9) and what has been observed in other low- to middle-income countries (10). Hypertension is one of the most important modifiable risk factors for stroke, especially hemorrhagic stroke. The National Health Commission has included hypertension as one of the 20 national public health service equalization projects. Measures are needed to further increase awareness, treatment, and control of hypertension.
Lastly, the mortality rate of stroke was shown to be higher in central and western regions of China than in the eastern region, and higher in rural areas than in urban areas. These results are consistent with those of Wang et al. (11). In their study, they found a gradient scale of stroke mortality rates between the north and south of China and between rural and urban areas. An underlying cause of these regional disparities might be attributable to higher exposure to some modifiable risk factors and the limited availability and quality of stroke services in rural areas and in the western regions. It should be noted that the prevalence of hypertension is the highest in northeast, northern, and southwest China, which is consistent with these findings. The variation in doctor coverage, being the highest in northern and eastern China and the lowest in the southwest of China, might also be associated with the distribution of stroke mortality (9). China has actively explored and vigorously carried out the construction of stroke centers since 2012. As of 2022, thousands of stroke centers have been built. Despite improved access to overall health services, the area and population they cover are far from meeting the needs of stroke patients across China (12). Furthermore, the availability of specialized stroke care is variable across the country, with the proportion of stroke centers being relatively higher in eastern and southern China, lower in the northeast and western China, and especially disparate in rural areas (12). The earlier decline in stroke mortality in urban and eastern China may be due to the control of risk factors and the development of medical and health services. Additionally, over half of the Chinese population lives in rural areas, where the mortality rate of stroke is higher. Therefore, rural areas and the central and western regions of China should be the focus of stroke prevention and control investment.
This study has some limitations. Due to the inevitable underreporting of data, the data in this study was adjusted using the underreporting rate. However, the underreporting rate was not estimated year by year. Thus, the reported results might be underestimated (13). Second, although the data has broad national representation, the distribution of monitoring points is not uniform. More data is required across time and regions, particularly for rural areas, to provide a more thorough overview of stroke outcomes in China. Third, this study analyzed long-term trends in stroke mortality using data from the DSP system. Unavoidably, the quality of surveillance has not been completely consistent over the decades, which can cause abnormal fluctuations in the data. For example, in 2006–2007, data from the Third National Retrospective Sampling Survey of Death Causes was used instead of surveillance data, and in 2013, surveillance systems were integrated, which might have led to a decline in the quality of work.
-
In summary, the mortality rate of stroke in China from 2004 to 2019 decreased, however, the burden of stroke remained heavy. Overall, the decline in AMR was not significant compared with ASMR. In addition, the gradients of stroke mortality across China were clearly shown. To achieve the goals of “Healthy China 2030,” more extensive and effective prevention and treatment strategies are needed to mitigate the disease burden of stroke in China. Therefore, it is necessary to further underline the significance of stroke prevention, improve hypertension control, promote healthy lifestyles like reducing salt intake, and equip stroke health services, especially in some specific areas with high or increased burden of stroke and limited resources.
| Citation: |

|