
 Download:


-
The coronavirus disease 2019 (COVID-19) pandemic has caused severe health consequences. This study aimed to estimate the years of life lost (YLL) associated with COVID-19 in different countries. We collected data on COVID-19 cases and deaths up to March 27, 2021 and used a method recommended by the World Health Organization (WHO) to calculate YLL. We assessed the total YLL of each included country and calculated the YLL per 100,000 patients and per 100,000 people. We included 34 countries in the analysis. The US had the greatest total YLL among all countries. Peru topped the per-capita YLL. Mexico suffered from the greatest YLL per 100,000 patients. COVID-19 caused 9 to 21 YLL per deceased patient. East Asia and Oceania had substantially lower per capita YLL than North America and Europe. The pandemic caused disproportionate consequences (total and per-capita YLL) in different countries, implying that the variation in disease control strategies should be scrutinized to optimize future disease control and prevention.
As of November 2021, over 255 million COVID-19 cases were confirmed globally, almost 3 million of whom lost their lives (1). The spread of the virus remains fast. While numerous studies have provided insights into COVID-19-related mortality, very few emphasized the life expectancies and life-year loss of the deceased. Some argued that the majority of COVID-19 deaths occurred among the “oldest-old” who were proximal to death even without COVID-19 (2). However, the life-year loss of such individuals might be large given their life expectancy at that age (3). Estimating the COVID-19-related life-year loss is important to understand the societal loss and to inform the choice of epidemic containment strategies. YLL, an established measure to assess the impact of premature death, captures the additional time a patient would have lived if the patient did not die prematurely (4). It refers to the difference between the age of death and the life expectancy at that age. Compared with crude mortality and the number of deaths, YLL aims to comprehensively measure the disease burden. There is an absence of cross-country comparison to provide a worldwide landscape of YLL due to COVID-19 (5). This study aimed to provide YLL information for the debate and reflection on the anti-epidemic strategies and the establishment of a comprehensive loss function of COVID-19.
We categorized the COVID-19 patients and population into 9 age groups. The calculation of YLL followed the recommendation by the World Health Organization Supplementary Materials. Accordingly, we calculated the primary outcomes, including YLL per 100,000 COVID-19 patients and per 100,000 people. Standard errors were estimated using Monte Carlo simulation with 1,000 repetitions standard errors were estimated using Monte Carlo simulation with 1,000 repetitions (6-7). We assumed that the death events were uniformly distributed within each age group, so that we were able to approximate the YLL of each group by multiplying the number of deaths and the life expectancy of the median age of the group (e.g., the life expectancy of age 4.5 represented the mean life expectancy of group 0–9). We collected data of the life expectancy of different ages, demographic data of different countries, COVID-19 cases, deaths, and their age distributions Supplementary Table S1. We included countries with age-specific data available on the incidence and mortality of COVID-19 as of March 2021. Two analysts collected data independently and cross-checked the data. We used Excel 2016 (Microsoft Corporation, United States, North America) and Crystal Ball (version 11.1.1, Oracle Corporation, United States, North America) for analysis and Monte Carlo simulation.
We developed some secondary outcomes using primary outcomes. By dividing YLL per 100,000 patients and deaths per 100,000 patients, we derived YLL per dead patient, indicating the average YLL for every death caused by COVID-19. The 95% credible interval of YLL per dead patient was calculated by simulating the numerator and denominator simultaneously using Monte Carlo simulation 1,000 times. Moreover, by combining the results of countries in the same continental region, we compared the outcomes in five regions: East Asia, Southeast Asia, Europe, North America, and Oceania.
Among the 34 included countries, the total YLL in the US (7.2 million) was substantially greater than in other countries, almost twice as much as in Mexico (3.99 million). Italy, Peru, Germany, Argentina, Colombia, Spain, and Indonesia had around 1 million YLL. Other countries included had less than 0.36 million. Vietnam, Singapore, and New Zealand had less than 1,000 YLL (Figure 1).
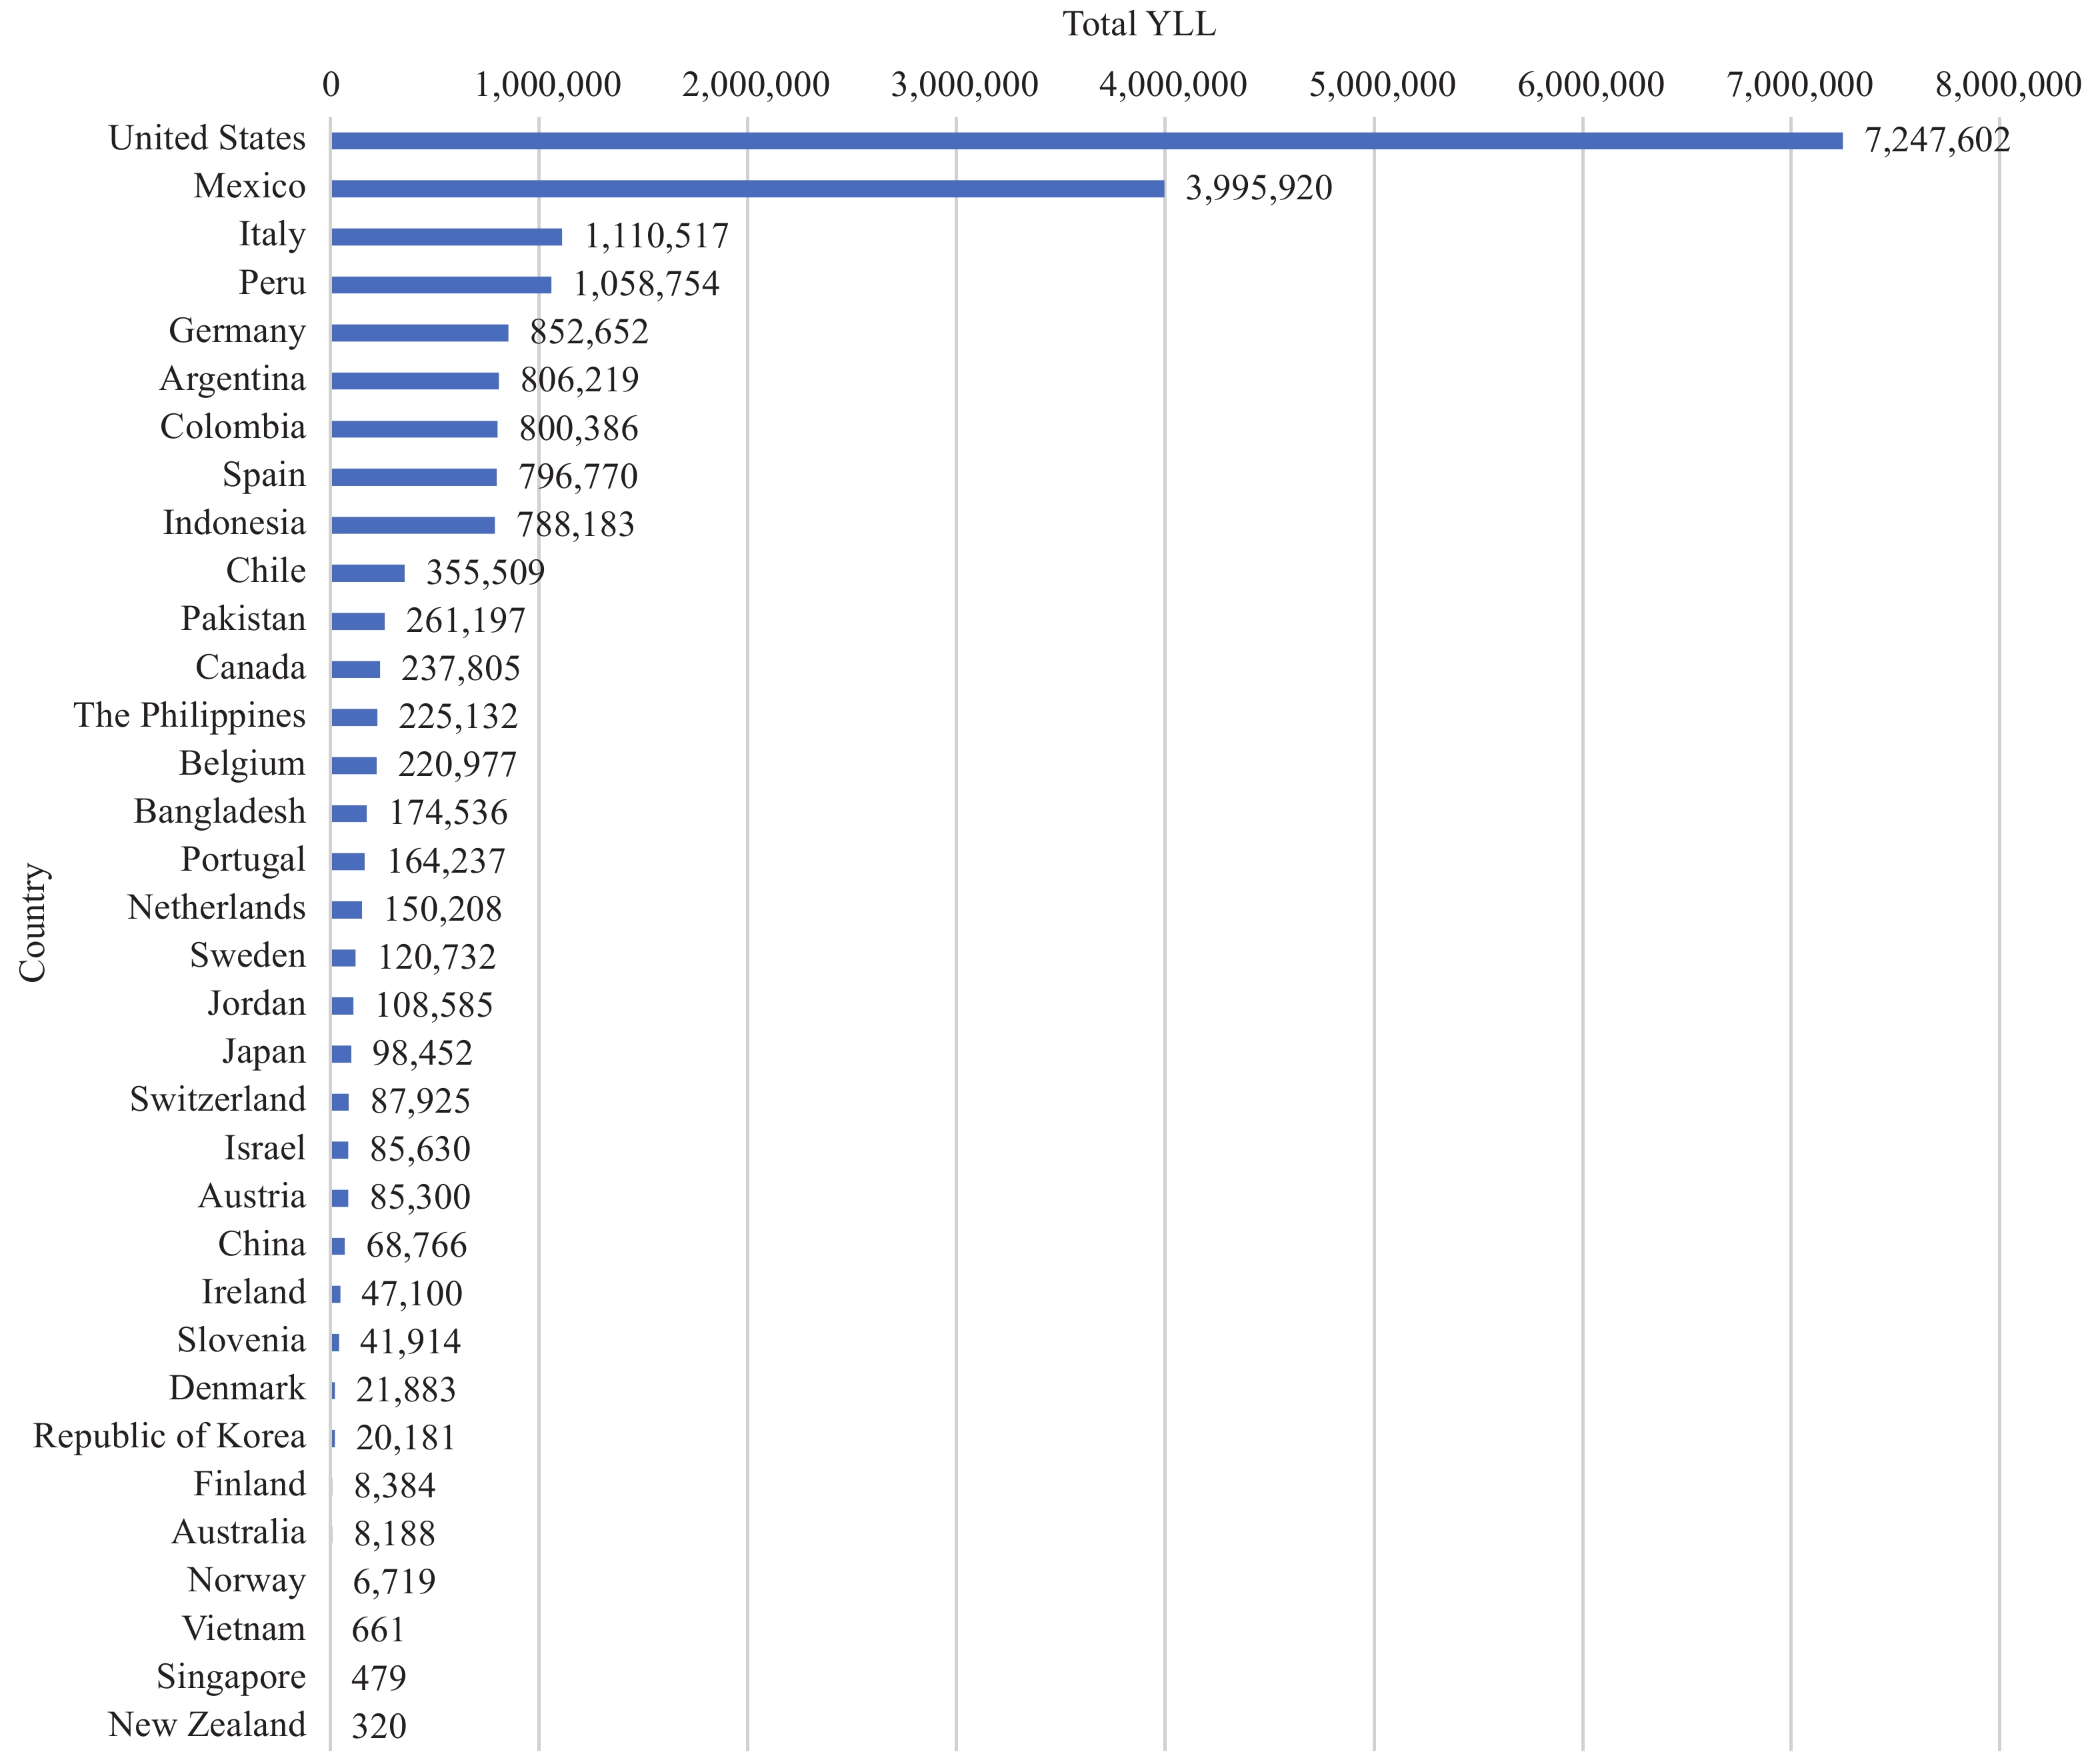 Figure 1.
Total years of life lost caused by COVID-19 by country.
Note: Countries are sorted in an order of decreasing YLL per 100,000 people.Figure 2 presented the cases, deaths, and YLL for every 100,000 people, in which countries were sorted in an order of decreasing YLL numbers. Peru, Mexico, and the US ranked in the top three in terms of YLL per 100,000 people. Although Peru and Mexico had much fewer per-capita cases than the US, they had similar COVID-19-relevant death rates, leading to a great loss of life years.
 Figure 2.
COVID-19 cases, deaths and years of life lost (YLL) for every 100,000 people by country.
Note: Countries are sorted in an order of decreasing YLL per 100,000 people.Countries with high cases and death rates per 100,000 people usually had a greater loss of life years per 100,000 people, compared with those with low cases and death rates; and vice versa Supplementary Table S2. For example, Slovenia ranked top in terms of COVID-19 cases and deaths per 100,000 people and ranked fourth in per-capita YLL. Belgium ranked second in terms of deaths per 100,000 people and ranked fifth in per-capita YLL. As the first country reporting COVID-19, China’s infection and death rates and YLL per capita were among the lowest in the countries included in the analysis.
Some exceptions existed. Although Israel ranked second in terms of infection rate, the death rate was low (71.2 per 100,000 people), leading to a moderate per-capita YLL (989.3). Among countries with lower than 100 YLL per capita, Singapore had a per-capita YLL as low as 8.2, despite that the infection rate in the country was higher than in other countries of this group. This might be because of its low mortality rate among the confirmed cases.
Figure 3 illustrated the YLL by continental region, in which the circle size was indicated by YLL per 100,000 people. With a much more population than other regions, East Asia had a low total YLL, leading to the lowest YLL per 100,000 people. In contrast, North America had the largest total YLL, though its population size was much smaller than that of East Asia. East Asian and Oceanic countries endured the smallest YLL for every 100,000 people (<30).
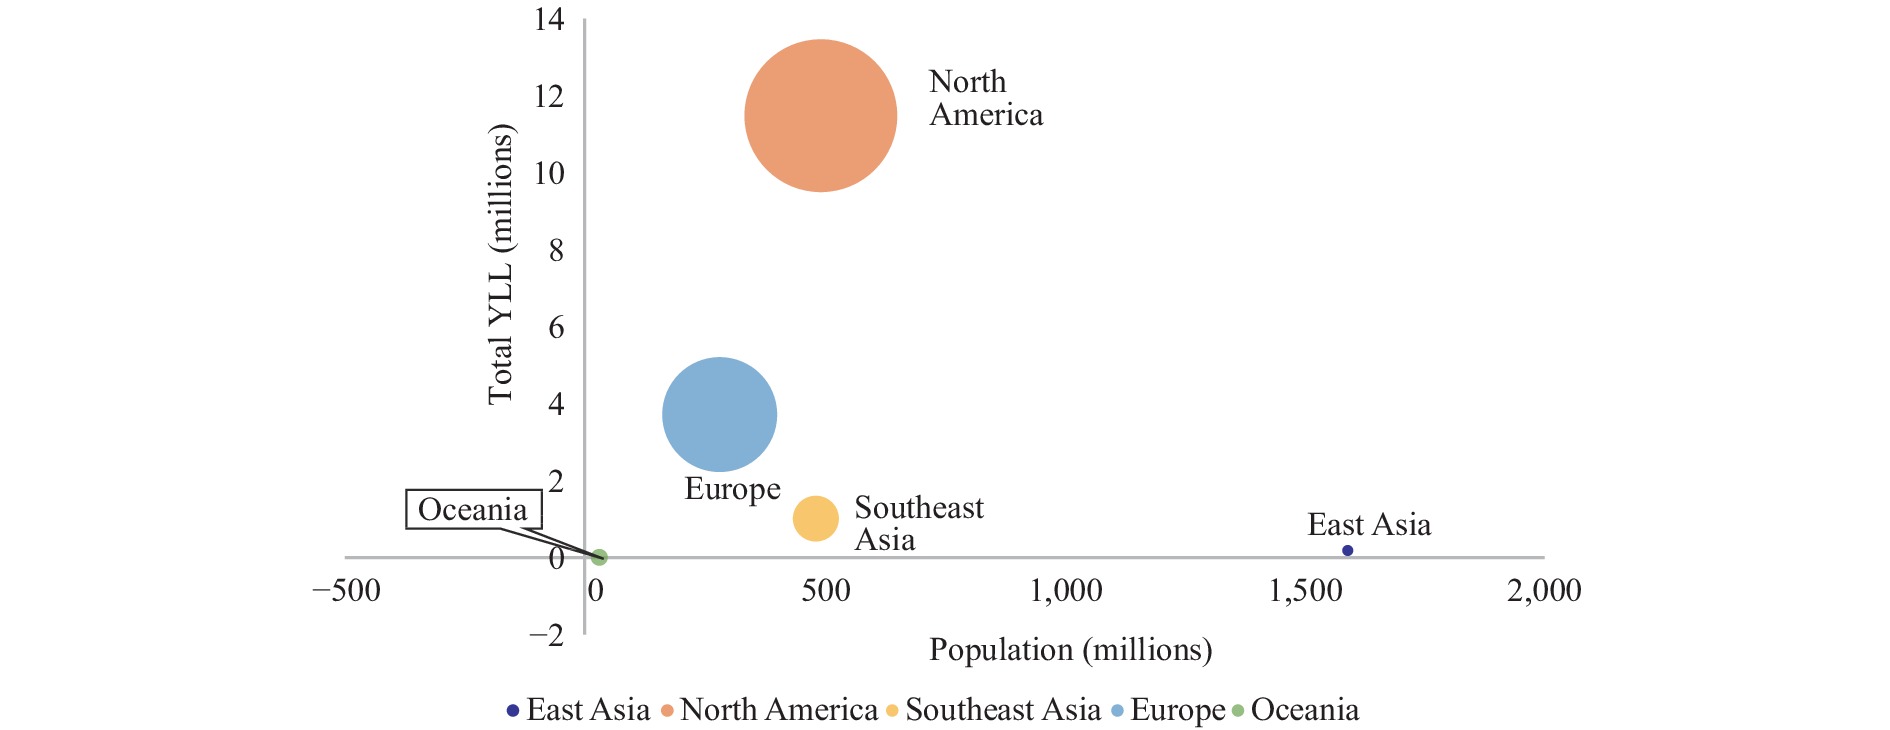 Figure 3.
Total years of life lost (YLL) due to COVID-19 in some continental regions.
Supplementary Figure S1 illustrated the results of YLL for every 100,000 COVID-19 patients by country. Mexico ranked first on both indicators. As the first country to report COVID-19, China ranked second and had a higher mortality rate and YLL per 100,000 patients than other countries except for Mexico. The US had a moderate death rate and YLL per 100,000 patients. The European countries had YLL ranging from 7,000 to 32,000 for every 100,000 patients. Italy had the highest YLL per 100,000 patients in Europe (31,833), while Norway had the lowest (7,389). Singapore had the least deaths and the lowest YLL per 100,000 patients among all countries. Generally, developing countries had a higher death rate and a higher per-patient YLL than developed countries. Supplementary Table S3 demonstrated that the deceased patients lost 9 to 21 years of life on average across countries. Australia had the lowest per-patient YLL (9.008), while Peru had the highest per-patient YLL (20.75).
-
This analysis provided a landscape of COVID-19-related YLL accumulated from the start of the pandemic to March 2021 in 34 countries based on age-specific life expectancy. North America had a greater amount of YLL than other regions, and the US ranked first in terms of total YLL among the countries. East Asian and Oceanic countries had a lower per-capita YLL than other countries. The pandemic had caused 9 to 21 years of life lost for every deceased patient on average.
The YLL per deceased patient reminds us how life-threatening this disease could be. We call attention to the fact that COVID-19 patients may die long before their “time,” although the crude mortality does not seem as scary as many other fatal diseases. It may be better to shield the vulnerable population, including the elderly and people with underlying diseases, instead of treating them carelessly (8).
It was reported that China, Republic of Korea, Norway, and Germany responded relatively faster than other countries since their respective first reported death cases and took a short time to enforce social distancing and contact tracing nationwide (9). In contrast, Spain responded relatively slowly to the initial outbreak, whereas Sweden did not take strict measures to limit the transmission (9). We observed that East Asian countries, Norway, and Germany had lower YLL per 100,000 people than those with slow response and/or lax measures, such as Spain. The YLL comparison may underline the importance of future research on quick response to COVID-19 and its health burden such as YLL, which may contribute to the consensus on appropriate anti-pandemic strategies.
The pandemic continues and the virus keeps mutating. The current predominant pandemic in many countries is caused by the Delta and Omicron variants of coronavirus, which have greater transmissibility than previous variants. Many governments chose to reopen their countries to alleviate the negative impact on the economy of the pandemic. According to the YLL comparison and previous experience (10), it might be too early to lift anti-epidemic restrictions, especially when evidence indicates that vaccination and medication may significantly change the landscape of YLL and save lives (11-12).
The findings of the present analysis should be interpreted with several caveats, including potential underreporting or misclassification of COVID-19 deaths, the heterogeneous data reporting routines across countries, and the exclusion of many countries due to the absence of key data components. Future research should improve data quality and the scope of analyses.
The pandemic caused different total and per-capita life-year losses in different countries. The variation in disease control strategies underlying such disproportionate consequences should be scrutinized to optimize future efforts in disease control and prevention.
HTML
| Citation: |

|