
 Download:


-
Polycyclic aromatic hydrocarbons (PAHs), the chemical mixture characterized by two or more benzene rings, which mainly derive from the insufficient combustion of organic materials, can cause some respiratory diseases and lung cancer. Globally, lung cancer cases and deaths are increasing. In 2018, International Agency for Research on Cancer (IARC) estimated 2.09 million new cases and 1.76 million deaths, due partly to occupational exposure to PAHs (1). IARC has identified 12 occupational exposures to lung carcinogens, including aluminum production, coke, and coal gasification fumes (2). Coal tar and bitumen are also occupational carcinogens identified by IARC, containing a variety of carcinogenic PAHs in volatile compounds. Exposure industries include coal tar products, coke, gas, aluminum, steel plants, paving and construction, etc. Lung cancer caused by coke oven emissions has been listed as a national statutory occupational cancer in China and most countries (3). In China, the manufacturing industry is developing with many workers. Lung cancer caused by occupational exposure to PAHs is a serious public health problem that needs attention. The relationship between PAHs and lung cancer is inconsistent in different industries. To explore the status of lung cancer caused by PAHs, a meta-analysis of related cohorts was conducted in this study.
We conducted a systematic literature analysis in the databases of PubMed, Embase, Web of Science, China National Knowledge Infrastructure (CNKI), Wan Fang, China Science and Technology Journal Database from January 1, 1969 to March 1, 2022. Combining subject words and free words, taking PubMed as an example, the retrieval formula was “[(polycyclic aromatic hydrocarbons) OR PAHs] AND [(lung cancer) OR (lung neoplasm)] AND [(cohort OR prospective OR longitudinal OR retrospective)]”. We hand-searched references that have been included in the articles to identify relevant studies. The retrieved studies were selected through inclusion and exclusion criteria by two researchers independently. The eligible articles were read in full and extracted key information. Concrete inclusion criteria included: (a) studies published before March 2022; (b) study type was prospective or retrospective cohort study; (c) subjects were occupational populations exposed to PAHs; and (d) number of cases, standardized incidence ratio (SIR)/standardized mortality ratio (SMR) and 95% confidence interval (CI) of lung cancer were reported in the paper. Some studies were excluded: 1) non-occupational exposure to PAHs; 2) study types other than cohort studies; 3) the required information could not be retrieved completely from the study; and 4) for repeated population studies, only the most complete articles were included. We assessed the quality of the included cohort studies by the Newcastle-Ottawa Scale (NOS). The quality assessments were completed by two researchers independently, and the disagreement was discussed. Stata (17.0, StataCorp, LP, TX, USA) was used for statistical analysis of the research data, and the evaluation indicators were mainly standardized morbidity or mortality and 95% CI.
PAHs are one of the main risks of lung cancer, and some PAHs-related industries increased the risk of lung cancer among workers. The literature results were in Supplementary Figure S1, a total of 2,843 studies were initially retrieved from 6 databases. 2,678 articles were excluded after reading the titles and abstracts, and 121 articles were excluded after reading the full text. After screening, 44 articles were identified as eligible literature for meta-analysis. The included articles and retrieved information of articles were shown in Table 1. The random-effects model and fixed-effects model were used separately to combine the results. In Table 2, we presented the results of a pooled analysis of the risk of lung cancer exposure to PAHs across industries and the results of various subgroup analyses. In the random-effects model analysis, the overall pooled relative risks (RR) (95% CI) was 1.32 (1.22–1.43) for 44 studies. Among them, a total of 2,024 lung cancer cases were observed in 11 studies on aluminum production, the pooled RR (95% CI) was 1.15 (1.05–1.26). A total of 571 lung cancer cases were observed totally in 9 studies on coke plants, the pooled RR (95% CI) was 1.82 (1.42–2.32); 1,053 lung cancer cases were collected in 8 cohort studies on iron and steel industries, the pooled RR (95% CI) was 1.39 (1.26–1.53). A total of 650 lung cancer cases were found in 7 cohort studies on asphalt tar production, the pooled RR (95% CI) was 1.28 (1.04–1.59), and 126 lung cancer cases in 6 cohort studies on carbon electrode, the pooled RR (95% CI) was 1.01 (0.77–1.33). Figure 1 showed the meta-analysis of 7 cohort studies on PAHs-related industries in China. For a total of 385 cases, the pooled RR (95% CI) was 1.75 (1.33–2.30). In addition, the three carbon black articles retrieved were not merged due to the small number of articles and the large heterogeneity. Coke production had the highest carcinogenic risk of lung cancer in different industries.
Authors and year Country Industry exposure Follow-up Outcome Cases Population RR* 95% CI Mur 1987 (4) France Aluminum 1950–1976 Mortality 37 6,544 1.14 (0.85–1.48) Chu 1996 (5) China Aluminum 1984–1993 Mortality 8 989 1.22 (0.50–2.28) Ronneberg 1999 (6) Norway Aluminum 1953–1993 Incidence 42 2,888 0.96 (0.69–1.29) Romundstad 2000c (7) Norway Aluminum 1953–1996 Incidence 189 11,103 1.00 (0.90–1.20) Moulin 2000 (8) France Aluminum 1968–1994 Mortality 19 2,133 0.63 (0.38–0.98) Spinelli 2006 (9) Canada Aluminum 1957–1999 Mortality 120 6,423 1.07 (0.89–1.28) Incidence 147 6,423 1.10 (0.93–1.30) Gibbs 2007 (10) Canada Aluminum 1950–1999 Mortality 538 5,977 1.36 (1.25–1.48) Gibbs and Sevigny 2007b (11) Canada Aluminum 1950–1999 Mortality 140 10,454 1.16 (0.97–1.36) Bjor 2008 (12) Sweden Aluminum 1958–2005 Incidence 40 2,264 1.48 (1.06–2.02) Armstrong and Gibbs 2009 (13) Canada Aluminum 1950–1999 Mortality 677 16,431 1.32 (1.22–1.42) Sim 2009 (14) Australia Aluminum 1983–2002 Mortality 28 4,396 1.08 (0.75–1.57) Incidence 39 4,396 1.23 (0.90–1.72) Gustavsson 1990 (15) Sweden Coke gasification 1966–1986 Incidence Mortality 4 295 0.82 (0.22–2.11) Berger and Manz 1992 (16) Germany Coke gasification 1953–1989 Mortality 78 4,908 2.88 (2.28–3.59) Reid and Buck 1956 (17) UK Coke 1950–1954 Mortality 14 8,000 1.40 (0.80–2.30) Wu 1988 (18) China Coke 1971–1982 Mortality 93 21,995 2.55 (2.13–3.03) Swaen 1991 (19) Netherlands Coke 1954–1984 Mortality 62 5,639 1.29 (0.99–1.66) Costantino 1995 (20) USA and Canada Coke 1951–1982 Mortality 255 5,321 1.95 (1.59–2.33) Bye 1998 (21) Norway Coke 1962–1993 Incidence 7 888 0.82 (0.33–1.70) Yu 2004 (22) China Coke 1988–2001 Mortality 16 5,571 2.77 (1.70–4.52) Miller 2013 (23) UK Coke 1972–1988 Mortality 42 3,698 1.51 (1.06–2.15) Hansen 1991 (24) Denmark Iron and steel 1970–1980 Mortality 9 632 1.37 (0.63–2.60) Sherson 1991 (25) Denmark Iron and steel 1967–1985 Incidence 166 6,144 1.30 (1.12–1.51) Fan 1992 (26) China Iron and steel 1972–1974 Mortality 76 18,242 1.04 (0.82–1.31) Sorahan 1994 (27) UK Iron and steel 1946–1990 Mortality 551 10,438 1.46 (1.34–1.58) Hao 1995 (28) China Iron and steel 1971–1992 Mortality 11 622 2.04 (1.15–3.61) Moulin 2000 (29) France Iron and steel 1946–1990 Mortality 54 4,897 1.19 (0.89–1.55) Hoshuyama 2006 (30) China Iron and steel 1980–1993 Mortality 133 21,175 1.54 (1.39–1.69) Westberg 2013 (31) Sweden Iron and steel 1958–2004 Incidence 53 3,045 1.58 (1.18–2.06) Miller 1986 (32) UK Asphalt Tar 1950–1982 Mortality 84 6,064 0.86 (0.70–1.07) Gong 1996 (33) China Asphalt Tar 1977–1993 Mortality 48 1,793 1.77 (1.30–2.35) Swaen 1997 (34) Netherlands Asphalt Tar 1947–1988 Mortality 48 907 1.18 (0.87–1.57) Boffetta 2003 (35) European countries Asphalt Tar 1953–2000 Mortality 330 29,820 1.17 (1.04–1.30) Wong and Harris 2005 (36) USA Asphalt Tar 1979–2001 Mortality 34 2,179 1.34 (0.93–1.87) Behrens 2009 (37) Germany Asphalt Tar 1965–2004 Mortality 101 7,919 1.77 (1.46–2.16) Zanardi 2013 (38) Italy Asphalt Tar 1964–2001 Mortality 5 415 1.00 (0.40–2.40) Sorahan 2001 (39) UK Carbon black 1951–1996 Mortality 61 1,147 1.73 (1.32–2.22) Dell 2006 (40) USA Carbon black 1930–2003 Mortality 138 5,011 0.97 (0.82–1.15) Wellmann 2006 (41) Germany Carbon black 1976–1998 Mortality 50 1,535 2.18 (1.61–2.87) Teta 1987 (42) USA Carbon electrode 1974–1983 Mortality 29 2,219 0.85 (0.57–1.21) Moulin 1989 (43) France Carbon electrode 1975–1985 Incidence 7 1,302 0.79 (0.32–1.63) Moulin 1989 (43) France Carbon electrode 1957–1984 Mortality 13 1,115 1.18 (0.63–2.01) Gustavsson 1995 (44) Sweden Carbon electrode 1969–1989 Mortality 2 901 1.68 (0.20–6.07) Donato 2000 (45) Italy Carbon electrode 1955–1996 Mortality 34 1,006 0.77 (0.53–1.08) Mori 2002 (46) Japan Carbon electrode 1951–1988 Mortality 9 332 2.62 (1.20–4.98) Merlo 2004 (47) Italy Carbon electrode 1950–1997 Mortality 32 1,291 0.97 (0.67–1.37) Abbreviations: RR=Relative risks, CI=confidence interval.
* Relative risks of lung cancer (including other respiratory cancers not specified).Table 1. Summary of worker cohort studies of occupational exposure to PAHs and lung cancer in China and other countries.
Industry No. of cohorts Number Pooled RR (95% CI)* I2 P for heterogeneity Aluminum 11 69,602 1.15 (1.05–1.26) 63.9% 0.001 1.23 (1.18–1.29) Coke production 9 56,315 1.82 (1.42–2.32) 80.4% <0.0001 2.06 (1.88–2.27) Iron and steel 8 65,195 1.39 (1.26–1.53) 52.7% 0.039 1.43 (1.36–1.51) Asphalt tar 7 49,097 1.28 (1.04–1.59) 80.8% <0.0001 1.24 (1.15–1.34) Carbon electrode 7 8,166 1.01 (0.77–1.33) 43.6% 0.100 0.96 (0.80–1.15) Overall industries 44 256,068 1.32 (1.22–1.43) 83.3% <0.0001 1.34 (1.31–1.38) Notes: I2 Statistics for the Heterogeneity Test; Number: Total number of people included in the combined cohorts.
Abbreviations: RR=relative risks, PAHs=polycyclic aromatic hydrocarbons; CI=confidence interval.
* The corresponding results are that the former is a random-effects model, and the latter is a fixed-effects model.Table 2. Summary of pooled RR (95% CI) of lung cancer and exposure to PAHs in different industries.
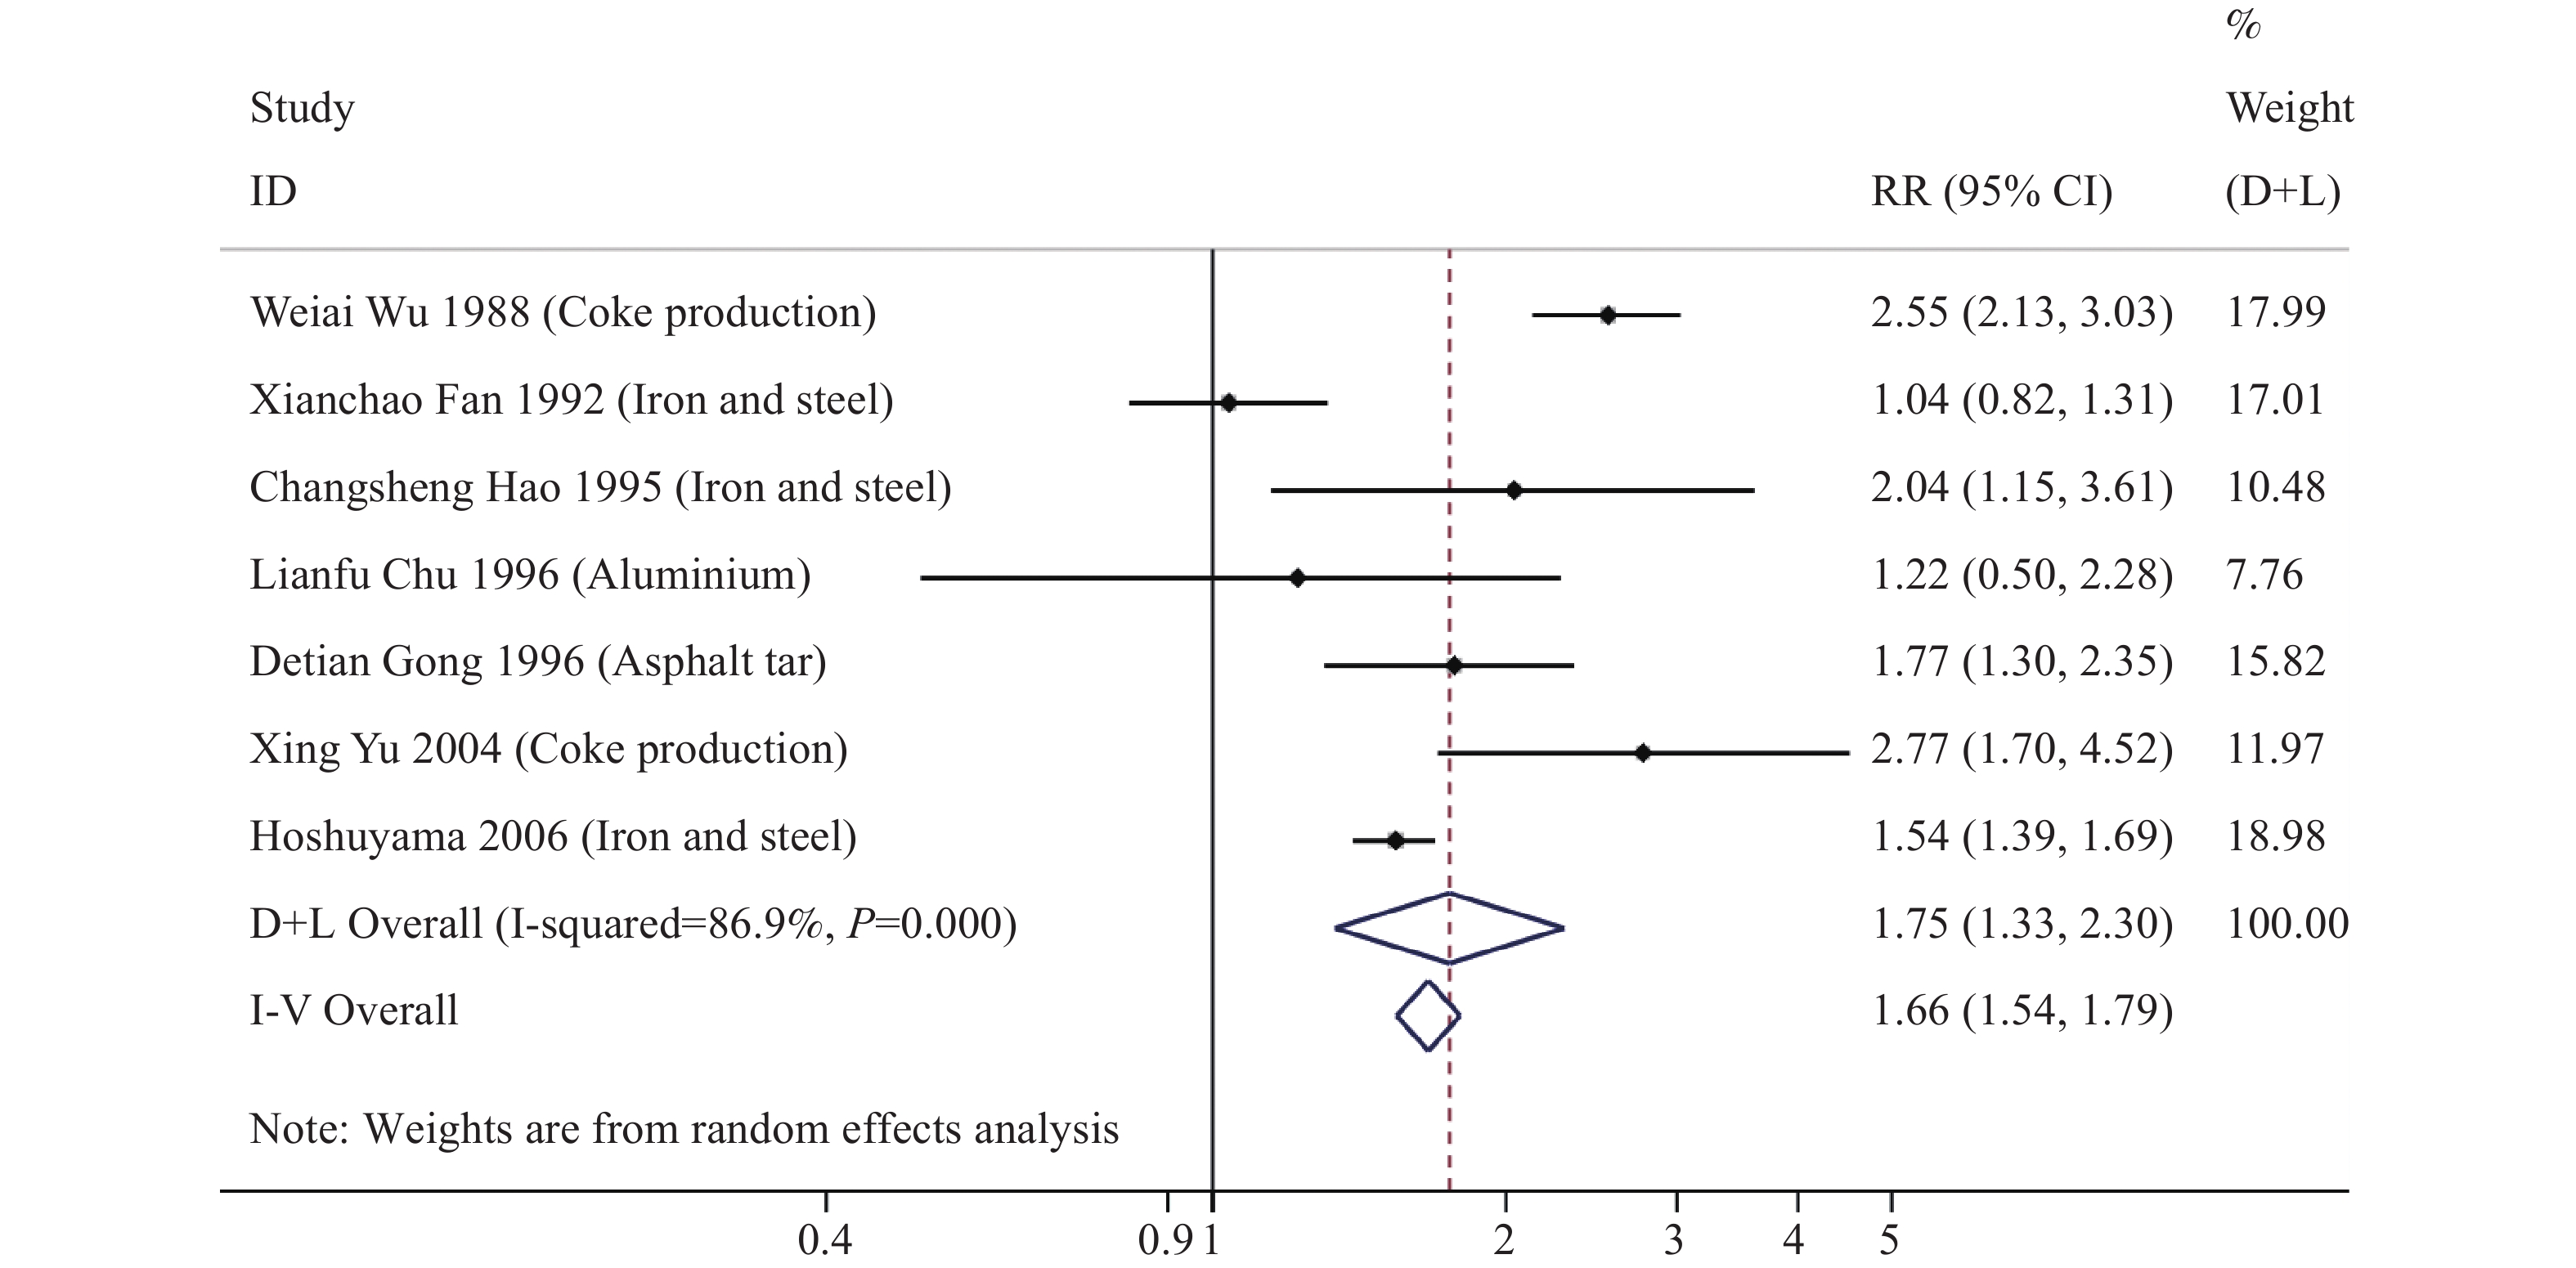 Figure 1.
RR (95% CI) for lung cancer in workers in PAHs-related industries in China.
Abbreviations: RR=relative risks, PAHs=polycyclic aromatic hydrocarbons.Publication bias analyses were conducted in various industry studies. There was no significant publication bias in any analyses, results were presented in Supplementary Table S1 (Begg’s test all P>0.05). Among them, the Egger’s test was P<0.05 of the aluminum factory research, but its Begg’s test was P>0.05. We further conducted a sensitivity analysis, and the result was relatively stable. Sensitivity analyses were performed by serially excluding each study to determine the influence of individual studies on the overall risk of lung cancer. The results of sensitivity analysis were shown in Supplementary Figure S2. We did not find that a study significantly affected the pooled effect size.
-
In this study, an excess risk of lung cancer mortality was found for aluminum production workers, and the difference was statistically significant. This was different from the existing research results. The risk of lung cancer has increased in coke, iron and steel, coal tar, asphalt PAHs-related industries, but no excess risk was found in the carbon electrode industry, which is consistent with the existing meta-analysis results (48). Results across industries in China were consistent with global findings that exposure to PAHs increases lung cancer risk. Comparing with the cancer risk from PAHs, the risk of the two cohorts in China was higher than that of pooled RR on coke production, and one study in China had the highest carcinogenic risk in all cohorts on asphalt tar industry. This may be related to higher exposure in these two industries in China.
There are more than 770 million workers in China, and more than 200 million workers are exposed to occupational hazards. There were 323,833 (95% uncertain interval 283,780–369,061) deaths and 14.1 million disability-adjusted life years (DALYs) attributable to total occupational risks in 2017, China, which accounted for 27.9% of global attributable deaths (49). A study estimated that 5.8% [interquartile range (IR), approximately 2%–11%] of China’s land area, where 30% (IR, approximately 17%–43%) of the population lives, exceeded the national ambient B[a]P(eq) standard of 10 ng/m3. The overall population attributable fraction of lung cancer caused by inhalation exposure to PAHs was 1.6% (IR, approximately 0.91%–2.6%), corresponding to an excess annual lung cancer incidence rate of 0.65×10⁻⁵. Biomass and coke production generate about 83% of the total PAHs emission in China (50). A study on coal tar pitch factory in China showed that workers were exposed to PAHs with a maximum exposure concentration of 1,931.45 ng/m3. The lifetime risk of workers was significantly higher than the acceptable range, with workers losing up to 1,033.95 hours of life expectancy (51). A biomonitoring study of carbon and coal tar processing workers in China showed that the urine PAHs surrogates of 1-hydroxynaphthalene, 2-hydroxynaphthalene, and 1-hydroxypyrene in contact group tar and asphalt were 12.20, 12.55, 7.08 and 10.62, 8.73, 3.07 μg/g creatinine, respectively, which was higher than the general range (52).
In the Healthy China Action (2019–2030), the occupational health protection action was proposed, and workers have the right to occupational health protection in accordance with the law. This study showed that workers in multiple occupations are exposed to PAHs, increasing the risk of lung cancer. Therefore, it is crucial for factories and workers to take protective measures. Specific measures include reducing the toxicity of raw materials, applying new technologies, monitoring environmental PAHs concentration, wearing protective clothing, and ventilating and detoxifying to minimize exposure to PAHs (53). Moreover, global economic integration is the main trend of today’s world economic development, along with avoiding hazard transfer, to serve a healthy China.
China is a large developing country with a booming manufacturing industry. PAHs are widely distributed, and occupational groups have a high probability of exposure to PAHs (54). The incidence of lung cancer may be related to the pollution of PAHs caused by rapid and immature industrialization. The Occupational Disease Prevention and Control Plan (2021–2025) in the 14th Five-Year Report pointed out that we should deepen prevention at the source, improve working conditions in the workplace, strictly supervise law enforcement, improve the efficiency of occupational health supervision, strengthen publicity and training, and enhance the awareness of occupational health in the whole society, etc. The Chinese government can further revise occupational health laws, monitor occupational lung cancer, and develop intelligent production. Therefore, it is necessary to control the emission of PAHs, strengthen protection, and reduce the exposure of PAHs during the rapid development.
This study was subject to some limitations. First, there were few cohort studies among Chinese workers, which needs to be conducted in related occupations from now on. Second, there was heterogeneity in the literature without considering confounding factors.
In conclusion, there is an increased risk of death from lung cancer in PAHs-related industries in China and other countries. There is a prominent need to prevent lung cancer in a wide range of occupations. It is necessary to establish guidelines to cut down the generation and emission of PAHs during the production process, to improve health promotion in the occupational population and industries.
-
No conflicts of interest reported.
HTML
| Citation: |

|