
 Download:


-
The frequency of extremely cold events has gradually decreased due to globing warming around the world, but there are cold spells caused by the continuous transfer of the Arctic polar vortex in the mid-latitude regions (1-2). As most cities in China are located in mid-latitude areas, the frequency of cold waves is expected to increase, especially in southern China. A study showed that the cold spells in 2008 swept through south-central China, resulting in a sharp mortality increase with estimated losses exceeding US $22.3 billion (3). Additionally, the varying tolerance and adaptability of populations in different regions led to inconsistencies on the definition of cold spells and its health effects in different regions (4). This study applied time-stratified case-crossover analysis to explore the associations between cold spells and mortality during different lag periods and among different population groups during cold months of 2014–2018 in Ningbo City, China. The mortality burden attributed to cold spells was also estimated. It was found that an acute effective response period appeared within about a week. Circulatory and respiratory system diseases were sensitive diseases and the elderly over 65 years old were more vulnerable. About 21.6% deaths could be attributed to cold spells.
The daily death data, meteorological data (e.g., temperature), and air pollution data (eg. PM2.5, O3) during 2014–2018 came from Ningbo CDC, China Meteorological Administration, and Ningbo Environmental Protection Bureau. The research period was defined as the November–March of each year from 2014 to 2018 to exclude the impact of heatwave events. We defined cold spells as days when the daily mean temperature was at or below the P10 (5.5 ℃) or P5 (3.9 ℃) percentile for at least 2, 3, or 4 consecutive days of the study period (1=cold spell days, 2=non-cold spell days). We compared the results of different definitions and selected the optimal one for stratified analysis to identify potential vulnerable populations and sensitive diseases.
The associations between cold spells and mortality were investigated in a two-stage analysis. First, the associations between cold spells and mortality were estimated by using a time-stratified case-crossover design combined with a distributed lag non-linear model (DLNM) (5), controlling for relative humidity and air pollutants. In order to identify the temporal characteristics of cold spells, we assessed the associations during different lag periods. Stratified analysis by sex, age, and cause of mortality were also conducted to identify sensitive diseases and vulnerable populations. Second, the attributable fractions (AFs) were estimated according to the associations between cold spells and mortality to evaluate the attributable mortality burden of cold spells (6). In addition, the stability of the model was validated by conducting sensitivity analysis (Supplementary Table S1). All analyses were implemented by using R statistical software (version 4.0.2, The R Foundation for Statistical Computing, Vienna, Austria).
During the study period, the total number of deaths was 83,532. The average daily mean temperature was 9.1 ℃ and the daily mean deaths of all causes were 120±19 per day (Table 1). This study shows the summary information of cold spells under different definitions (Supplementary Table S2,). Under the same temperature threshold, the shorter the duration, the more cold spells and days would occur.
Variable N `X (SD) M (P25, P75) Meteorology Daily mean temperature (℃) / 9.1 (4.8) 8.6 (5.6, 12.4) Relative humidity (%) / 79.4 (12.5) 81 (71.3, 89) Average pressure (hPa) / 1,023.9 (5.5) 1,024 (1,020, 1,027.8) Air pollution PM2.5 (μg/m³) / 52.4 (29.9) 46 (31, 66) O3 (μg/m³) / 73.1 (29.9) 73 (53, 92) PM10 (μg/m³) / 80.2 (42.1) 71 (49, 101) CO (mg/m³) / 1.0 (0.3) 0.9 (0.8, 1.1) Death data All causes of death 83,532 120 (19) 119 (107, 132) Sex Female 37,006 53 (11) 53 (46, 60) Male 46,526 67 (12) 66 (59, 74) Age (years old) 15–65 16,291 23 (5) 23 (20, 27) >65 66,771 96 (18) 94 (84, 106) Cause of mortality Respiratory diseases 13,101 19 (6) 18 (14, 23) Circulatory system diseases 26,550 38 (9) 38 (32, 44) Genitourinary system diseases 933 1 (1) 1 (0, 2) Endocrine system diseases 2,724 4 (2) 4 (2, 5) Note: “/” means not applicable.
Abbreviations: N=total deaths; `X=mean; SD=standard deviation; M=median; P25=the 25th percentile; P75=the 75th percentile.Table 1. Summary statistics of meteorology, air pollution, and mortality of cold season in 2014 to 2018 in Ningbo City, China.
Figure 1 depicted the lag responses of associations between cold spells under 6 different definitions and the mortality. All cold spells had a non-linear effect on the risk of total death. The death risk showed a trend of decreasing first and then increasing, and it was the largest on the day of exposure (lag0).
According to the lag effects, the cumulative relative risks (CRR) of total mortality associated to cold spells under different definitions were obtained for different lag periods (lag0, lag0–7, lag0–14, and lag0–21) (Supplementary Table S3). Based on the value of CRR, we selected “cold spell A” (temperature threshold ≤P5, duration ≥2d) as the best cold spell definition to conduct the stratified analysis by sex, age, and cause of death. Under the “cold spell A”, the value of CRR increased with the increasing of lag periods. While a sharp increment of CRR value on lag0–7 was detected (Table 2), which indicated that there was an acute effect period about 7 days after the cold spell appeared.
Variables CRR (95% CI) AF, %(95% CI) Lag0 Lag0–7 Lag0–14 Lag0–21 Lag0−21 Total death 1.031 (1.018, 1.044)* 1.156 (1.095, 1.221)* 1.181 (1.099, 1.268)* 1.276 (1.153, 1.411)* 21.6 (13.3, 29.1)* Sex Male 1.035 (1.020, 1.051)* 1.174 (1.100, 1.254)* 1.198 (1.099, 1.305)* 1.322 (1.171, 1.493)* 24.4 (14.6, 33.0)* Female 1.025 (1.009, 1.042)* 1.133 (1.054, 1.219)* 1.160 (1.056, 1.274)* 1.220 (1.068, 1.394)* 18.0 (6.4, 28.3)* Age (years old) 14–65 1.030 (1.006, 1.055)* 1.110 (1.000, 1.232)* 1.050 (0.916, 1.204) 1.072 (0.884, 1.299) 6.7 (−13.1, 23.0) >65 1.031 (1.017, 1.045)* 1.168 (1.100, 1.241)* 1.213 (1.122, 1.312)* 1.325 (1.186, 1.481)* 24.5 (15.7, 32.5)* Causes Respiratory system 1.027 (1.001, 1.053)* 1.168 (1.044, 1.307)* 1.266 (1.094, 1.464)* 1.444 (1.173, 1.777)* 30.7 (14.7, 43.7)* Circulatory system 1.037 (1.018, 1.056)* 1.203 (1.108, 1.305)* 1.270 (1.142, 1.412)* 1.465 (1.261, 1.702)* 31.7 (20.7, 41.2)* Genitourinary system 1.058 (0.970, 1.153) 1.326 (0.906, 1.941) 1.284 (0.777, 2.120) 1.021 (0.495, 2.109) 1.4 (−50.6, 35.4) Endocrine system 0.993 (0.942, 1.047) 0.976 (0.773, 1.232) 0.996 (0.738, 1.344) 1.014 (0.664, 1.549) 2.1 (−10.2, 52.6) * P<0.05.
Abbreviations: CRR=cumulative relative risk; CI=confidence interval; AF= attributable fraction.Table 2. The cumulative relative risks and attributable fractions of mortality caused by cold spell for different populations.
The CRR for males and females were 1.322 [95% confidence interval (CI): 1.171, 1.493] and 1.220 (95% CI: 1.068, 1.394), respectively, within 21 days after cold spell happened compared with non-cold spell periods. The people above 65 years old increased the most when cold spell appeared, the CRR was 1.325 (95% CI: 1.186, 1.481). No statistically significant association was found for the people of 0–14 years, and the CRR was 1.772 (95% CI: 0.613, 5.120).
The CRR of death from respiratory diseases and circulatory diseases were 1.444 (95% CI: 1.173, 1.777) and 1.465 (95% CI: 1.261, 1.702) on lag0–21, respectively. No statistically significant associations were found between cold spell and mortality of genitourinary and endocrine system diseases.
It was shown in Table 2 that 21.6% (95% CI: 13.3%, 29.1%) of deaths could be attributed to cold spells during cold season in Ningbo. The attributable fraction (AF) for males and females was 24.4% (95% CI: 14.6%, 33.0%) and 18.0% (95% CI: 6.4%, 28.3%), respectively. Among different age groups, the population over 65 years old had the highest death burden ascribed to cold spell, with the AF of 24.5% (95% CI: 15.7%, 32.5%). The AF value of respiratory system diseases and circulatory system diseases was 30.7% (95% CI: 14.7%, 43.7%) and 31.7% (95% CI: 20.7%, 41.2%), respectively.
-
Our study assessed the relationship between cold spells and mortality in Ningbo. One week after cold spells appeared, there was an acute high-effect period. And 21.6% of total mortality could be attributed to cold spells during cold season. In the first week after the cold spells, decision-makers in relevant department should consider adaptive measures in time to decrease the death risk and disease burden.
In this study, it was shown that CRR of population deaths was greater under the definition of cold wave with lower temperature threshold and shorter duration compared with higher temperature threshold. This is consistent with the research of Liang et al., that is, the optimal cold wave was defined as temperature threshold ≤P5 and duration ≥2 days (4). However, Liu et al. found that the optimal cold wave was defined as the days with temperature threshold ≤P10 and duration ≥4 days for COPD hospitalized population in Beijing (7). This suggested that different definitions may apply to different regions, climates, and health outcomes. In general, more effective cold spell definitions and early warning systems should be explored in the future to adapt to changes in the regional economy, climate, disease, and population mobility.
Within 7 days of lag, there was an acute high-effect period of the cold spell on the death risk. However, the current studies lack more evidence for the acute effect of the cold spell, especially in the southern regions in China. These findings may provide evidence for the optimal time for the prevention and control of sensitive diseases after cold waves. Additionally, the results discovered that the elderly aged above 65 years were the most vulnerable population, and circulatory and respiratory system diseases were sensitive diseases to cold spells, which were mirror with other studies (8-10).
For example, a study in Wuhan found that cold wave weather could increase the death risk of residents, and patients with cardiovascular disease and the elderly were the sensitive groups. But they found higher CRR values on sensitive groups (1.960 and 1.670) than our research, with the CRR of 1.465 and 1.325 for cardiovascular disease and the population of over 65 years (8). Moreover, the results of this study showed that the risk of death in the age group of 14–65 years also increased significantly within a short lag period (lag0–7). It is speculated that young people, especially outdoor workers, spend more time outdoors and have more opportunities to be exposed to cold waves.
This research also evaluated the mortality burden attributed to cold spells and found that 21.6% of mortality could be ascribed to cold spells during cold season in Ningbo. It was of great significance for the health risk early warning, the formulation of health preventive measures against cold waves, and the evaluation of potential benefits of public health intervention.
The study was subject to at least two limitations. First, the research area only involved one city, and the generalizability of results was limited. Second, the sample size of the group of <14 years and the group of genitourinary system diseases was too small, which may cause certain deviations in the results. However, the study will provide important evidence for evaluating the impact of cold wave on population health in southern regions in China. At the same time, health departments and medical institutions should strengthen cooperation and take active actions to do their best in providing monitoring, forecasting, and early warning services. It is suggested that vulnerable groups, especially the elderly and patients with circulatory and respiratory diseases, should take timely measures to keep warm to reduce the health damage caused by extremely cold weather events.
-
No conflicts of interest.
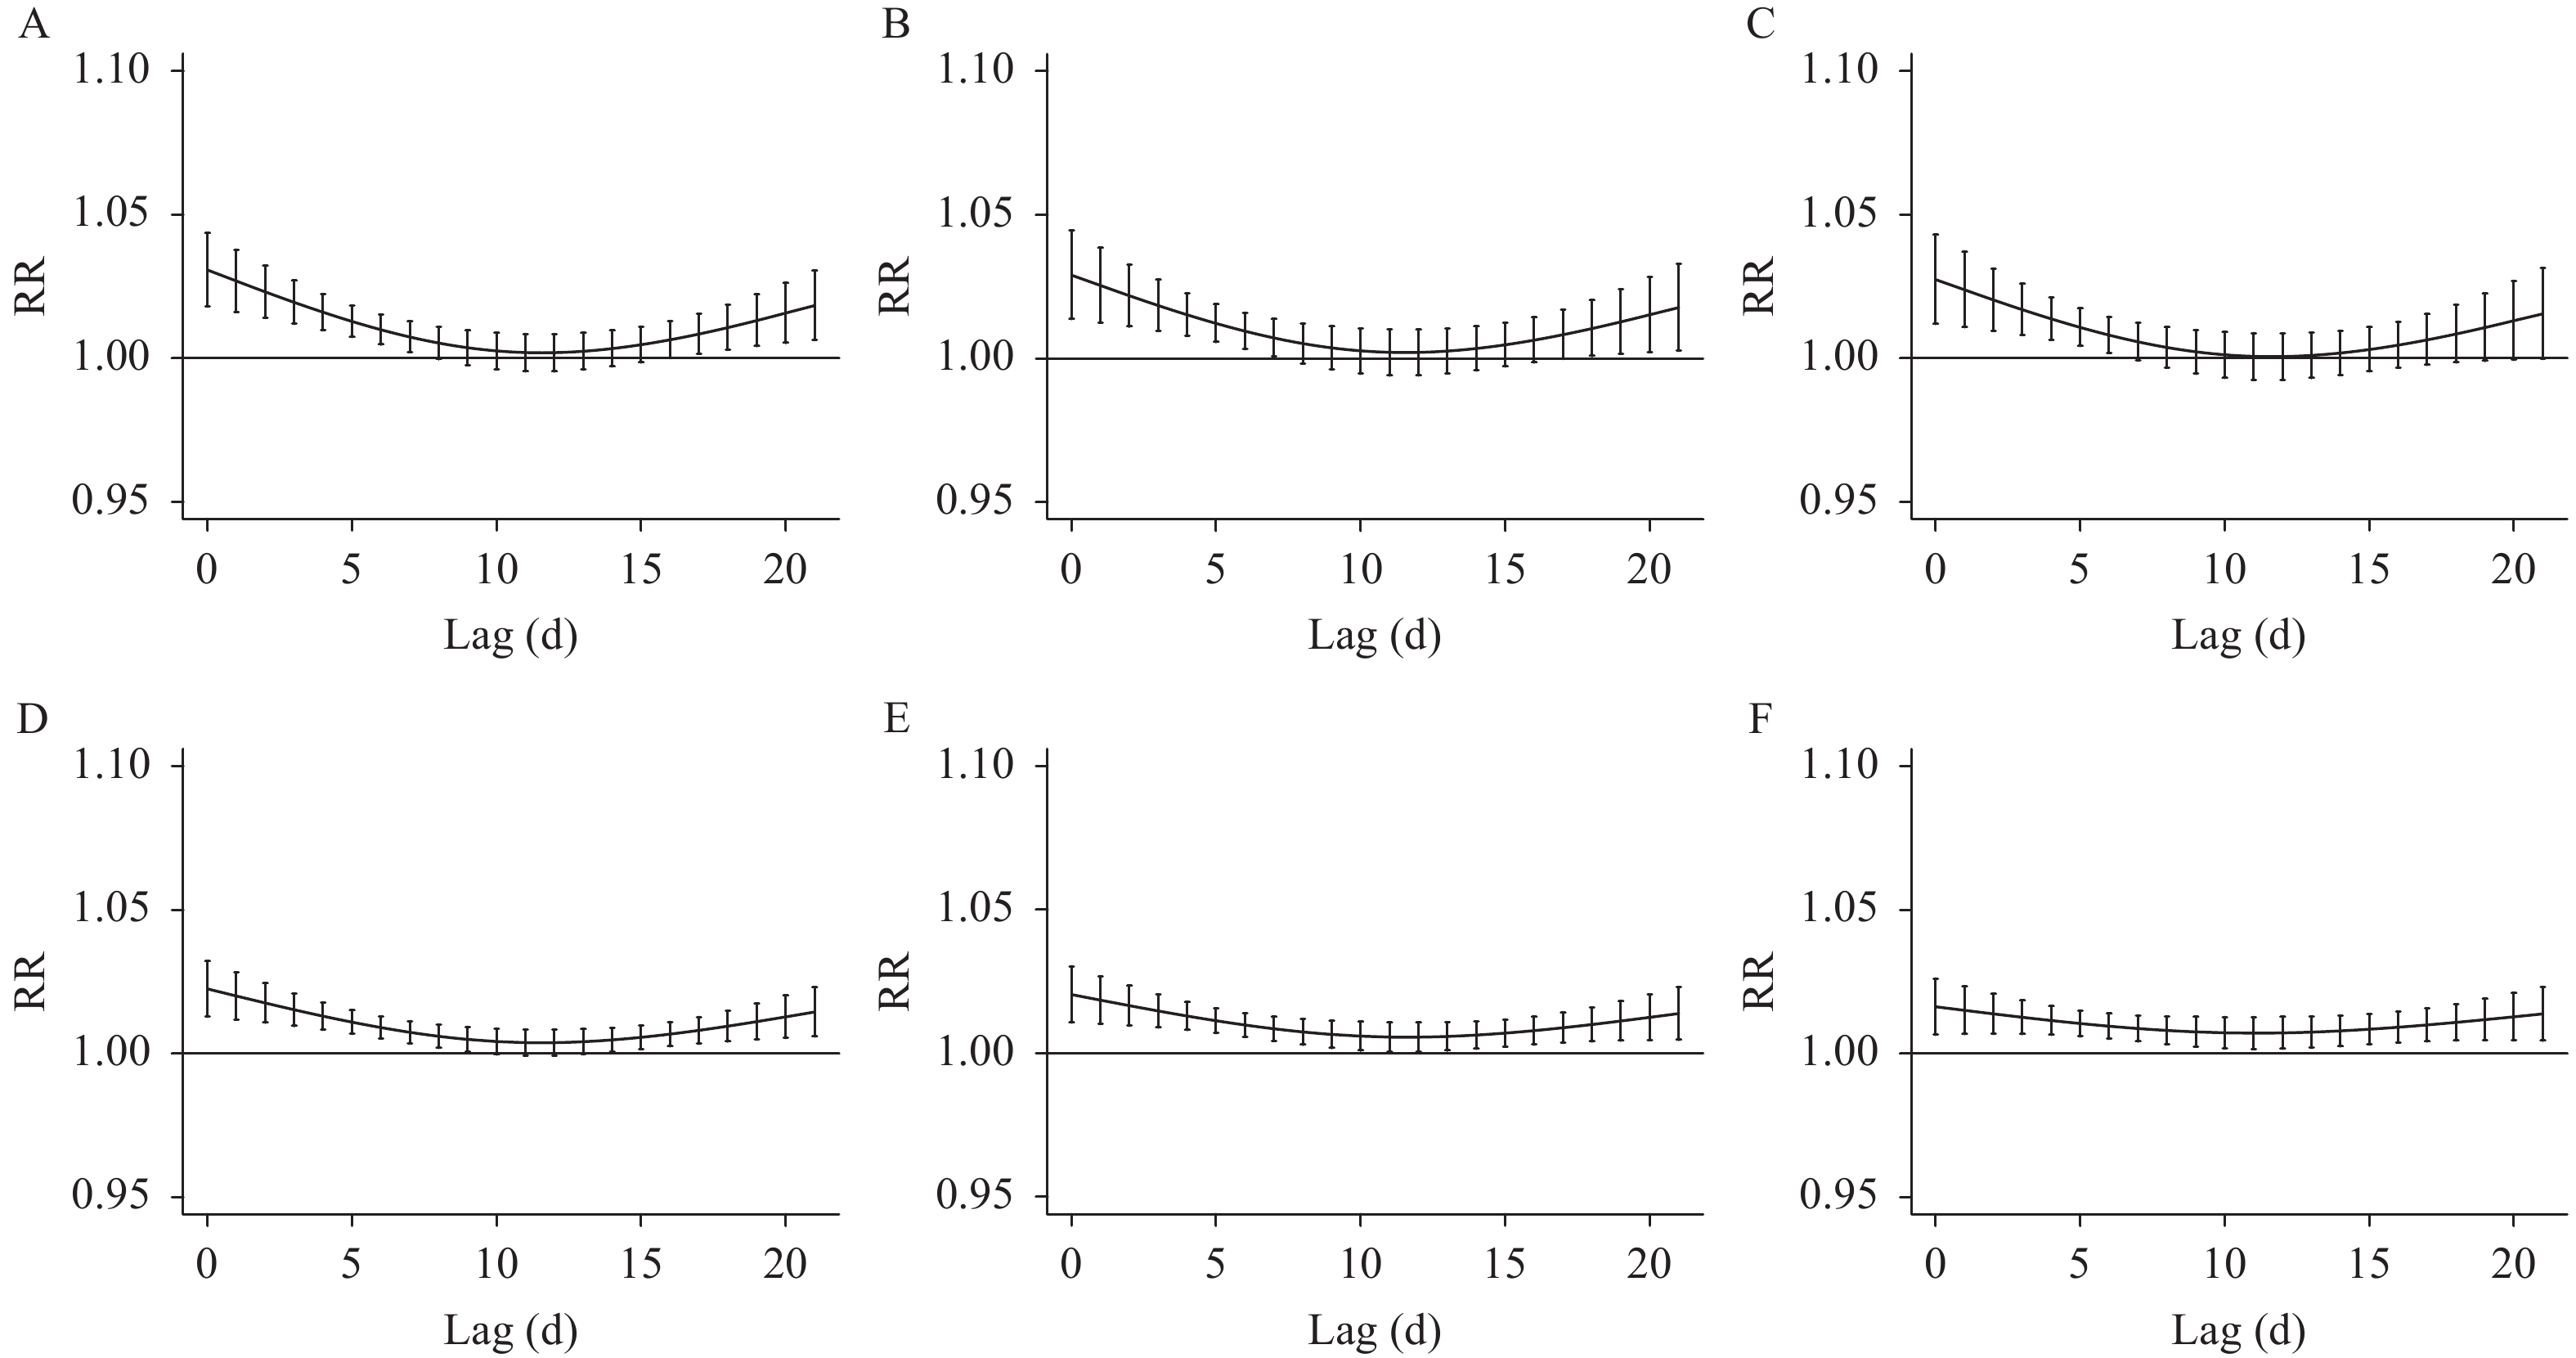 Figure 1.
Lag-response associations between cold spells and total death under 6 different definitions in cold seasons of Ningbo, China, 2014–2018.
Note: “A–F” refers to 6 different definitions of cold spells, which were defined as days when the daily mean temperature was at or below the P10 (5.5℃) or P5 (3.9℃) percentile for at least 2, 3, or 4 consecutive days during the study period. (A) P5, ≥2 consecutive days; (B) P5, ≥3 consecutive days; (C) P5, ≥4 consecutive days; (D) P10, ≥2 consecutive days; (E) P10, ≥3 consecutive days; (F) P10, ≥4 consecutive days.Abbreviations: P5=the 5th percentile; P10=the 10th percentile; RR=relative risk.
HTML
| Citation: |

|