
 Download:


HTML
-
Cancer has become a major threat to public health in China (1). GLOBOCAN 2020 showed that there were approximately 4.6 million new cancer cases and 3.0 million cancer deaths in China in 2020, accounting for 23.7% of the total new cancer cases and 30.2% of cancer deaths worldwide, although China only makes up 18.6% of the global population (2). The burden of cancer continues to increase as population aging accelerates and exposure to cancer-related risk factors increases (3).
Previous reports have noted that the cancer mortality in areas along the Huai River in Anhui, Henan, Jiangsu, and Shandong provinces was higher than the national level during 2004–2006 (4-5). An integrated cancer prevention and control program has been implemented to reduce cancer risk in the region since 2007. The program selected 14 representative rural counties and districts along the Huai River as key areas for cancer intervention including cancer screening, environmental improvement, and health education, etc. It has also gradually improved the integrated health and environment surveillance system that tracks deaths, birth and birth defects, drinking water quality, etc. (1,6).
Evaluating cancer mortality trends and analyzing the impact of cancer on life expectancy (LE) can help better understand the burden of disease caused by cancer and provide a basis for assessing the effectiveness of cancer intervention program (7). Therefore, based on the National Cause-of-Death Surveillance data, this study analyzed the trends of cancer mortality and the impact of cancer death on LE in key areas along the Huai River of the 4 provinces from 2008 to 2018.
-
Based on cancer prevalence level, geographical features, and routine environmental monitoring sites, 14 counties (districts) were selected as the key areas of the cancer prevention and control program in the 4 provinces to reduce the cancer burden in the region along the Huai River: Lingbi County, Mengcheng County, Shou County, Yingdong District, and Yongqiao District in Anhui Province; Fugou County, Luoshan County, Shenqiu County, and Xiping County in Henan Province; Jinhu County, Sheyang County, and Xuyi County in Jiangsu Province; and Juye County and Wenshang county in Shandong Province. Data on cancer death in the 14 counties (districts) — all rural areas — and national rural areas between 2008 and 2018 were obtained from the National Cause-of-Death Surveillance. ICD-10 codes (C00-C97) were used to confirm cancer deaths.
CDCs at all levels were responsible for the quality control of the National Cause-of-Death Surveillance. Village doctors or community doctors routinely collected and reported death and population information. The data were regularly checked with public security and civil affairs departments. Under-reporting surveys were conducted annually or every three years to adjust the estimation of cancer mortality (7). The standardized mortality rate (SMR) was calculated based on the population structure of the sixth national census.
LE in this study referred to the LE of the 0-year group in the abbreviated LE table. Cause eliminated life expectancy (CELE) referred to the LE after eliminating deaths caused by a certain disease and was calculated by compiling an abbreviated LE table of causes of cancer deaths (8). Potential gains in life expectancy (PGLEs) referred to the years of increased LE in a population after removing a specific cause of death, which was calculated by subtracting LE from CELE (9). The rate of life lost referred to the proportion of PGLEs in LE (10). The Arriaga decomposition method was used to estimate the contribution of the change in age-specific mortality to the change in LE (11).
SAS(version 9.4; SAS Institute Inc., Cary, USA) was used for statistical analysis and Microsoft Office Excel (version 2019; Microsoft, USA) was used for data visualization. Joinpoint Regression Program (version 4.9.0.0; Information Management Services, Inc, Calverton, MD, USA) was used to calculate the average annual percentage change (AAPC) of cancer mortality at P < 0.05 (two-sided).
-
From 2008 to 2018, the total population in key areas of 4 provinces decreased from 12,452,653 to 11,732,726. During the study period, there were 909,916 total deaths in these key areas, of which 206,179 (22.66%) were due to cancer. The SMR of cancer decreased (AAPC=–3.09%, P<0.001). The trends of SMR for different gender groups were similar to the overall trend, and cancer SMR for men was consistently higher than that for women. From 2008 to 2018, national average SMR of cancer in Chinese rural areas also showed a decreasing trend (AAPC=−2.53%, P<0.001). SMR in study areas was higher than the national average level of rural areas by 16.68/100,000 in 2008, but the difference decreased to 1.19/100,000 in 2018 (Table 1 and Figure 1).
Year Death Crude mortality rate
(/100,000)Under-reporting adjusted
mortality rate (/100,000)SMR in study area
(/100,000)SMR in national rural
areas (/100,000)2008 19,441 156.12 171.63 198.30 181.62 2009 19,032 150.07 164.02 187.21 174.11 2010 19,646 155.80 170.22 193.18 172.49 2011 19,880 174.07 187.89 189.14 160.51 2012 19,222 167.40 180.52 164.75 161.82 2013 19,131 166.88 179.69 165.29 159.78 2014 19,446 169.25 183.19 164.60 160.58 2015 20,027 173.55 184.86 163.49 150.12 2016 20,387 174.50 186.03 155.10 142.47 2017 20,180 172.34 183.43 153.38 142.70 2018 19,687 167.80 178.40 140.99 139.80 AAPC (%) 0.40 1.15 0.81 −3.09 −2.53 P 0.058 0.010 0.037 <0.001 <0.001 Abbreviations: SMR=standardized mortality rate; AAPC=average annual percentage change. Table 1. Cancer mortality in key areas of 4 provinces and in national rural areas in China, 2008–2018.
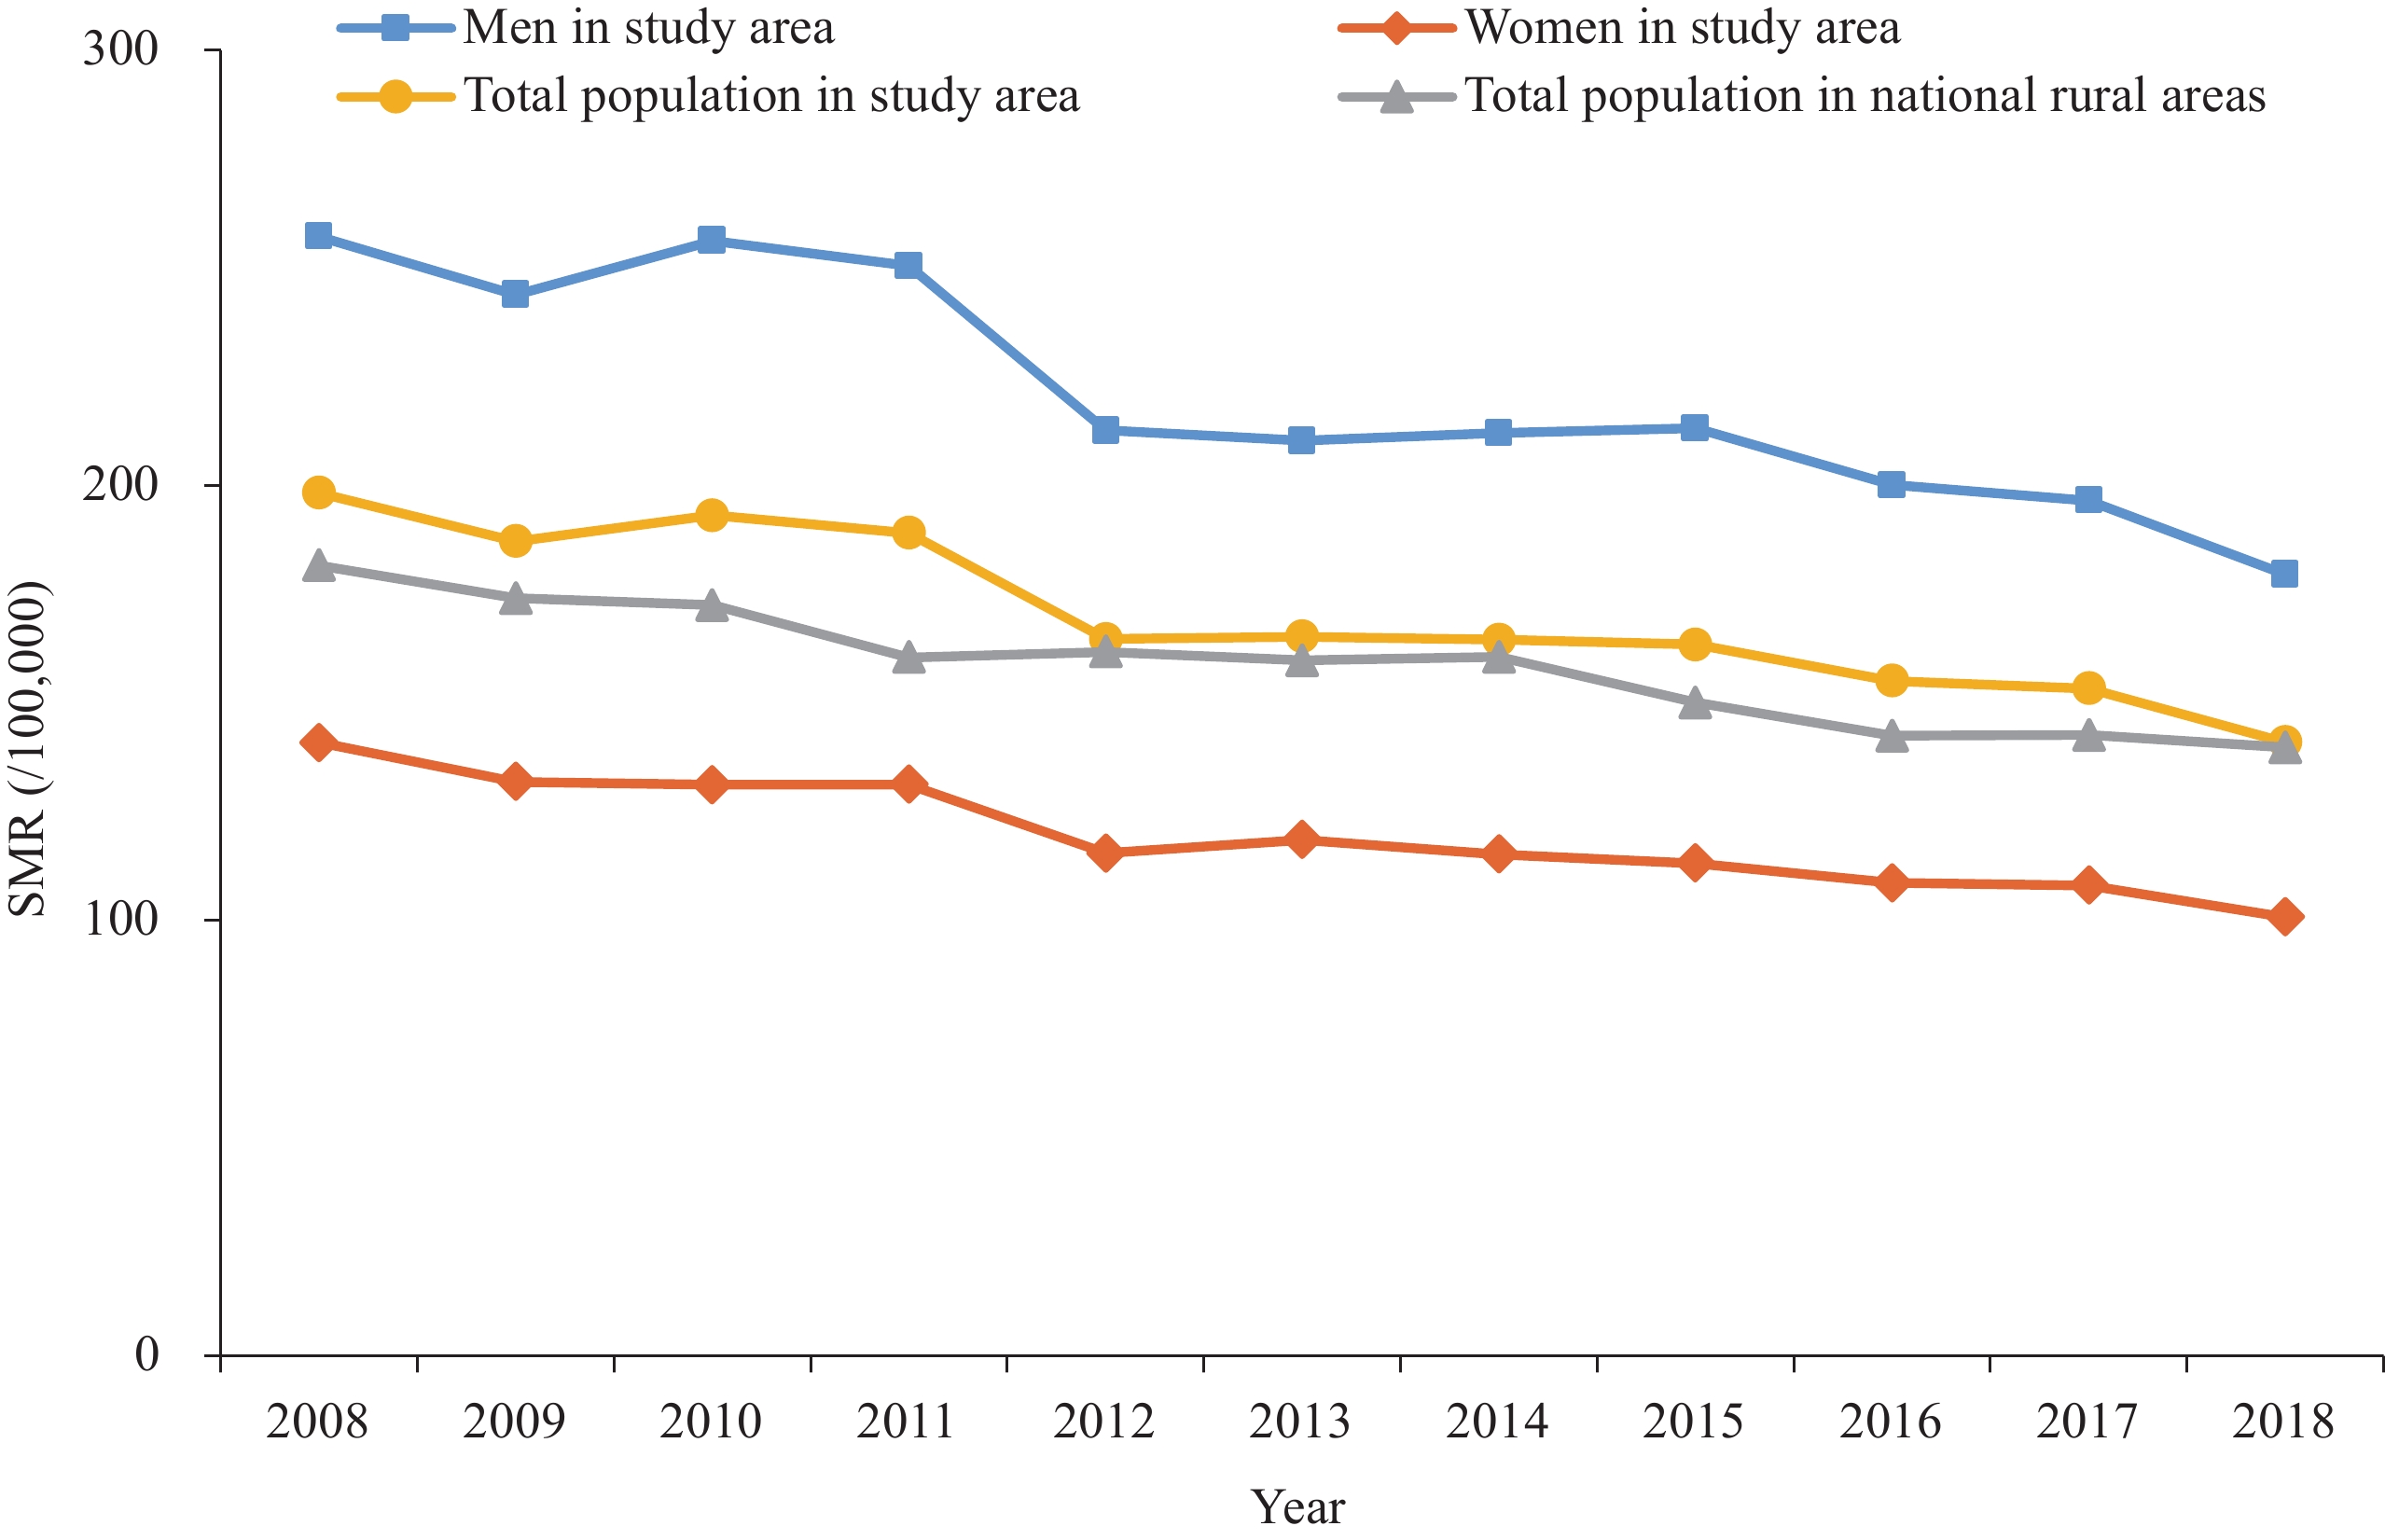 Figure 1.
Trends of cancer SMR in key areas of 4 provinces and in national rural areas in China, 2008 to 2018.
Abbreviation: SMR=standardized mortality rate.Among the 4 provincial key areas from 2008 to 2018, there was little change in cancer mortality in people aged under 40 years old and a marked decrease in cancer mortality of those aged 40 years or older, except for the 50–54 age group, in which cancer mortality increased 71.65/100,000 (Table 2).
Age group (years) Cancer mortality (/100,000) Change (/100,000) 2008 2018 0 5.07 5.44 0.37 1−4 5.06 3.21 −1.85 5−9 3.76 4.58 0.82 10−14 3.03 6.11 3.08 15−19 5.34 3.58 −1.76 20−24 5.73 4.25 −1.48 25−29 10.97 13.32 2.34 30−34 18.04 18.69 0.65 35−39 31.72 25.32 −6.40 40−44 64.99 34.95 −30.04 45−49 123.61 85.07 −38.54 50−54 192.87 264.52 71.65 55−59 297.78 200.37 −97.40 60−64 537.19 401.48 −135.71 65−69 805.56 614.98 −190.58 70−74 1,141.87 878.25 −263.61 75−79 1,539.41 1,035.42 −504.00 80−84 2,028.91 1,196.76 −832.15 85− 3,771.44 1,410.41 −2,361.02 Table 2. Cancer mortality for different age groups in key areas of 4 provinces in China, 2008 and 2018.
Overall, changes in cancer mortality contributed positively to the increase in LE in the key areas of 4 provinces between 2008 and 2018. The higher positive contribution was in the age group 55 years or older, the greatest contribution was in the age group of 75 to 79 years old (0.12 years, 2.90%), and the greatest negative contribution was in the age group of 50 to 54 years old (−0.09 years, −2.20%). Compared to men, the change in cancer mortality in women contributed less to the increase in LE (Figure 2).
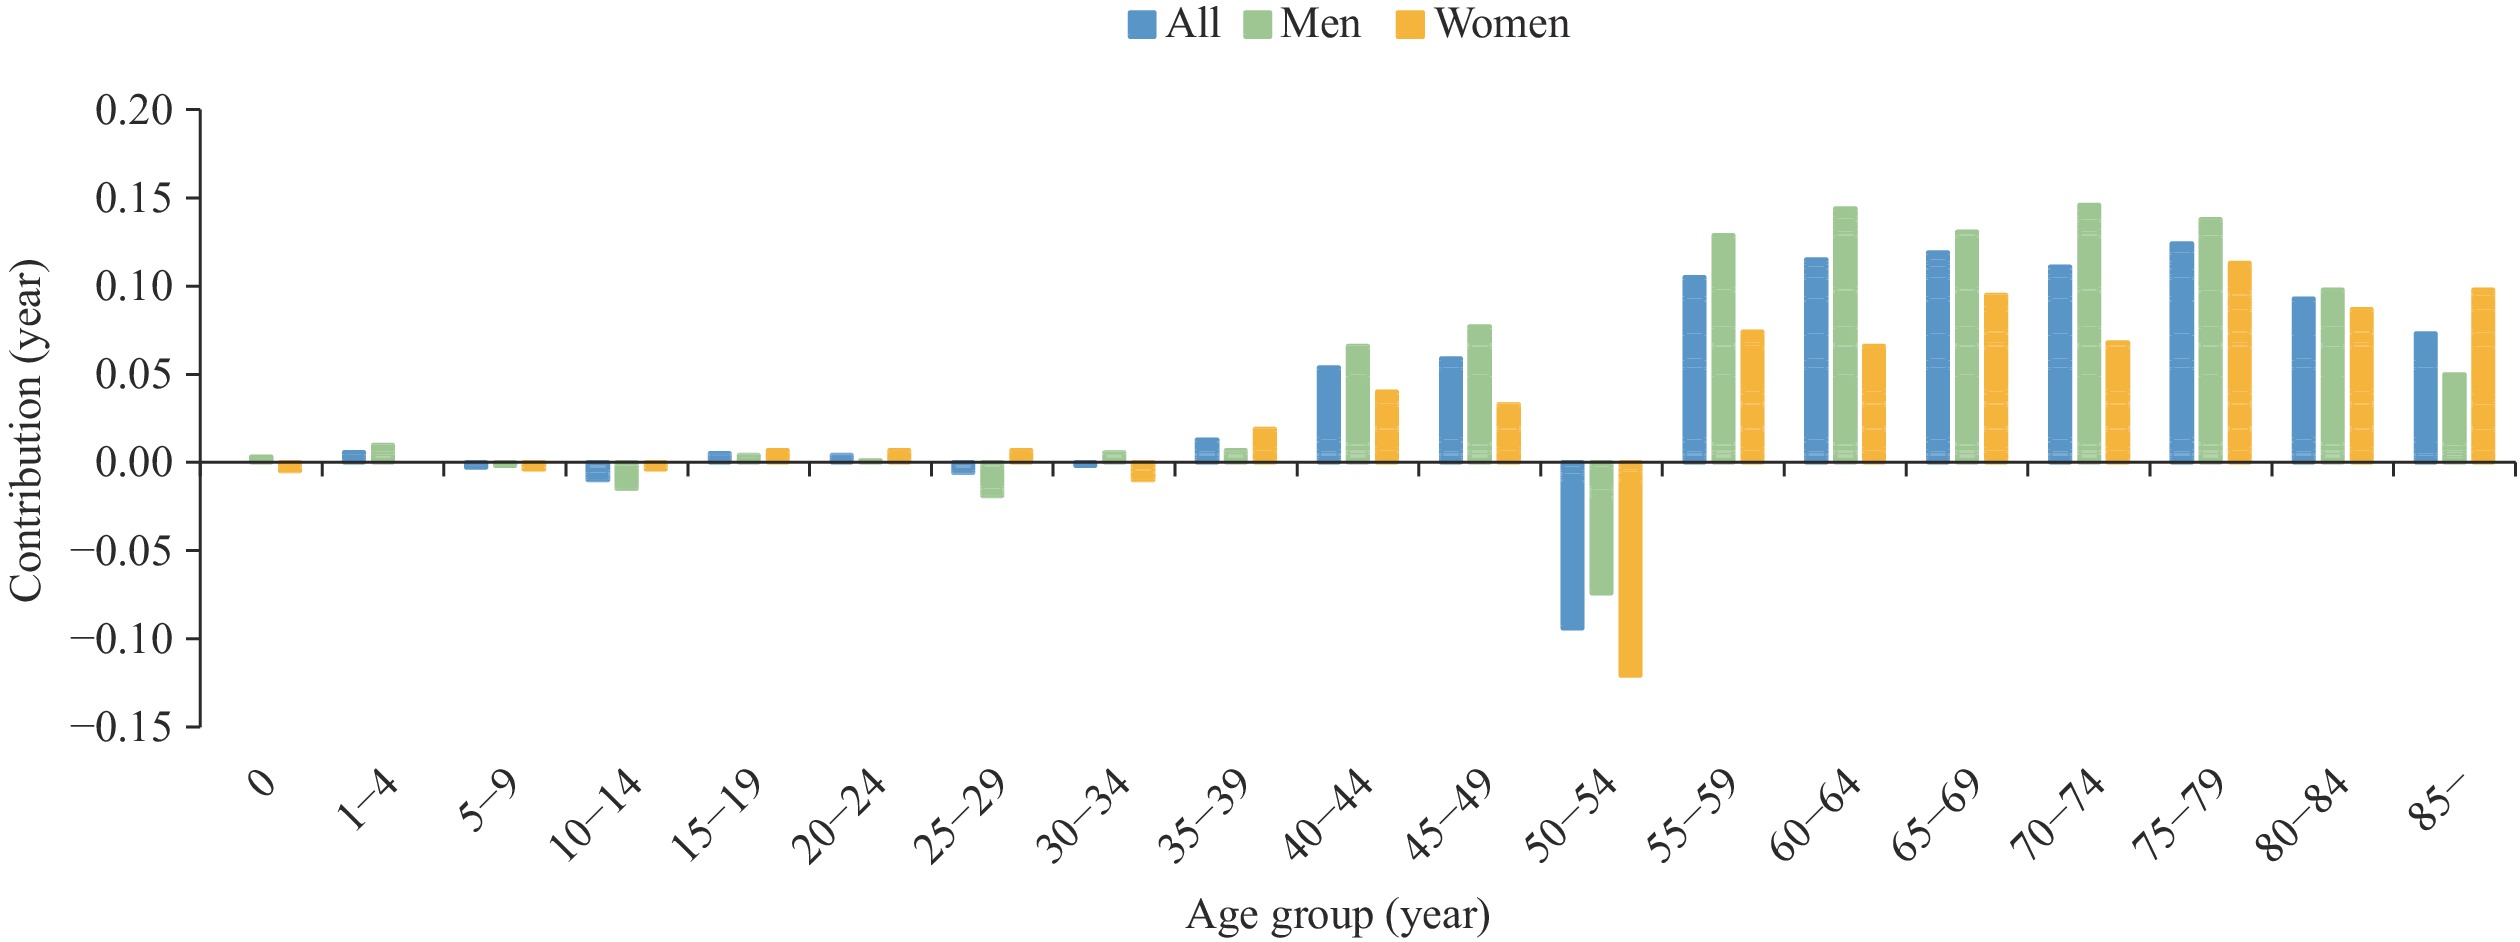 Figure 2.
Contribution of changes in cancer mortality to LE by sex and age group, key areas of 4 provinces in China, between 2008 and 2018.
Abbreviation: LE=life expectancy.LE in the key areas of 4 provinces increased by 4.27 years from 2008 (74.07 years) to 2018 (78.34 years), with an increase of 3.94 years for men and 4.54 years for women. Cancer CELE increased by 4.59 years, PGLEs increased by 0.32 years and the rate of life lost increased by 0.21%. Between 2008 and 2018, LE and cancer CELE were consistently higher for women than for men, and PGLEs and rate of life lost rates were consistently lower for women than for men (Table 3).
Year LE (years) CELE (years) PGLEs (years) Rate of life lost (%) All Men Women All Men Women All Men Women All Men Women 2008 74.07 71.68 76.79 76.82 74.85 78.90 2.75 3.17 2.11 3.71 4.42 2.75 2009 74.83 72.47 77.52 77.47 75.52 79.54 2.64 3.05 2.02 3.53 4.21 2.61 2010 74.33 71.73 77.35 77.00 74.83 79.34 2.67 3.10 1.99 3.59 4.32 2.57 2011 74.49 71.61 77.71 77.33 74.86 79.90 2.84 3.25 2.19 3.81 4.54 2.82 2012 75.85 73.00 79.09 78.80 76.32 81.43 2.95 3.32 2.34 3.89 4.55 2.96 2013 76.15 73.58 79.01 79.16 76.99 81.41 3.01 3.41 2.40 3.95 4.63 3.04 2014 76.60 73.87 79.68 79.70 77.40 82.12 3.10 3.53 2.44 4.05 4.78 3.06 2015 76.91 74.15 79.97 80.06 77.76 82.42 3.15 3.61 2.45 4.10 4.87 3.06 2016 77.67 74.95 80.67 80.90 78.67 83.18 3.23 3.72 2.51 4.16 4.96 3.11 2017 77.85 75.16 80.85 81.06 78.83 83.36 3.21 3.67 2.51 4.12 4.88 3.10 2018 78.34 75.62 81.33 81.41 79.12 83.77 3.07 3.50 2.44 3.92 4.63 3.00 Abbreviations: LE=life expectancy; CELE=cause eliminated life expectancy; PGLE=potential gains in life expectancy. Table 3. LE, cancer CELE, PGLEs and rate of life lost in key areas of 4 provinces in China, 2008 to 2018.
-
The study presented a decreasing trend of cancer mortality and a positive effect of this change on LE in the key areas of the four provinces between 2008 and 2018, based on the long-term and high-quality surveillance data of cancer mortality. The results indicated that the integrated cancer intervention program was effective in reducing cancer mortality in this region. However, the increase in the rate of life lost illustrated the increased contribution of cancer to LE during the study period, highlighting the necessity of the constant and strengthened cancer prevention and program and cancer surveillance in this region.
To extend healthy LE and improve health equity, the Chinese government has initiated Healthy China 2030 — a national strategy which aims to mobilize governments and relevant departments at all levels to actively create a healthy ecological and social environment, encouraging individuals to adopt a healthy lifestyle. Cancer prevention is a critical component of this national strategy. Our results found that the cancer mortality in key areas of four provinces was still higher than the national average level in rural areas, although the cancer mortality in key areas decreased more strikingly. Sustained efforts on intensive environmental improvement, healthy lifestyles promotion, cancer screening, and cancer early diagnosis and treatment are still needed in the region to continue the downward trend in cancer death and realize the goal of Healthy China 2030 (1).
The analysis of the contribution of cancer mortality by age group to LE found that the decline in cancer mortality in the age of 55 years or older played a greater positive role in the increase in LE of the study population. The greatest contribution was seen in the age group of 75 to 79 years old, the group with the highest cancer incidence (12), suggesting that the effects of interventions were more pronounced in those with a high prevalence of cancer. In contrast, the change in cancer mortality in the age group of 50 to 54 years old played a negative role in LE. Considering the statistical principles, the increased cancer mortality in the age group of 50 to 54 years old could partially explain the increase in the rate of life lost due to cancer in this age group. The same result has been observed in the contribution of cancer mortality to LE in the overall rural areas of China, according to the National Cause-of-Death Surveillance Dataset. Although further exploration is needed for its specific reason, this finding implies that greater attention should be paid to the cancer prevention and control in this age group.
This study found that cancer CELE increased in key areas of the 4 provinces from 2008 to 2018, while PGLEs and the rate of life lost increased, suggesting an increase in the proportion of life lost due to cancer among all causes of death. This could be due to population aging increasing the burden of cancer (12) or this may be associated with a more rapid decline in the disease burden of other chronic diseases and infectious diseases (13). These results indicated that the burden of cancer in the study region could not be overlooked. Constant efforts in cancer prevention and control are needed to reduce the rate of life lost from cancer in the context of an aging population.
There were some limitations in this study. First, although we have adjusted the under-reporting of mortality in the data analysis, we could not fully rule out the under-reporting of mortality that might have led to the overestimation of LE. Second, this study provided a comprehensive analysis of the overall disease burden of cancer without the estimates for cancer of different types. Further studies on the estimation of disease burden and risk factors of different cancer types in sub-counties (districts) are needed to provide a reference for policy formulation tailored for different cancer types and risk factors.
In summary, cancer SMR in key areas of 4 provinces in China gradually decreased from 2008 to 2018 and the changes in cancer mortality made a positive contribution to the increase of LE, indicating the success of the comprehensive cancer prevention and control program in the region. However, the increase in the rate of life lost due to cancer call for sustained cancer control effort to further reduce the burden of cancer. Local governments need to further strengthen environmental improvement, enhance health education on cancer prevention, and carry out cancer early diagnosis and treatment programs, particularly for the population aged 50 to 54 years old. Continuous surveillance is needed to assess the long-term effects of these interventions.
-
No conflicts of interest reported.
-
All staff from local CDCs involved in the Cause-of-Death Surveillance in the study areas.
| Citation: |

|