

 Download:


-
Cardiovascular disease (CVD) is the single largest contributor to global mortality and accounts for more than 40% of deaths in China (1). However, no available indicators were found before 2016 that could comprehensively evaluate different aspects of CVD prevention and treatment. Most of the metrics previously created for CVD mainly focused on certain field (prevalence of CVD, prevention, etc). In May 2017, the China Cardiovascular Health Alliance, together with the National Center for Chronic and Noncommunicable Disease Control and Prevention, China CDC, as well as other institutions jointly released the China cardiovascular health index (CHI) after a one-year expert consultation, data collection, and statistical analysis, which consists of 52 indicators from 5 dimensions (2). From 2017 to 2021, 3-rounds of data from official sources or the most widely recognized national database were adopted to update the CHI. Among the 31 provincial-level administrative divisions (PLADs), Shanghai, Beijing, Zhejiang, Fujian, and Jiangsu always ranked in the top 5, while Guizhou and Xizang (Tibet) always ranked in the last 5. These findings will help provincial governments customize future CVD prevention and treatment work plans. This paper uses the 3-round CHI to clarify cardiovascular health status in the 31 PLADs.
The primary purpose of the CHI was to comprehensively evaluate different aspects of CVD prevention and treatment. At the beginning of CHI development, the inclusion criteria for the indicators were discussed and those scientific, interventive, and measurable indicators were agreed to be incorporated. Second, CVD-related indicators were collected from experts in multiple fields and a pool of indicators was first proposed. Third, a two-round Delphi expert consultation was carried out and the final CHI consists of 52 indicators from 5 dimensions: the prevalence of CVD, risk factor exposure, prevention and control of risk factors, treatment of CVD, and public health policy and service capacity. Fourth, the analytic hierarchy process was adopted to determine the weight of each indicator, and the weights of the 5 dimensions mentioned above were 20.70%, 10.04%, 36.56%, 18.12%, and 14.58%, respectively. Fifth, data of the 52 indicators were collected from the most official sources or the most widely recognized database, including national surveillance such as Chinese Chronic Disease and Risk Factors Surveillance (3), registration systems such as National Death Registration System (4), scientific research covering all PLADs such as Improving Care for Cardiovascular Disease in China (CCC project) (5), as well as the China Health Statistics Yearbook. Sixth, all original data were cleaned through data orientation, and standard normal transformation and percent score for each indicator was computed. Finally, the weighted percent score of each indicator was summed as the CHI. Therefore, the CHI ranged from 0 to 100. The higher the CHI score was, the better cardiovascular health status was. YAAHP (version 10.4, Metadecsn Corp, Shanxi, China) was used to calculate weights and SAS software (version 9.3, SAS Institute, Cary, NC, USA) was used for data processing and statistical analysis. Figure 1 was the flow chart of the construction of the CHI, and more details could be found elsewhere (2).
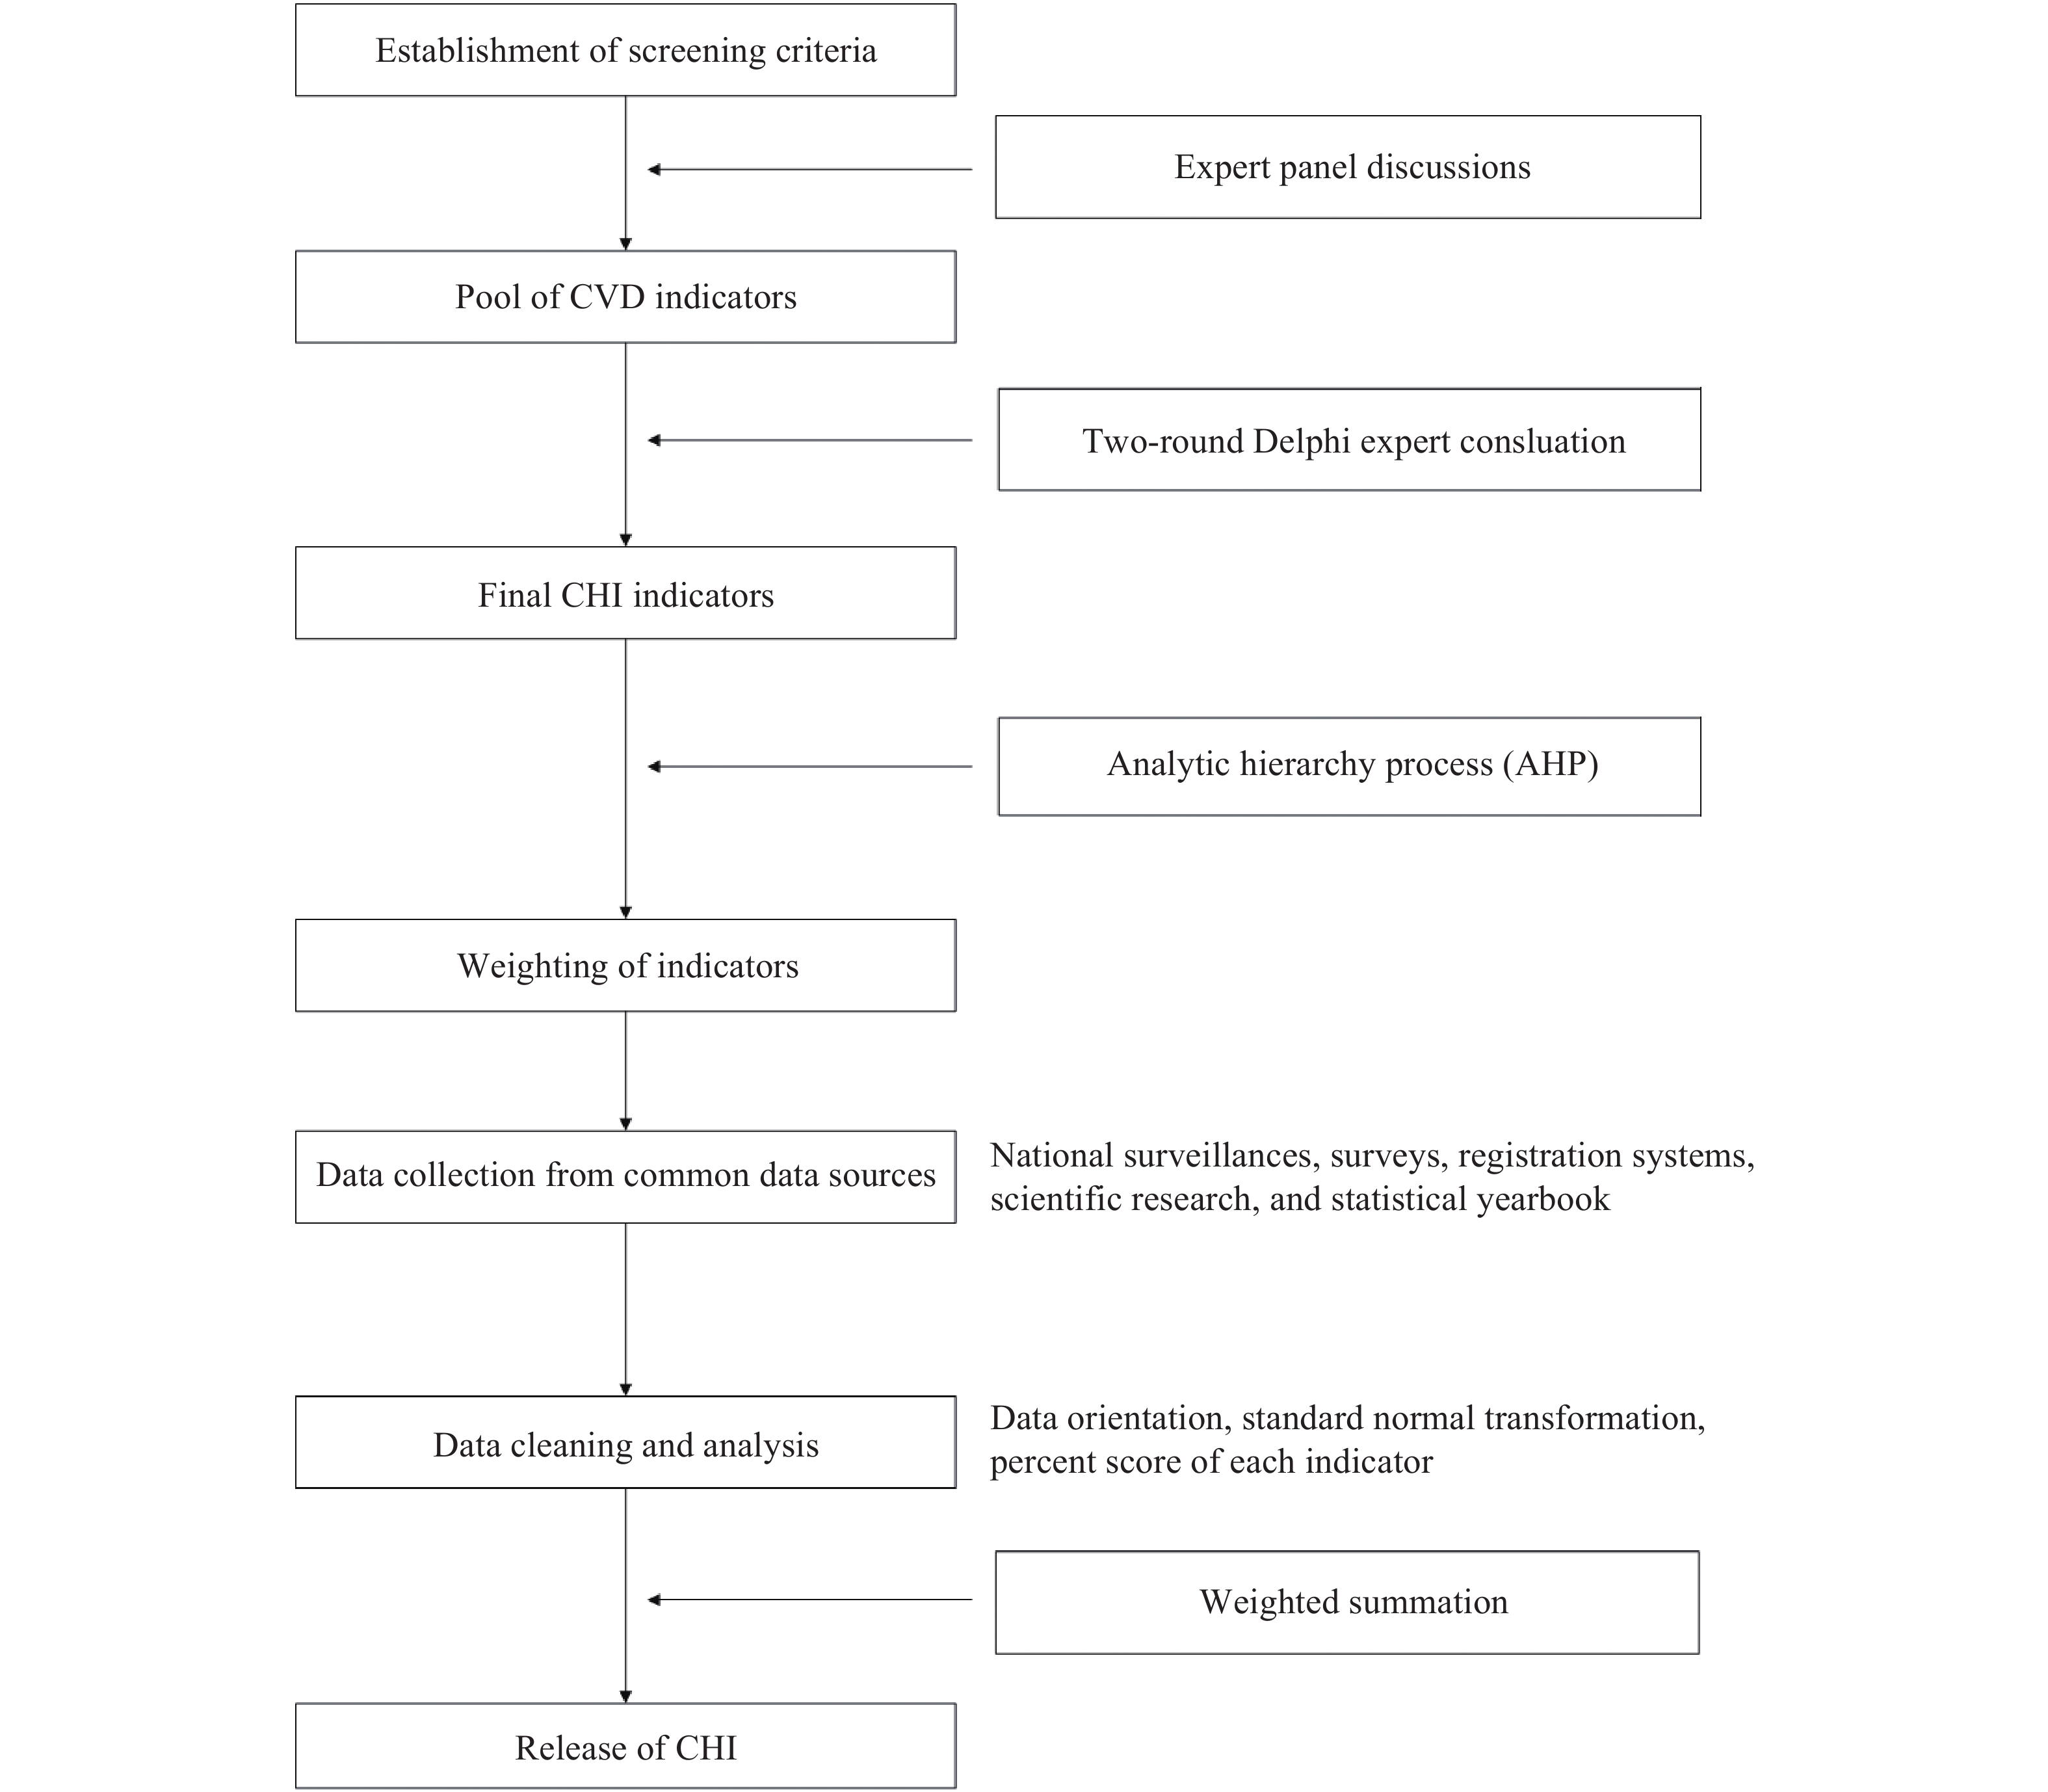 Figure 1.
Flow chart of the construction of the CHI.
Abbreviations: CVD=cardiovascular disease; CHI=cardiovascular health index.From 2017 to 2021, the CHI was updated 3 times and CVD prevention and treatment status in 31 PLADs were compared. All data were first collected from common sources rather than self-reported data to ensure comparability. Second, data of the 52 indicators were updated to the corresponding latest data at each round to ensure timeliness. Third, the mean and standard deviation of certain indicators in 2017 were always adopted afterwards to make normal transformations until the definition or measurement methods were updated to reflect the improvement of certain indicators. In 2019 and 2021, though the dimensions and indicators did not change, definition or measurement of 19 indicators were updated in 2019 and 3 indicators were updated again in 2021. Thus, the CHI score was more comparable between 2021 and 2019 than that between 2019 and 2017.
From 2017 to 2021, multiple indicators have been improved at the national level, which leads to score increase of those indicators in most PLADs. For example, the probability of premature deaths from the total cardiovascular disease declined from 8.74% to 7.19%. The number of certified chest pain centers increased from 181 to 1,672. However, there were also some indicators getting worse at the national level, such as the overweight rate and number of CDC professionals, which may lead to declining scores. Table 1 showed the changes of some indicators.
Indicator CHI 2017 CHI 2019 CHI 2021 Probability of premature deaths from the total cardiovascular disease (%) 8.74 8.24 7.19 Overweight rate (%) 31.30 32.74 33.56 Concentration of PM2.5 (μg/m3) 50.00 43.00 36.00 Number of chest pain centers 181 3,707* 4,743† Proportion of STEMI patients receiving reperfusion therapy (%) 56.84 62.10 67.40 In-hospital mortality of AMI patients (%) 5.71 5.31 4.60 Residents’ health literacy level (%) 10.25 14.18 19.17 Number of practicing (assistant) physicians (per million of people) 2210.89 2441.79 2761.98 Number of CDC professionals (per ten thousand people) 1.39 1.37 1.34 Number of general practitioners (per ten thousand people) 1.37 1.82 2.61 Abbreviations: CVD=cardiovascular disease; CHI=cardiovascular health index; PM2.5=particulate matter 2.5; STEMI=ST-segment elevation myocardial infarction; AMI=acute myocardial infarction.
* 2,924 chest pain centers under construction but not yet certified were contained.
† 3,071 chest pain centers under construction but not yet certified were contained.Table 1. The change trend of some CVD-related indicators from CHI — China, 2017–2021.
In 2017, Beijing had the highest score of CHI and Xizang (Tibet) had the lowest score. In 2021, Shanghai ranked first and Xizang (Tibet) still ranked last. Although provincial rankings changed across years, some trends were still observable. Among the 31 PLADs, Shanghai, Beijing, Zhejiang, Fujian, and Jiangsu always ranked in the top 5 while Guizhou and Xizang (Tibet) always ranked in the last 5. From 2019 to 2021, the national CHI score increased from 50.37 to 57.42 points, with an increase of 7.05 points. Overall, 28 of the 31 PLADs had more CHI scores except for Zhejiang, Jilin, and Ningxia; 15 of the 31 PLADs exceeded the national level and Sichuan had the highest score at 15.73 points, which can be found in Table 2.
PLADs CHI 2017 CHI 2019 CHI 2021 CHI 2021 minus
CHI 2017CHI 2021 minus
CHI 2019Score Rank Score Rank Score Rank Shanghai 75.33 2 78.12 2 83.27 1 7.95 5.15 Beijing 75.37 1 76.29 3 79.62 2 4.25 3.33 Zhejiang 74.40 3 78.40 1 77.88 3 3.49 −0.51 Fujian 61.63 5 64.75 5 75.22 4 13.60 10.47 Jiangsu 71.80 4 67.73 4 72.35 5 0.55 4.62 Tianjin 60.49 6 58.49 7 66.85 6 6.36 8.36 Guangdong 59.19 7 56.53 8 66.71 7 7.52 10.18 Shandong 52.90 8 52.23 10 64.01 8 11.12 11.79 Sichuan 50.12 10 47.98 16 63.70 9 13.59 15.73 Ningxia 47.36 12 63.50 6 62.19 10 14.83 −1.31 Hubei 45.99 14 49.41 12 62.09 11 16.10 12.68 Xinjiang 46.96 13 52.05 11 61.85 12 14.89 9.80 Chongqing 52.12 9 54.89 9 60.30 13 8.18 5.41 Jiangxi 48.01 11 48.77 14 58.26 14 10.25 9.49 Hunan 44.41 15 42.05 22 56.31 15 11.90 14.26 Henan 42.62 20 40.77 27 55.70 16 13.08 14.92 Anhui 43.62 17 45.73 18 55.22 17 11.60 9.48 Hainan 42.28 21 48.59 15 55.19 18 12.92 6.61 Inner Mongolia 38.76 24 41.20 23 53.25 19 14.49 12.05 Shanxi 38.05 26 46.05 17 52.66 20 14.61 6.61 Yunnan 37.99 27 44.12 19 50.98 21 12.99 6.86 Qinghai 42.90 19 48.88 13 50.39 22 7.49 1.51 Gansu 44.18 16 41.00 24 49.82 23 5.64 8.82 Hebei 43.44 18 43.60 21 49.56 24 6.12 5.96 Shaanxi 36.24 28 40.83 25 48.32 25 12.08 7.50 Heilongjiang 33.63 29 33.50 31 44.01 26 10.38 10.51 Guangxi 38.30 25 40.80 26 43.00 27 4.71 2.21 Guizhou 32.48 30 35.41 30 42.20 28 9.72 6.79 Jilin 39.21 23 43.93 20 40.24 29 1.03 −3.69 Liaoning 39.89 22 38.07 28 39.64 30 −0.25 1.57 Xizang (Tibet) 30.17 31 37.80 29 39.12 31 8.95 1.32 Total 48.06 50.37 57.42 9.36 7.05 Abbreviations: CHI=cardiovascular health index; PLADs=provincial-level administrative divisions. Table 2. The CHI scores and ranks of 31 PLADs — China, 2017, 2019, and 2021.
Table 3 showed the latest provincial performance on each dimension of CHI. Shanghai (19.53), Ningxia (7.26), Beijing (33.06), Beijing (14.13), and Shanghai (12.35) had the highest scores on the five dimensions, respectively. While Heilongjiang (4.07), Tianjin (2.73), Guangxi (10.37), Anhui (5.72), and Xizang (Tibet) (4.58) had the corresponding lowest scores in these dimensions.
PLADs Prevalence of CVD Exposure of risk factors Prevention and control of risk factors Treatment of CVD Public health policy and service capacity Score Rank Score Rank Score Rank Score Rank Score Rank Beijing 17.30 6 3.57 26 33.06 1 14.13 1 11.56 2 Tianjin 12.19 15 2.73 31 28.48 6 13.08 3 10.38 3 Hebei 4.79 30 3.23 30 22.08 17 10.08 13 9.38 7 Shanxi 9.16 21 3.48 28 25.65 12 9.53 19 4.83 29 Inner Mongolia 6.57 27 3.90 24 26.68 8 8.17 27 7.94 13 Liaoning 7.31 25 4.07 23 13.93 27 8.32 26 6.01 26 Jilin 6.68 26 3.62 25 13.93 28 9.70 17 6.31 24 Heilongjiang 4.07 31 4.53 21 18.01 22 9.60 18 7.79 14 Shanghai 19.53 1 5.48 13 32.34 3 13.57 2 12.35 1 Jiangsu 17.95 5 4.64 19 30.27 5 11.43 9 8.05 12 Zhejiang 19.46 2 5.69 12 30.83 4 13.05 4 8.85 8 Anhui 14.63 11 3.52 27 23.92 15 5.72 31 7.43 16 Fujian 19.34 3 7.16 2 26.29 10 12.24 7 10.19 4 Jiangxi 16.80 7 6.72 4 20.00 19 10.05 14 4.68 30 Shandong 13.32 13 6.21 9 25.98 11 9.00 25 9.50 5 Henan 8.56 24 3.28 29 26.65 9 7.77 28 9.44 6 Hubei 15.30 10 5.31 17 24.66 13 9.84 15 6.98 18 Hunan 12.44 14 4.58 20 20.85 18 12.48 6 5.96 28 Guangdong 18.22 4 6.62 6 22.47 16 11.26 10 8.14 11 Guangxi 12.15 16 6.38 8 10.37 31 7.19 30 6.90 19 Hainan 14.24 12 6.95 3 13.70 29 11.94 8 8.36 9 Chongqing 16.02 8 5.37 15 19.75 20 10.99 12 8.18 10 Sichuan 15.46 9 5.88 11 24.43 14 11.16 11 6.78 21 Guizhou 8.65 23 5.39 14 12.47 30 9.08 24 6.61 22 Yunnan 10.48 19 6.57 7 18.00 23 9.10 23 6.82 20 Xizang (Tibet) 5.18 28 6.63 5 15.03 26 7.70 29 4.58 31 Shaanxi 10.71 18 4.10 22 17.61 24 9.31 22 6.60 23 Gansu 11.41 17 6.00 10 16.95 25 9.48 21 5.97 27 Qinghai 8.87 22 5.33 16 18.93 21 9.49 20 7.77 15 Ningxia 9.66 20 7.26 1 28.47 7 9.76 16 7.04 17 Xinjiang 5.06 29 5.31 18 32.94 2 12.49 5 6.05 25 Total 11.98 5.15 22.41 10.22 7.66 Abbreviations: CHI=cardiovascular health index; CVD=cardiovascular disease; PLADs=provincial-level administrative divisions. Table 3. The scores of each dimension of CHI — China, 2021.
-
The present prevalence of CVD in China is high while effective prevention and proper management is lacking. Prior to the CHI, the provincial-specific priority was unlikely to have been recognized by government or health administrations. CHI was developed to be a practical indicator for each PLAD to comprehensively understand its cardiovascular health status and rankings of each specific field (6). Generally, the prevention and treatment of CVD was constantly improving at the national level from 2017 to 2021. The change of the three-round CHI scores has fully reflected this phenomenon not only at the national level but also at the provincial level, which has confirmed its role as an evaluation indicator of cardiovascular health. Inspired by this evaluation method, the health administration departments of Shandong and Guangdong provinces developed their provincial cardiovascular health index at the city level in 2018 and 2019; their research results have also been released (7).
According to these 3-round results, the eastern and developed PLADs experienced higher CHI scores than those in underdeveloped and western regions. Specifically, PLADs ranked in the top five always had better performance on prevention and control of risk factors, treatment of CVD, and public health policy and service capacity. In the long term, the efforts in these dimensions will reduce the morbidity of CVD and premature death. However, those latter-ranking PLADs, such as Xizang (Tibet) Autonomous Region and Guizhou Province, had poor performance in these areas, which may be related to inadequate medical and health resources (8) and poor healthcare accessibility due to inconvenient transportation. In the future, more resources need to be invested in these PLADs to improve CVD control and prevention.
Though Shanghai ranked first according to the CHI 2021, the indicators of the exposure level of CVD risk factors, which includes the prevalence of obesity, hypertension, etc , had lower rankings among the 31 PLADs, on which more efforts need to be made in future work. In addition, for those PLADs that have declined or improved little over recent years, more attention on CVD prevention and treatment from provincial governments and health administration departments are urgently needed. For each PLAD, CHI will be beneficial for identifying weaknesses in CVD control and prevention and setting priorities for improvement.
Based on 7 cardiovascular disease risk factors or health behaviors, the American Heart Association developed a new definition of ideal cardiovascular health for adults and children in 2010. Then the percentage with ideal cardiovascular health (9) and age-adjusted prevalence of cardiovascular health index (10) were adopted to evaluate status of cardiovascular health in the 51 States. Unlike this metric, China CHI was more comprehensive, including exposure and prevention of risk factors, health behaviors, clinical diagnosis and treatment, public health policy, and medical and health resources. In addition, a percent score was more sensitive to capture minor progress than simple grades, which may encourage each evaluation object to continue their effort to improving scores.
This study was subject to some limitations. First, the accessibility of data had been regarded as a critical condition during the selection of indicators. Therefore, some currently unmeasured but important indicators such as incidence of CVD were not yet incorporated. Second, this study was mainly descriptive and more in-depth analysis on the impact that socioeconomic factors have on the overall CHI should be explored.
Acknowledgements: Fan Mao and Yingying Jiang contribute equally to this work.
HTML
| Citation: |

|