-
Aerosol transmission of coronavirus disease 2019 (COVID-19), caused by severe acute respiratory syndrome coronavirus 2 (SARS-CoV-2), has been confirmed in many studies (1-3). Previous studies have shown that the highest concentration of outbreak cases outside of the Hubei Province came from indoor environments (4), especially ones with overcrowding and poor ventilation. A previous theoretical model predicted that a ventilation rate above 36 m3/h per person can effectively reduce the risk of aerosol infection when people socially distance (5); however, this has not been confirmed by real-world data.
Overall, 2 COVID-19 outbreaks in the dormitory buildings in Hubei and Shandong Province — with different mask wearing habits and rates of indoor ventilation — were analyzed in February 2020. From June 5–13, 2020, an onsite investigation was conducted. The epidemiological data were collected and ventilation conditions were investigated at the time of occurrence. Preliminary information of the cases was obtained, including dates of symptom onset, mask wearing habits, and detailed infection data, such as the number of infected persons in each room and their distributions. The information collected also includes the building information, the opening of doors and windows, and the mechanical ventilation conditions.
Experiments were carried out according to whether doors or windows were open and ventilation equipment was on during the epidemic. The ventilation rate was measured by CO2 tracer-concentration decay method. More than two concentration detectors and temperature recorders were arranged in each room. After releasing a certain concentration of CO2, the change in indoor CO2 concentration was continuously recorded for 2 hours with a sampling interval of 1 minute. A total of 54,848 experimental data points were obtained, including indoor CO2 concentration, outdoor CO2 concentration, indoor and outdoor temperature, etc.
For the dormitory building in Shandong Province, the main ventilation mode was mechanical ventilation. When the wind pressure and the window opening were both small, the difference in ventilation rate between winter and summer was not obvious. For the building in Hubei Province, there was no mechanical ventilation and it was located in the city center, densely surrounded by buildings; therefore, the wind ventilation was ignored and only buoyancy ventilation was considered. The natural ventilation rate was calculated by the following formula (6):
$$ \mathrm{Q}=\frac{1}{3}{\mathrm{C}}_{\mathrm{D}}\mathrm{A}\sqrt{\mathrm{g}\mathrm{H}\frac{{\mathrm{T}}_{\mathrm{i}}-{\mathrm{T}}_{0}}{{\mathrm{T}}_{\mathrm{i}}}} $$ $$ Let \; \rm{k}=\frac{1}{3}{\mathrm{C}}_{\mathrm{D}}\mathrm{A}\sqrt{\mathrm{g}\mathrm{H}} $$ $$ \mathrm{Q}=\mathrm{k}\sqrt{\frac{{\mathrm{T}}_{\mathrm{i}}-{\mathrm{T}}_{0}}{{\mathrm{T}}_{\mathrm{i}}}} $$ where Q is the natural ventilation rate (m3/h);
$ {\mathrm{C}}_{\mathrm{D}} $ is the flow coefficient; A is the window opening area (m2); g is the gravitational acceleration; H is the height of the window (m);$ {\mathrm{T}}_{\mathrm{i}} $ is the indoor temperature (K); and$ {\mathrm{T}}_{0} $ is the outdoor temperature (K).Through this field experiment, the room ventilation rate and the difference between indoor and outdoor temperature were measured, and the k value of each room was calculated. Outdoor temperatures during the disease outbreak period were obtained through a meteorological website and the average outdoor nighttime temperature was used for calculations.
According to our investigation, the transmission period for the Shandong Province was mainly from January 21 to February 12, 2020, and the infected people were concentrated in the north dormitory building.
The first case of infection was a dormitory supervisor who had been infected before January 21, due to contact with an asymptomatic infected person. There were 30 dormitory rooms in the building with an average number of 9 residents in each room. During the epidemic, internal personnel did not wear masks and they were in frequent contact. In this case, the infection rate in 30 rooms was between 29%–100%, of which 7 rooms had a 100% rate of infection. During the outbreak, the interior doors of the building were open, and the exterior windows were closed. The ventilation of rooms mainly depended on negative pressure generated by the four exhaust fans in the bathroom that were always on.
This case also occurred in Hubei Province due to infections of dormitory staff. The epidemic spread mainly from January 21 to February 11. There were 90 rooms in the building, and the average number of residents in each room was 21. Internal personnel used hand-stitched coarse cloth masks throughout the day. There was no mandatory mask wearing requirement at night; however, they were required to sleep on time. According to interviews conducted, a centralized area consisting of ten rooms (recorded as area M) had residents who were older and weak. During winter, they kept doors and windows closed all day to prevent catching a cold. Members in this area had a high awareness of self-protection and wore masks all day. Most of the residents in other areas (recorded as zone N) were young and middle-aged. They did not have a habit of wearing masks at night, and they opened windows or doors all day to enhance ventilation. The overall rate of infection was between 0% and 56%, of which 14 rooms had a 0% rate of infection.
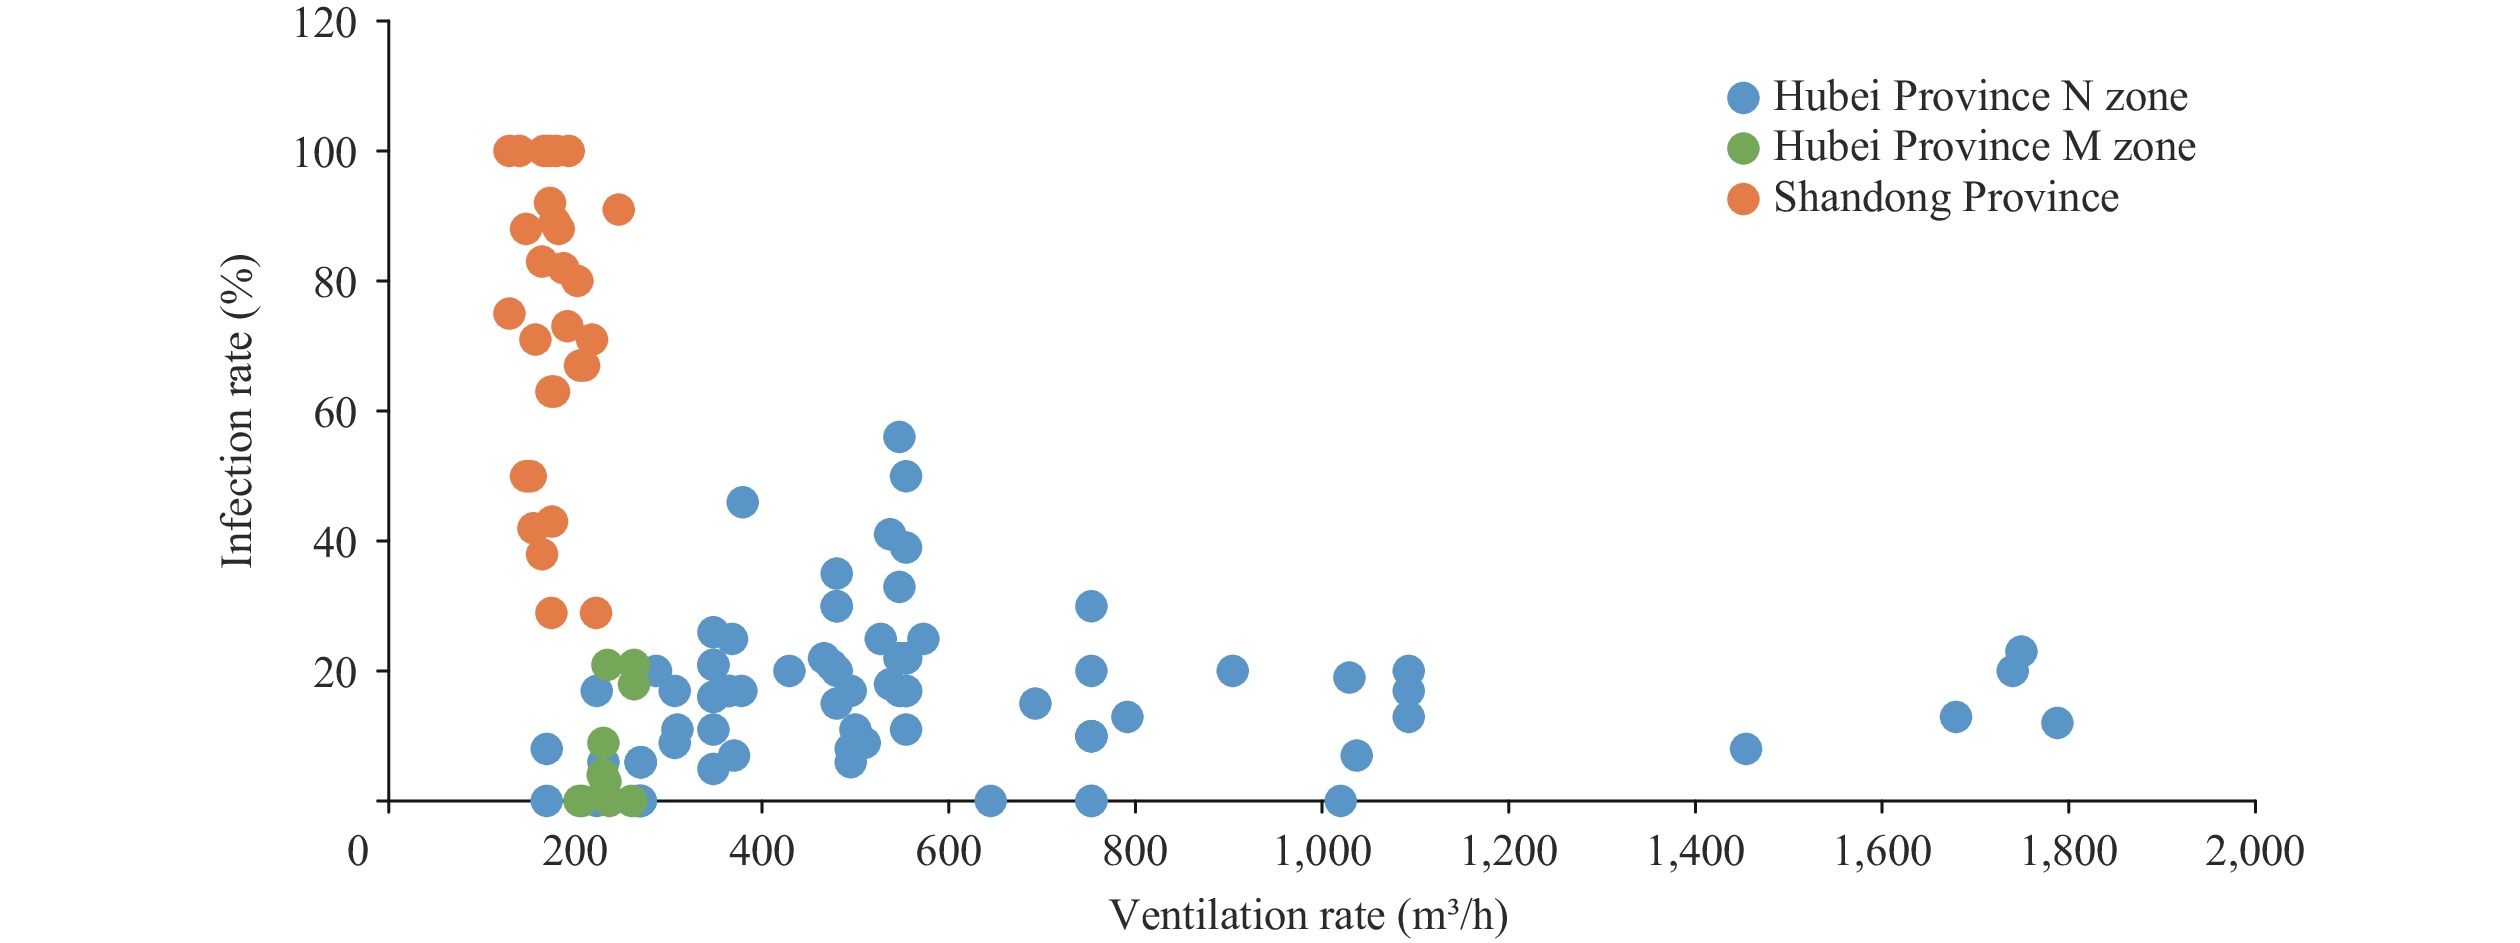
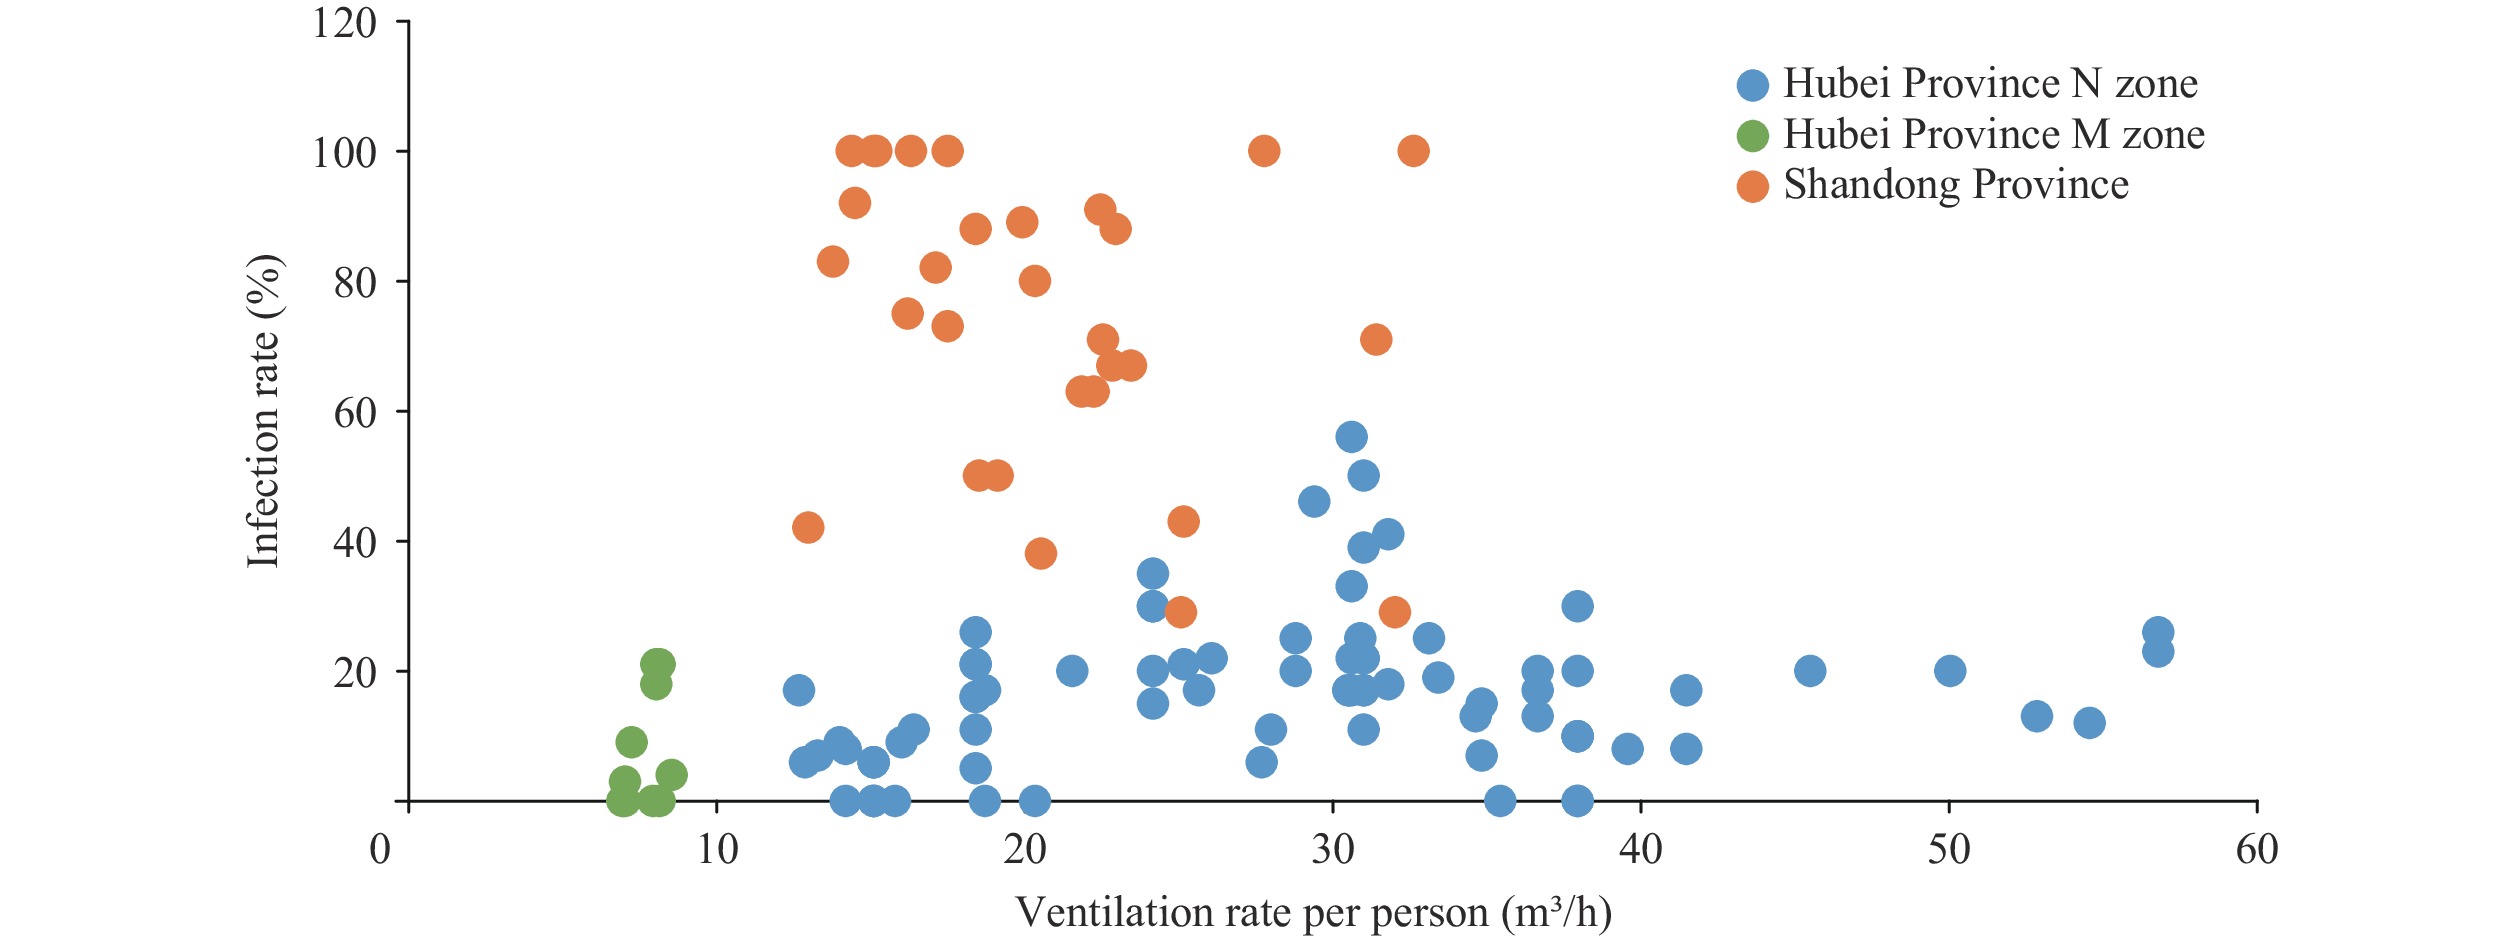
According to the simulation results, the ventilation rate of each room in Shandong Province was 129−246 m3/h. The range of ventilation rate per person was 12.9−32.4 m3/h. The ventilation rate of each room in Hubei Province was between 169 and 1,790 m3/h (Supplementary Table S1). The ventilation rate per person was between 6.9 and 56.4 m3/h (Figure 1).
 Figure 1.
Relationship between room infection rate and room ventilation rate in two dormitory buildings in Hubei and Shandong Province.
Note: Each point in the figure represents a room, the abscissa axis represents the ventilation rate (m³/h), and the ordinate axis represents the infection rate (%). Figure 2.
Relationship between room infection rate and room ventilation rate per person in two dormitory buildings in Hubei and Shandong Province.
Note: Each point in the figure represents a room, the abscissa axis represents the ventilation rate per person (m³/h), and the ordinate axis represents the infection rate (%).The average room ventilation in Hubei M Zone was 236 m3/h and the average ventilation rate per person was 7.7 m3/h. The average room ventilation in Hubei N Zone was 601 m3/h and the average ventilation rate per person was 28 m3/h. The room ventilation and ventilation rate per person in Zone M were significantly lower than those in Zone N. However, the average infection rate was 8% in Zone M and 16% in Zone N. Zone M achieved a lower infection rate with worse ventilation levels, reflecting how mask wearing habits reduce infection rates.
In comparing the Shandong case with zone N of the Hubei case, their ventilation rates were both between 12.9 and 32.4 m3/h per person (Figure 2); however, the average infection rate for Zone N was 18% and 74% for the Shandong case. The difference in the likelihood of infection between the two regions also reflected the significant effect of mask wearing habits.
The data from the Zone N in Hubei case showed that there was an obvious threshold of ventilation rate (Figures 1 and 2). When the room ventilation rate was higher than 800 m3/h or 40 m3/h per person, the rate of infection was less than 25%. Therefore, it was concluded that the contribution of aerosol transmission was very low. When the room ventilation rate was lower than 800 m3/h or 40 m3/h per person, the highest infection rate reached 56%, indicating a high risk of aerosol transmission.
-
Previous studies have shown that SARS-CoV-2 can survive 3 hours in aerosols (7), and a number of cases have proven the possibility of aerosol transmission of COVID-19, especially in poorly ventilated and crowded spaces. Li Yuguo et al. discussed the possibility of aerosol transmission due to the poor ventilation below 3.2 L/s (11.5 m³/h) per person through the analysis of the actual case. However, they did not determine the minimum ventilation requirement for mitigating airborne transmission of COVID-19 (8-9). By analyzing the ventilation rate and infection rate of the dormitories in Hubei and Shandong Province, the change of infection rate was obtained within a larger range of ventilation rates. Our results showed that if the ventilation rate per person was higher than 40 m³/h, the risk of aerosol transmission could be greatly reduced.
Through analyzing the actual data of two dormitory buildings with different mask wearing habits, it was found that even wearing hand-stitched coarse cloth masks can significantly reduce the risk of infection.
This study has some limitations. When analyzing the relationship between infection rate and ventilation rate, the statistics and comparison were carried out in the unit of room, and the difference of dormitory members in different bed positions were not discussed. Also, the indoor personnel’s behavior could only rely on recollections from memory.
These results help guide COVID-19 prevention and control in dormitory spaces, suggesting that people should wear masks when entering or staying in a confined space and a sufficient ventilation rate above 40 m³/h per person should be maintained.
-
No conflicts of interest.
HTML
| Citation: |


 Download:


