

 Download:


-
Air pollution is a major environmental risk factor affecting health worldwide. According to the World Health Organization, more than 4 million people die prematurely every year due to outdoor air pollution(1). The relationship between fine particulate matter (PM2.5) and mortality has been evaluated worldwide, in China, and in multiple-city studies (2-4). Evidence is accumulating showing regional differences in health response to air pollution. For example, the impact of PM2.5 on mortality varies greatly by country, region, and climate characteristics. Hebei Province’s capital, Shijiazhuang, is situated in the heart of the North China Plain and the Beijing-Tianjin-Hebei regional city cluster, and is one of the most polluted cities in China (5). We analyzed the most recent and longest time series data available, spanning the years 2015 to 2020, to explore the relation between PM2.5 and cause-specific mortality and to identify PM2.5-related sensitive illnesses and vulnerable populations. We determined the shapes of PM2.5 exposure-response curves and explore how PM2.5 and its health risks have changed in recent years in Shijiazhuang through environmental pollution control measures such as the “Blue Sky Protection Campaign,” improvements in energy, heating, transportation and land use, and improvements in polluting small enterprises.
-
The study obtained daily mortality data from January 1, 2015, to December 31, 2020 from Shijiazhuang CDC’s Cause of Death Reporting System. Causes of death were classified according to the International Classification of Diseases, 10th revision (ICD-10) (6), including total non-accidental causes (“ALL”, codes A00-R99), cardiovascular disease (“CVD”, codes I00-I99), and respiratory diseases (“RESP”, codes J00-J99). We categorized non-accidental deaths into strata by sex, age group (5–64 years and 65 years or older), and education level (low: less than or equal to 9 years of education; high: more than 9 years of education). Deaths of children five years and under were too few to analyze and were excluded. Meteorological factors (daily average temperature and relative humidity) and air pollution data [daily 24-hour average concentration of PM2.5, particulate matter with particle size below 10 microns (PM10), SO2, and NO2, and maximum eight-hour mean concentration of O3] were obtained from Shijiazhuang Meteorological Bureau and Shijiazhuang Ecology and Environment Bureau, respectively.
We examined associations between PM2.5 and cause-specific mortality using generalized additive models (GAM) (7) with a quasi-Poisson link function to account for over-dispersion of daily cause-specific deaths. We controlled for seasonal patterns, long-term trends, temperature, and relative humidity using natural cubic regression smoothing. Our analyses allowed 7 degrees of freedom (df ) per year for time long-term trends, 6 df for daily mean temperature, and 3 df for daily mean relative humidity, to minimize the Akaike’s Information Criterion (AIC) value of GAM. We stratified analyses by year (2015–2017 and 2018–2020).
The description of the model, methods and results for analyses of different periods (2015–2017 and 2018–2020) as shown in Supplementary Table S1, Spearman’s correlation coefficients as shown in Supplementary Table S2, sensitivity analyses as shown in Supplementary Table S3, two-pollutant models as shown in Supplementary Table S4, and stratification analyses were presented in the Supplementary materials. Analyses were conducted using the packages “mgcv” in R statistical software (version 3.5.1; The R Foundation for Statistical Computing, Vienna, Austria). We used two-tailed tests; P values less than 0.05 were considered statistically significant.
-
Table 1 showed mortality, PM2.5, and meteorological data and daily average counts of non-accidental (ALL), cardiovascular (CVD), and respiratory (RESP) deaths. During the study period, there were averages of 35 ALL, 19 CVD, and 5 RESP deaths per day. Among the 76,859 ALL deaths, there were 41,473 (54.0%) CVD deaths and 9,955 (13.0%) RESP deaths. Daily concentration of PM2.5 ranged from 6.3 μg/m3 to 625.3 μg/m3, and the annual-mean concentration was 77.6 μg/m3. There were 767 days (35% of the study period days) in which PM2.5 concentration was over 75 μg/m3, the national second ambient air quality standard in China. As shown in Supplementary Table S1, PM2.5 pollution was lower during 2018 to 2020 compared with 2015 to 2017, as the PM2.5 average concentration decreased from 91.1 μg/m3 to 64.1 μg/m3, while the maximum concentration decreased from 625.3 μg/m3 to 355.0 μg/m3 and the number of days exceeding the national standard decreased from 480 to 287 days.
Variable Mean (SD) Min P25 P50 P75 Max Daily mortality ALL 35 (10) 12 28 34 41 107 CVD 19 (7) 4 14 18 23 67 RESP 5 (3) 0 3 4 6 31 Air pollutant (μg/m3) PM2.5 77.6 (67.9) 6.3 35.0 56.0 94.5 625.3 Weather conditions Average temperature (℃) 14.8 (10.8) −10.2 4.6 16.0 24.6 33.7 Relative humidity (%) 55.5 (20.3) 7 39 55 72 100 Abbreviations: ALL=total non-accidental mortality from all causes; CVD=cardiovascular disease; RESP=respiratory disease; PM2.5=particulate matter with an aerodynamic diameter less than or equal to 2.5 μm; SD=standard deviation; Min=Minimum; P25=the 25th percentile; P50=the median; P75=the 75th percentile; Max=Maximum. Table 1. Daily mortality, PM2.5, and meteorological data in Shijiazhuang, 2015–2020.
As shown in Figure 1, the delayed effects of PM2.5 on ALL mortality were statistically significant for lag1, lag2, lag01, lag02, lag03, and lag04; the largest delayed effects estimates were for lag01, in which a 10 μg/m3 increase in PM2.5 was associated with an increment in ALL deaths of 0.47% (95% CI: 0.24%, 0.70%). For CVD mortality, the delayed effects of PM2.5 were statistically significantly for lag1, lag2, lag01, lag02, lag03, lag04, and lag05; the largest delayed effects estimates were also for lag01, with a 10 μg/m3 increase in PM2.5 corresponding to a 0.49% (95% CI: 0.19%, 0.79%) increment in death. For RESP mortality, in single-day lag models, significant associations were limited to the first day after PM2.5 exposure, with a 10 μg/m3 increase in PM2.5 corresponding to a 0.78% (95% CI: 0.33%, 1.23%) increment in death. When PM2.5 exposures were lagged over multiple days, the associations were strongest for exposures during lag01 (Estimates: 0.72%, 95% CI: 0.22%, 1.23%).
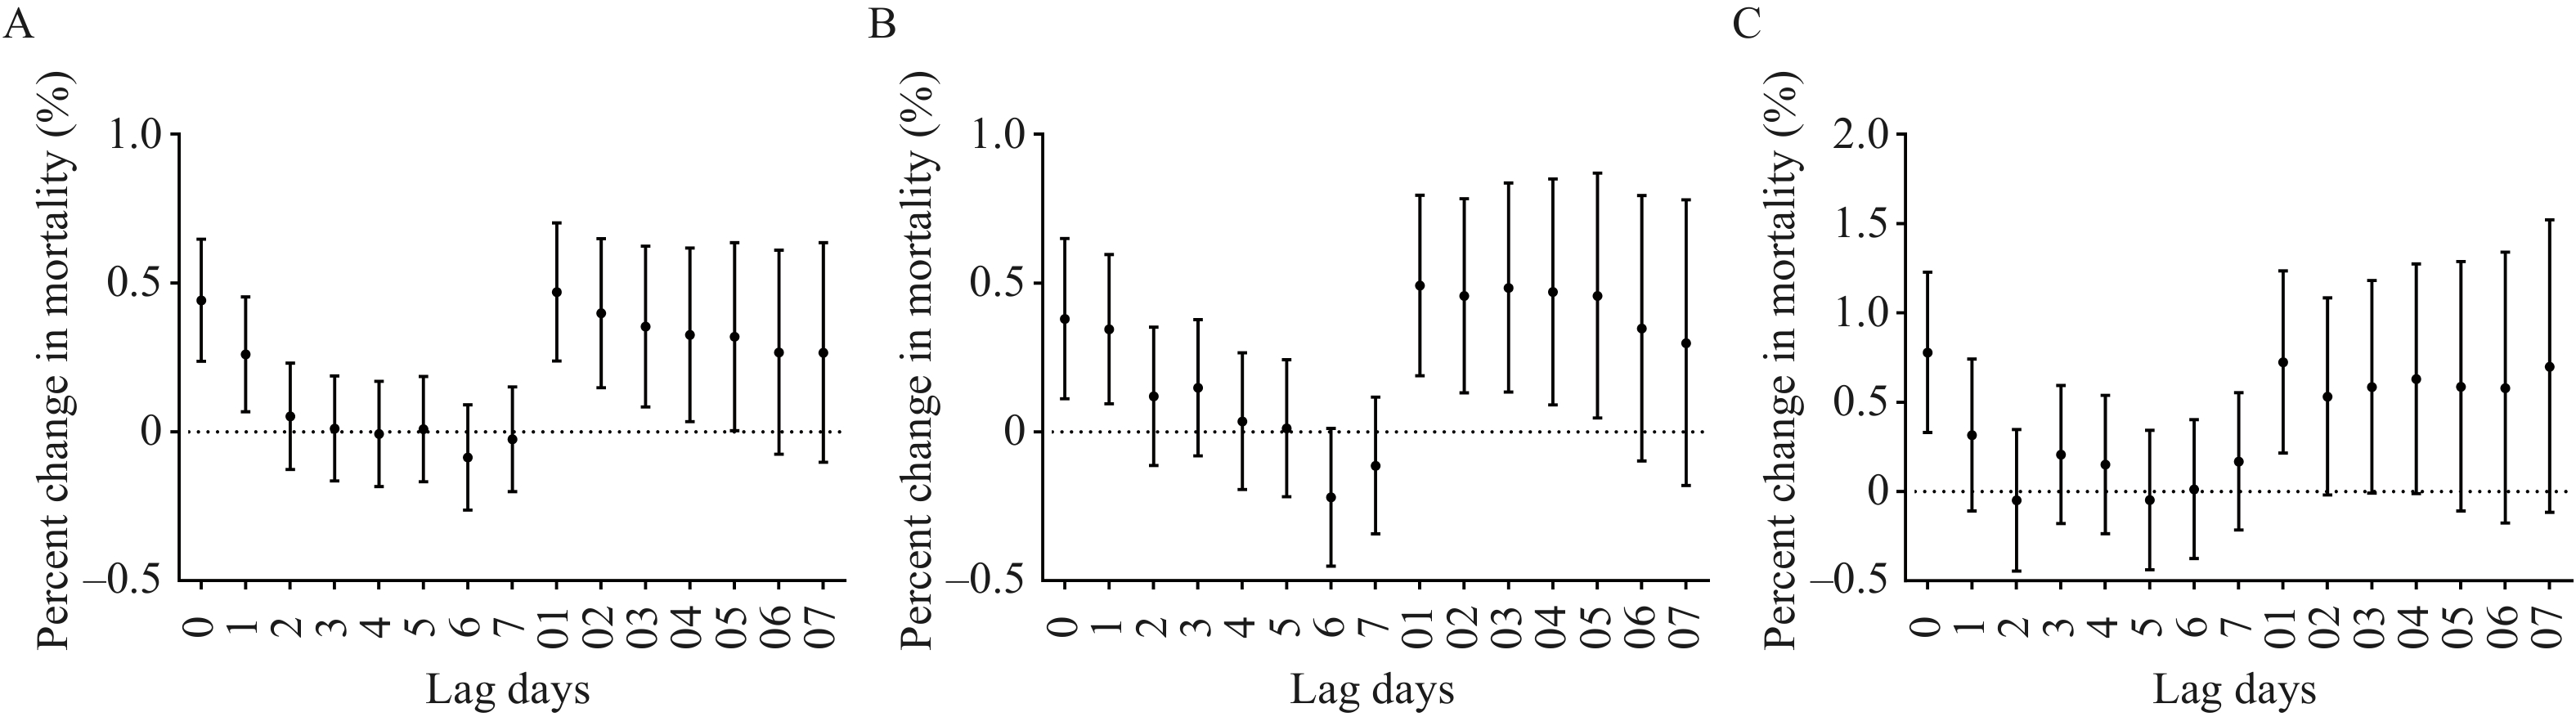 Figure 1.
Percent changes (95% CI) in daily cause-specific mortality per 10 μg/m3 increase in PM2.5 concentrations using different lag days; (A) ALL mortality, (B) CVD mortality, (C) RESP mortality.
Abbreviations: ALL=total non-accidental death; CVD=cardiovascular disease; RESP=respiratory disease; PM2.5=particulate matter with an aerodynamic diameter less than or equal to 2.5 μm.For Figure 2A and 2B, the exposure-response curves for ALL and CVD showed increasing trends. When PM2.5 concentrations were lower than 120 μg/m3 or higher than 300 μg/m3, slopes of curves showed marked increases. When PM2.5 concentrations were between 120 μg/m3 and 300 μg/m3, slope was flat. In Figure 2C, the exposure-response curve for respiratory mortality was nearly linear and positive. When PM2.5 concentration was over 300 μg/m3, confidence intervals were wider than when PM2.5 concentration was less than 300 μg/m3.
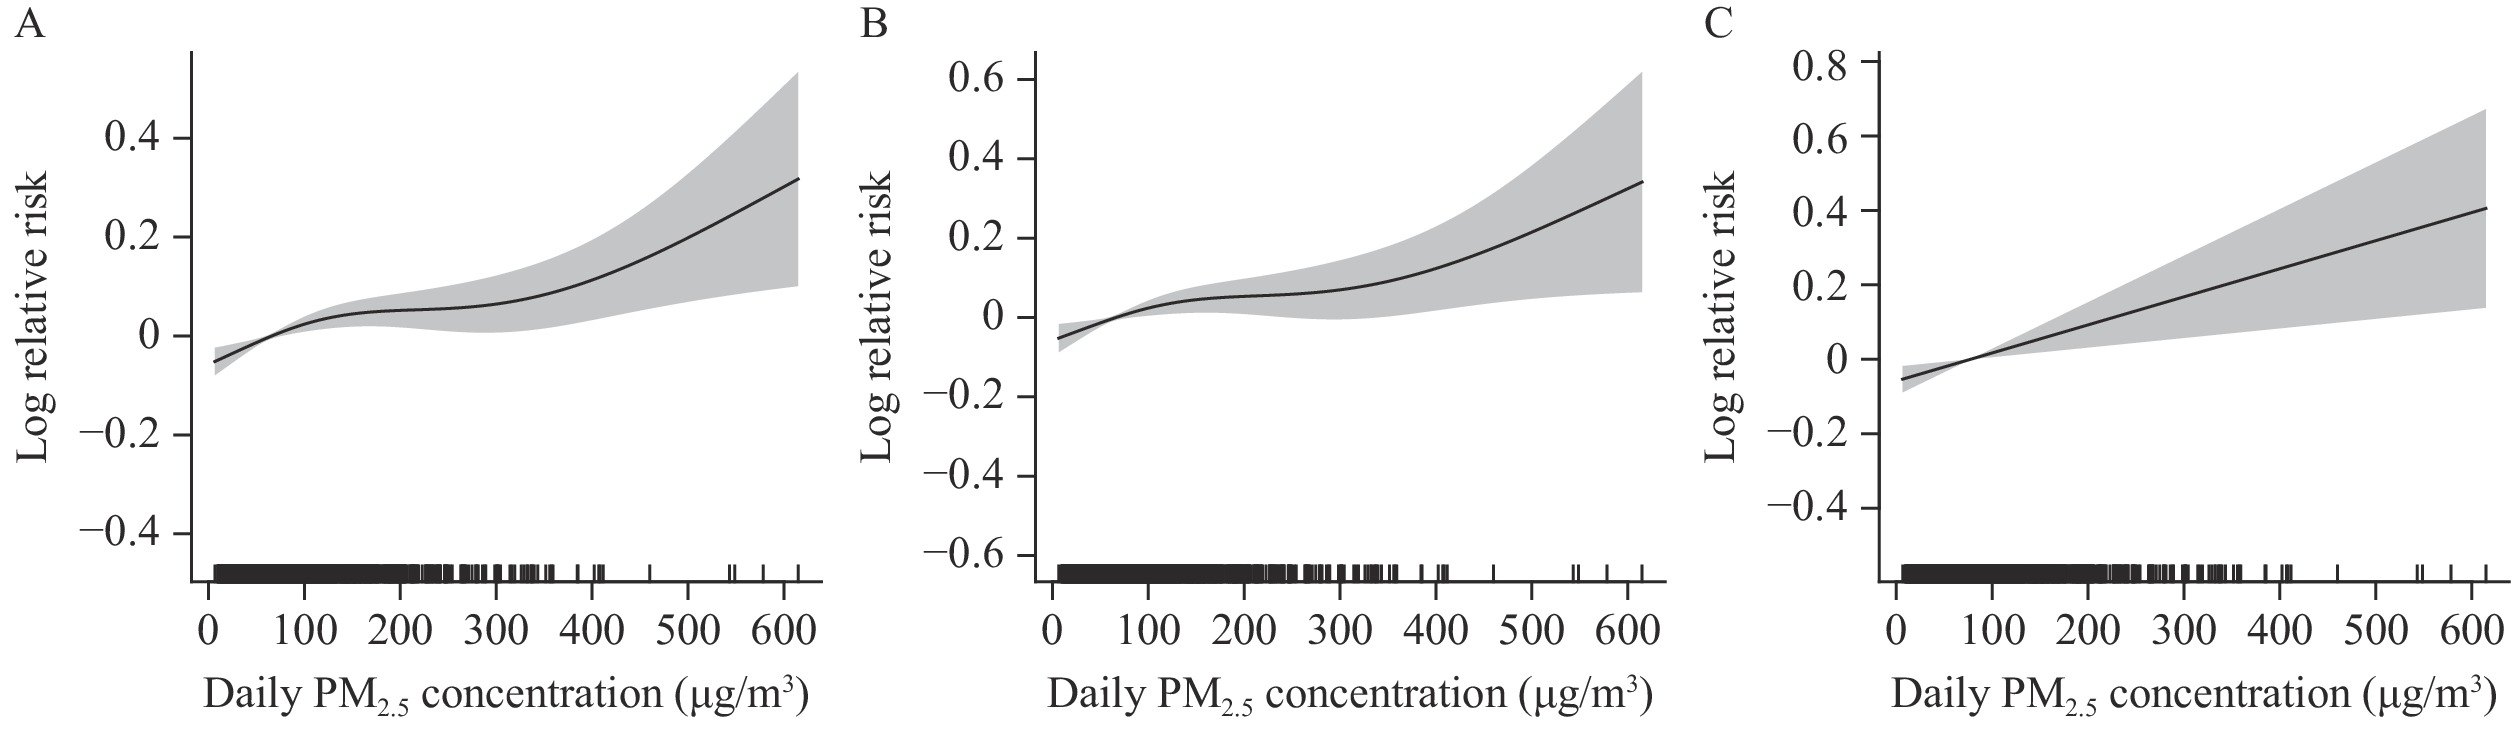 Figure 2.
Exposure-response curves for associations of daily PM2.5 concentrations (lag 01) with (A) ALL mortality, (B) CVD mortality, and (C) RESP mortality.
Notes: The y-axis can be interpreted as the relative change from the mean effect of PM2.5 on mortality. The solid lines represent mean estimates, and the shaded areas represent 95% confidence intervals. Abbreviations: ALL=total non-accidental death; CVD=cardiovascular disease; RESP=respiratory disease; PM2.5=particulate matter with an aerodynamic diameter less than or equal to 2.5 μm.As shown in Table 2, compared with 2015–2017, during 2018–2020, the effect of PM2.5 on ALL mortality was larger, and the estimated effect value changed from 0.50% to 0.63%, but the difference was not statistically significant. The effect on CVD mortality was slightly less and not statistically significantly different. The effect of PM2.5 on RESP mortality was significantly less and was statistically significantly different. The association between PM2.5 and total mortality varied by demographic characteristics. Throughout the 2015–2020 study period, an increase in PM2.5 of 10 μg/m3 corresponded to a 0.53% increment in deaths of males and a 0.39% increment in deaths of females. The 5–64-year-old group and ≥65-year-old-group had similar mortality associations. The association between PM2.5 and total mortality was a 0.51% increment for people with lower educational achievement and a 0.37% increment for those with higher educational achievement. There were no statistically significant differences among sex, age, and education in stratified analyses.
Different groups 2015–2020 (Lag01) 2015–2017 (Lag01) 2018–2020 (Lag0) Cause-Specific mortality ALL 0.47 (0.24, 0.70) 0.50 (0.23, 0.78) 0.63 (0.26, 1.01) CVD 0.49 (0.19, 0.79) 0.65 (0.28, 1.01) 0.60 (0.12, 1.08) RESP 0.72 (0.22, 1.23) 0.94 (0.32, 1.56) −0.15 (−0.99, 0.70)* Sex Man 0.53 (0.25, 0.81) 0.58 (0.25, 0.91) 0.60 (0.12, 1.08) Woman 0.39 (0.07, 0.70) 0.39 (0.01, 0.78) 0.69 (0.18, 1.20) Age (years) 5–64 0.51 (0.09, 0.93) 0.63 (0.13, 1.14) 0.54 (−0.16, 1.25) ≥65 0.47 (0.22, 0.72) 0.47 (0.17, 0.78) 0.67 (0.27, 1.07) Education level Low 0.51 (0.25, 0.78) 0.57 (0.25, 0.89) 0.67 (0.23, 1.10) High 0.37 (0.02, 0.72) 0.37 (−0.07, 0.81) 0.56 (−0.01, 1.12) Notes: Educational level: low, ≤9 years of education; high, >9 years of education.
Abbreviations: ALL=total non-accidental mortality from all causes; CVD=cardiovascular disease; RESP=respiratory disease.
* P<0.05 vs. 2015–2017.Table 2. Percent change (95% CI) in daily cause-specific mortality and total non-accidental mortality stratified by sex, age, and educational level per 10 μg/m3 increase in concentration of PM2.5 in different time periods.
-
During the study period, PM2.5 pollution in Shijiazhuang improved compared with previous years (8), but pollution was still serious. Our general additive model results showed that ALL mortality, CVD mortality, and RESP mortality were related to PM2.5 concentration. Sensitivity analysis and 2 pollutant models indicated that PM2.5 had an independent health effect on ALL mortality, CVD mortality, and RESP mortality.
Whether improvement of PM2.5 can reduce mortality is still controversial. During the study periods of 2015–2017 and 2018–2020, after the concentration of PM2.5 was reduced, the most direct manifestation of the reduction was a significant decrease in RESP mortality. The respiratory system is a target organ of PM2.5 direct action, and PM2.5 concentration is directly related to the occurrence and development of respiratory diseases. With improvement of people’s health awareness, residents wear masks and use air purifiers on polluted days. No significant change was observed for ALL mortality and CVD mortality. Due to its small particle size, PM2.5 can enter the blood circulation through the gas-blood barrier, thus affecting the circulation system, in which the composition of PM2.5 plays a major role. PM2.5 components should be further analyzed in the future to find harmful components and take targeted control measures.
ALL mortality in our study consisted mainly of circulatory system diseases, tumors, respiratory system diseases, endocrine and metabolic diseases, and digestive system diseases. In addition to circulatory system diseases and respiratory system diseases, the connection between other system diseases and PM2.5 needs to be explored in future studies.
The effect values we observed differed slightly from those observed in previous studies. There is significant spatial heterogeneity between PM2.5 concentration and daily mortality in different countries and regions (2,9). Our study found that every 10 μg/m3 increase in PM2.5 concentration was associated with a 0.47% increase in ALL mortality — a value that was higher than results of a recent study of 272 cities in China (0.22%) (3). Many factors may be responsible for the difference, including different PM2.5 components, long-term air pollution levels, and population susceptibility. The larger effect estimates observed in our study may also be due to higher PM2.5 concentrations.
The shape of the exposure-response curves was linear without discernible thresholds, which was consistent with findings from previous studies (10). As shown in our study and a previous multisite study of 272 representative cities in China, there was a marked increase in E-R values at lower PM2.5 levels and a leveling off at relatively high concentrations (3). The stability observed at higher concentrations may be the result of a “harvesting effect,” since susceptible populations may die before air pollutant concentrations reach very high levels (11). When PM2.5 concentrations were above 300 μg/m3, slopes of the curves markedly increased. Therefore, reducing outdoor activity on heavily polluted days may reduce risk of death. Associations of PM2.5 on RESP mortality for PM2.5 concentrations over 300 μg/m3 were characterized by wider confidence intervals, implying that the mortality risk has greater uncertainty.
When stratified by sex, age, and educational attainment, we found higher association in males, 5–64-year-olds, and individuals with lower educational achievement, but differences between sex, age group, and education were not statistically significant in stratified analyses. These findings may be due to occupational factors, as young men with low education levels may engage in more outdoor work, resulting in exposure to higher concentrations of air pollution. Lin et al. (12) found that older people may be more susceptible to PM2.5 in 6 cities of the Pearl River Delta region. Lee et al. (13) found that the most vulnerable population in three southeastern states was people with low educational achievement. A study in Shenzhen showed a high effect of PM2.5 on males and the elderly (14), whereas an analysis from 160 communities of China showed females, older individuals, and widows appeared to be more vulnerable to PM2.5 (9). There were differences in lifestyle, physiological factors, immunity, housing, and medical conditions by sex, age, and education, all of which can lead to different research results. Identification of potentially susceptible populations is crucial to public health and to the development of targeted intervention strategies.
This study was subject to some limitations. First, we used pollutant concentration data from urban environmental monitoring stations instead of population exposure concentrations. People spend much of their time indoors, and there is a significant difference between indoor and outdoor pollution (15). Therefore, there will be differences between our results and the real effects of PM2.5. Second, the primary causes of death were categorized into circulatory and respiratory diseases. Categorization should be further refined to screen out sensitive diseases. Finally, our research only analyzed Shijiazhuang, which has relatively high pollution levels, thus, caution should be exercised when generalizing these findings to other locations.
Our findings showed an effect of air pollution on mortality in Shijiazhuang and emphasized the necessity of further controlling PM2.5 and continuing the significant achievements in PM2.5 control that have been made in Shijiazhuang. Futher studies on associations of components of PM2.5 with cause-specific mortality are still needed to guide environmental health policies to improve population health.
-
No conflicts of interest.
HTML
| Citation: |

|