

 Download:


-
Tuberculosis (TB) is a chronic infectious disease caused by Mycobacterium tuberculosis (Mtb) infection. The treatment cycle is long and has caused heavy burden to the state, society, and individuals (1). Traditional epidemiological indicators, such as incidence and mortality rate, are often used to evaluate the burden of TB in China (2). Disability-adjusted life year (DALY) is a representative indicator widely used in the study of disease burden, summing year of life lost (YLL) and year lived with disability (YLD) (DALY=YLL+YLD). It comprehensively measures the loss of health caused by disease onset, premature death, and disability.
In China, DALY is seldom used in the field of tuberculosis (2). The 2019 global disease burden study (GBD 2019) estimates the burden of TB in China using population registration, census data, China National Disease Surveillance Points (DSP), mortality registration and reporting system, China National Maternal and Child Health Surveillance System (MCHS), WHO Mortality Database, WHO’s Global TB Database, and other data sources (3-6). China has issued a number of national control plans since 1978 and carried out TB prevention and control according to those plans. Based on the GBD 2019, this study analyzed the trend of TB burden in China at different periods from 1990 to 2019.
This study obtained the DALY, YLS, and YLD caused by TB in China from 1990 to 2019, grouped by age and gender, using corresponding ratios and 95% uncertainty intervals (UIs) for data analysis. The 2010 national census was used as the standard population to calculate the age-standardized rate (ASR). And the estimated annual percentage change (EAPC) used to measure the trend of ASRs in a specific time interval. According to the national TB prevention and control plans published since 1990, 4 intervals (1990 to 2000, 2001 to 2010, 2011 to 2015, and 2016 to 2019) were used to reflect trends.
The time (year) was the independent variable x and the natural logarithm of the rate as the dependent variable for regression line fitting,
$ \mathrm{\gamma }=\mathrm{\alpha }+\mathrm{\beta }x+\mathrm{\epsilon } $ , where$ \mathrm{\gamma } $ =ln(ASR).$ \mathrm{\alpha } $ ,$ \mathrm{\beta } $ , and$ \mathrm{\epsilon } $ represented the intercept, slope, and residual of the line, respectively. EAPC [95% confidence interval (CI)] was calculated by substituting the formula$ 100\times (\mathrm{exp}\left(\mathrm{\beta }\right)-1) $ . If both EAPC and the upper limit of its 95% CI were greater than 0, it meant that ASRs were showing an upward trend; conversely, when both were less than 0, ASRs were showing a downward trend; other conditions indicate that ASRs showed a stable trend over time (5-6). The percentage change of the quantity was calculated by dividing the difference between the two time points by the value at the first point. Excel (version 2013, Microsoft, USA) and SAS (version 9.4, SAS Institute Inc., Cary, NC, USA) software were used for data analysis and graphing (P<0.05).According to Figure 1 and Table 1, YLLs, YLDs, and DALYs showed a significant downward trend from 1990 to 2019. The average annual ASRs decreased by 8.27%, 3.16%, and 7.39%, and the number of person-years decreased by 85.93%, 33.47%, and 91.59%, respectively. The decrease of YLDs was relatively small. In the ASR of DALYs, YLLs and YLDs accounted for 91.22% and 8.78% in 1990, and 69.07% and 30.93% in 2019.
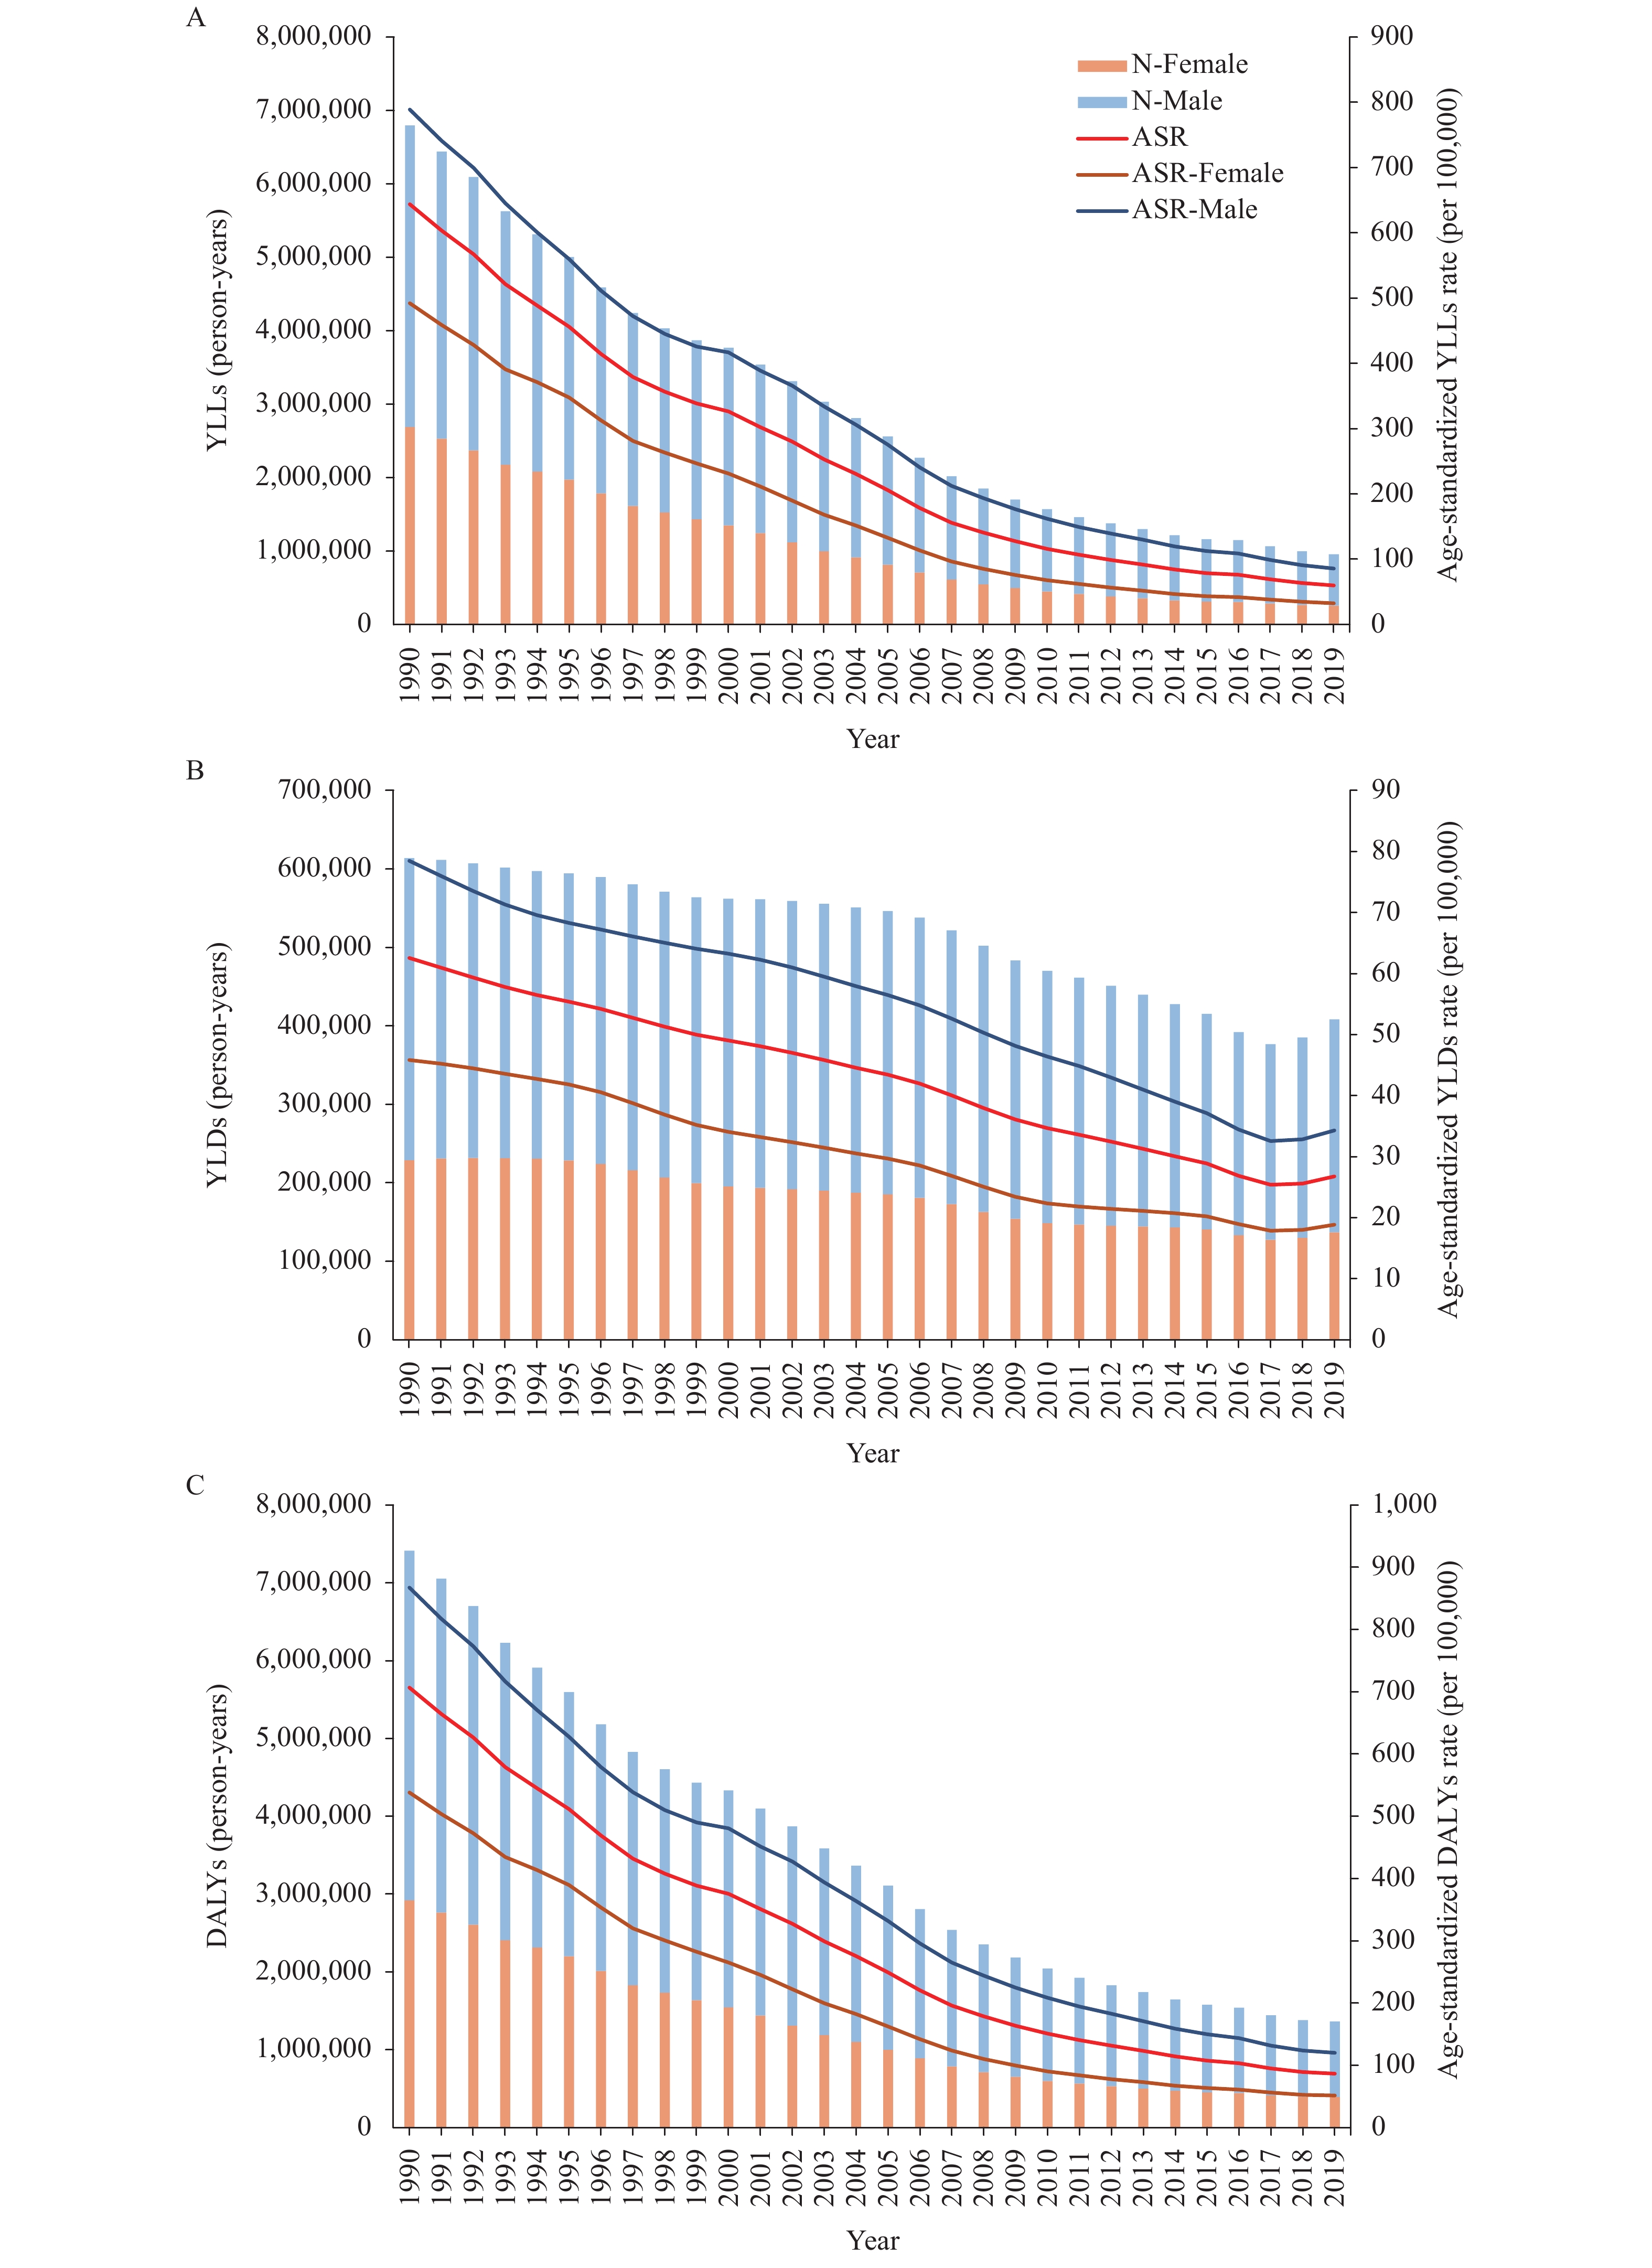 Figure 1.
The number and age-standardized rates of disease burden caused by TB in China, 1990–2019. (A) TB related YLLs; (B) TB related YLDs; (C) TB related DALYs.
Abbreviations: TB=Tuberculosis; YLLs=years of life lost; YLDs=years lived with disability; DALYs=disability-adjusted life years; N=number; ASR=age-standardized rate.Indictor/
Gender1990 2019 1990−2000 2001−2010 2011−2015 2016−2019 1990−2019 N
(95% UI)ASR
(1/100,000)N
(95% UI)ASR
(1/100,000)P′ EAPC
(95% CI)P′ EAPC
(95% CI)P′ EAPC
(95% CI)P′ EAPC
(95% CI)P′ EAPC
(95% CI)YLLs Male 411
(351, 465)788.76
(646.53, 935.15)70
(56, 86)85.66
(67.73, 106.14)−41.07 −6.63
(−7.09, −6.16)−51.12 −9.76
(−10.30, −9.21)−19.05 −6.92
(−7.37, −6.46)−16.49 −7.76
(−9.84, −5.62)−82.95 −7.65
(−7.88, −7.43)Female 269
(223, 309)492.27
(389.69, 594.52)26
(20, 34)32.51
(25.00, 43.85)−49.89 −7.47
(−7.80, −7.14)−63.86 −12.22
(−12.72, −11.72)−24.88 −8.7
(−9.40, −7.99)−17.36 −8.25
(−10.07, −6.39)−90.48 −9.57
(−9.88, −9.26)Both 680
(606, 752)644.06
(521.18, 768.90)96
(81, 113)59.72
(46.87, 75.74)−44.56 −6.93
(−7.30, −6.56)−55.6 −10.54
(−11.05, −10.02)−20.71 −7.41
(−7.89, −6.93)−16.72 −7.89
(−9.90, −5.84)−85.93 −8.27
(−8.51, −8.02)YLDs Male 39
(26, 52)78.47
(50.9, 111.63)27
(18, 37)34.28
(22.17, 48.96)−4.81 −2.08
(−2.35, −1.81)−12.53 −3.26
(−3.61, −2.92)−12.79 −4.64
(−4.90, −4.38)4.75 −0.06
(−6.72, 7.08)−29.5 −2.98
(−3.21, −2.75)Female 23
(15, 32)45.84
(29.22, 65.72)14
(9, 19)18.83
(12.32, 27.01)−14.53 −2.99
(−3.46, −2.51)−23.28 −4.39
(−5.06, −3.71)−4.11 −1.84
(−2.10, −1.58)2.86 −0.08
(−6.76, 7.09)−40.16 −3.5
(−3.65, −3.35)Both 61
(41, 83)62.54
(40.32, 89.22)41
(27, 55)26.74
(17.36, 38.25)−8.43 −2.4
(−2.47, −2.34)−16.24 −3.63
(−4.08, −3.18)−10.03 −3.73
(−3.94, −3.51)4.11 −0.07
(−6.73, 7.08)−33.47 −3.16
(−3.33, −2.99)DALYs Male 449
(388, 508)867.23
(720.89, 1016.53)97
(80, 117)119.95
(97.60, 145.83)−37.96 −6.14
(−6.57, −5.70)−45.78 −8.64
(−9.09, −8.19)−17.6 −6.38
(−6.75, −6.01)−11.47 −5.8
(−9.14, −2.34)−78.37 −6.88
(−7.07, −6.69)Female 292
(244, 332)538.1
(433.96, 641.67)39
(32, 48)51.34
(40.73, 65.02)−47.12 −7
(−7.31, −6.70)−58.39 −10.8
(−11.22, −10.38)−19.47 −6.77
(−7.28, −6.25)−11.29 −5.57
(−9.06, −1.95)−86.54 −8.43
(−8.70, −8.16)Both 741
(661, 815)706.6
(580.85, 833.58)136
(117, 161)86.46
(69.84, 106.39)−41.57 −6.45
(−6.78, −6.11)−50.21 −9.33
(−9.76, −8.90)−18.15 −6.49
(−6.84, −6.14)−11.42 −5.73
(−9.11, −2.23)−81.59 −7.39
(−7.59, −7.19)Note: N: Number of person−years×10,000. P′: Change in number (%). Indicators: ASR; YLLs; YLDs; DALYs.
Abbreviations: EAPC=estimated annual percentage change; UI=uncertainty interval; CI=confidence interval; ASR=age-standardized rate; TB=Tuberculosis; YLLs=years of life lost; YLDs=years lived with disability; DALYs=disability-adjusted life years.Table 1. DALYs, YLLs, and YLDs of TB and their piecewise trend — China, 1990–2019.
The segmented quantitative analysis showed that only the YLDs from 2016 to 2019 had a steady trend, while the others showed a downward trend. YLLs, YLDs, and DALYs all had the largest decline from 2001 to 2010. The ASRs decreased by 10.54%, 3.63%, and 9.33% annually, and the number of person-years decreased by 55.60%, 16.24%, and 50.21%, respectively. The decline was the smallest from 2016 to 2019. The number of YLLs and DALYs decreased by 16.72% and 11.42%, respectively, while the number of YLDs increased by 4.11%.
The burden of men is about twice that of women with ASRs always higher than that of women and both sexes combined. The decline of the three indicators in women was higher than that in men at different time intervals, except that the decline of YLDs in men was higher from 2011 to 2019. According to Figure 2, the rates of the three indicators decreased significantly in all age groups, especially YLLs. The group ≥70 years old had the heaviest burden, followed by the group of 50–69 years old, and the group under 15 years old had always been the lowest. The gap in YLLs rates of all age groups gradually shrank.
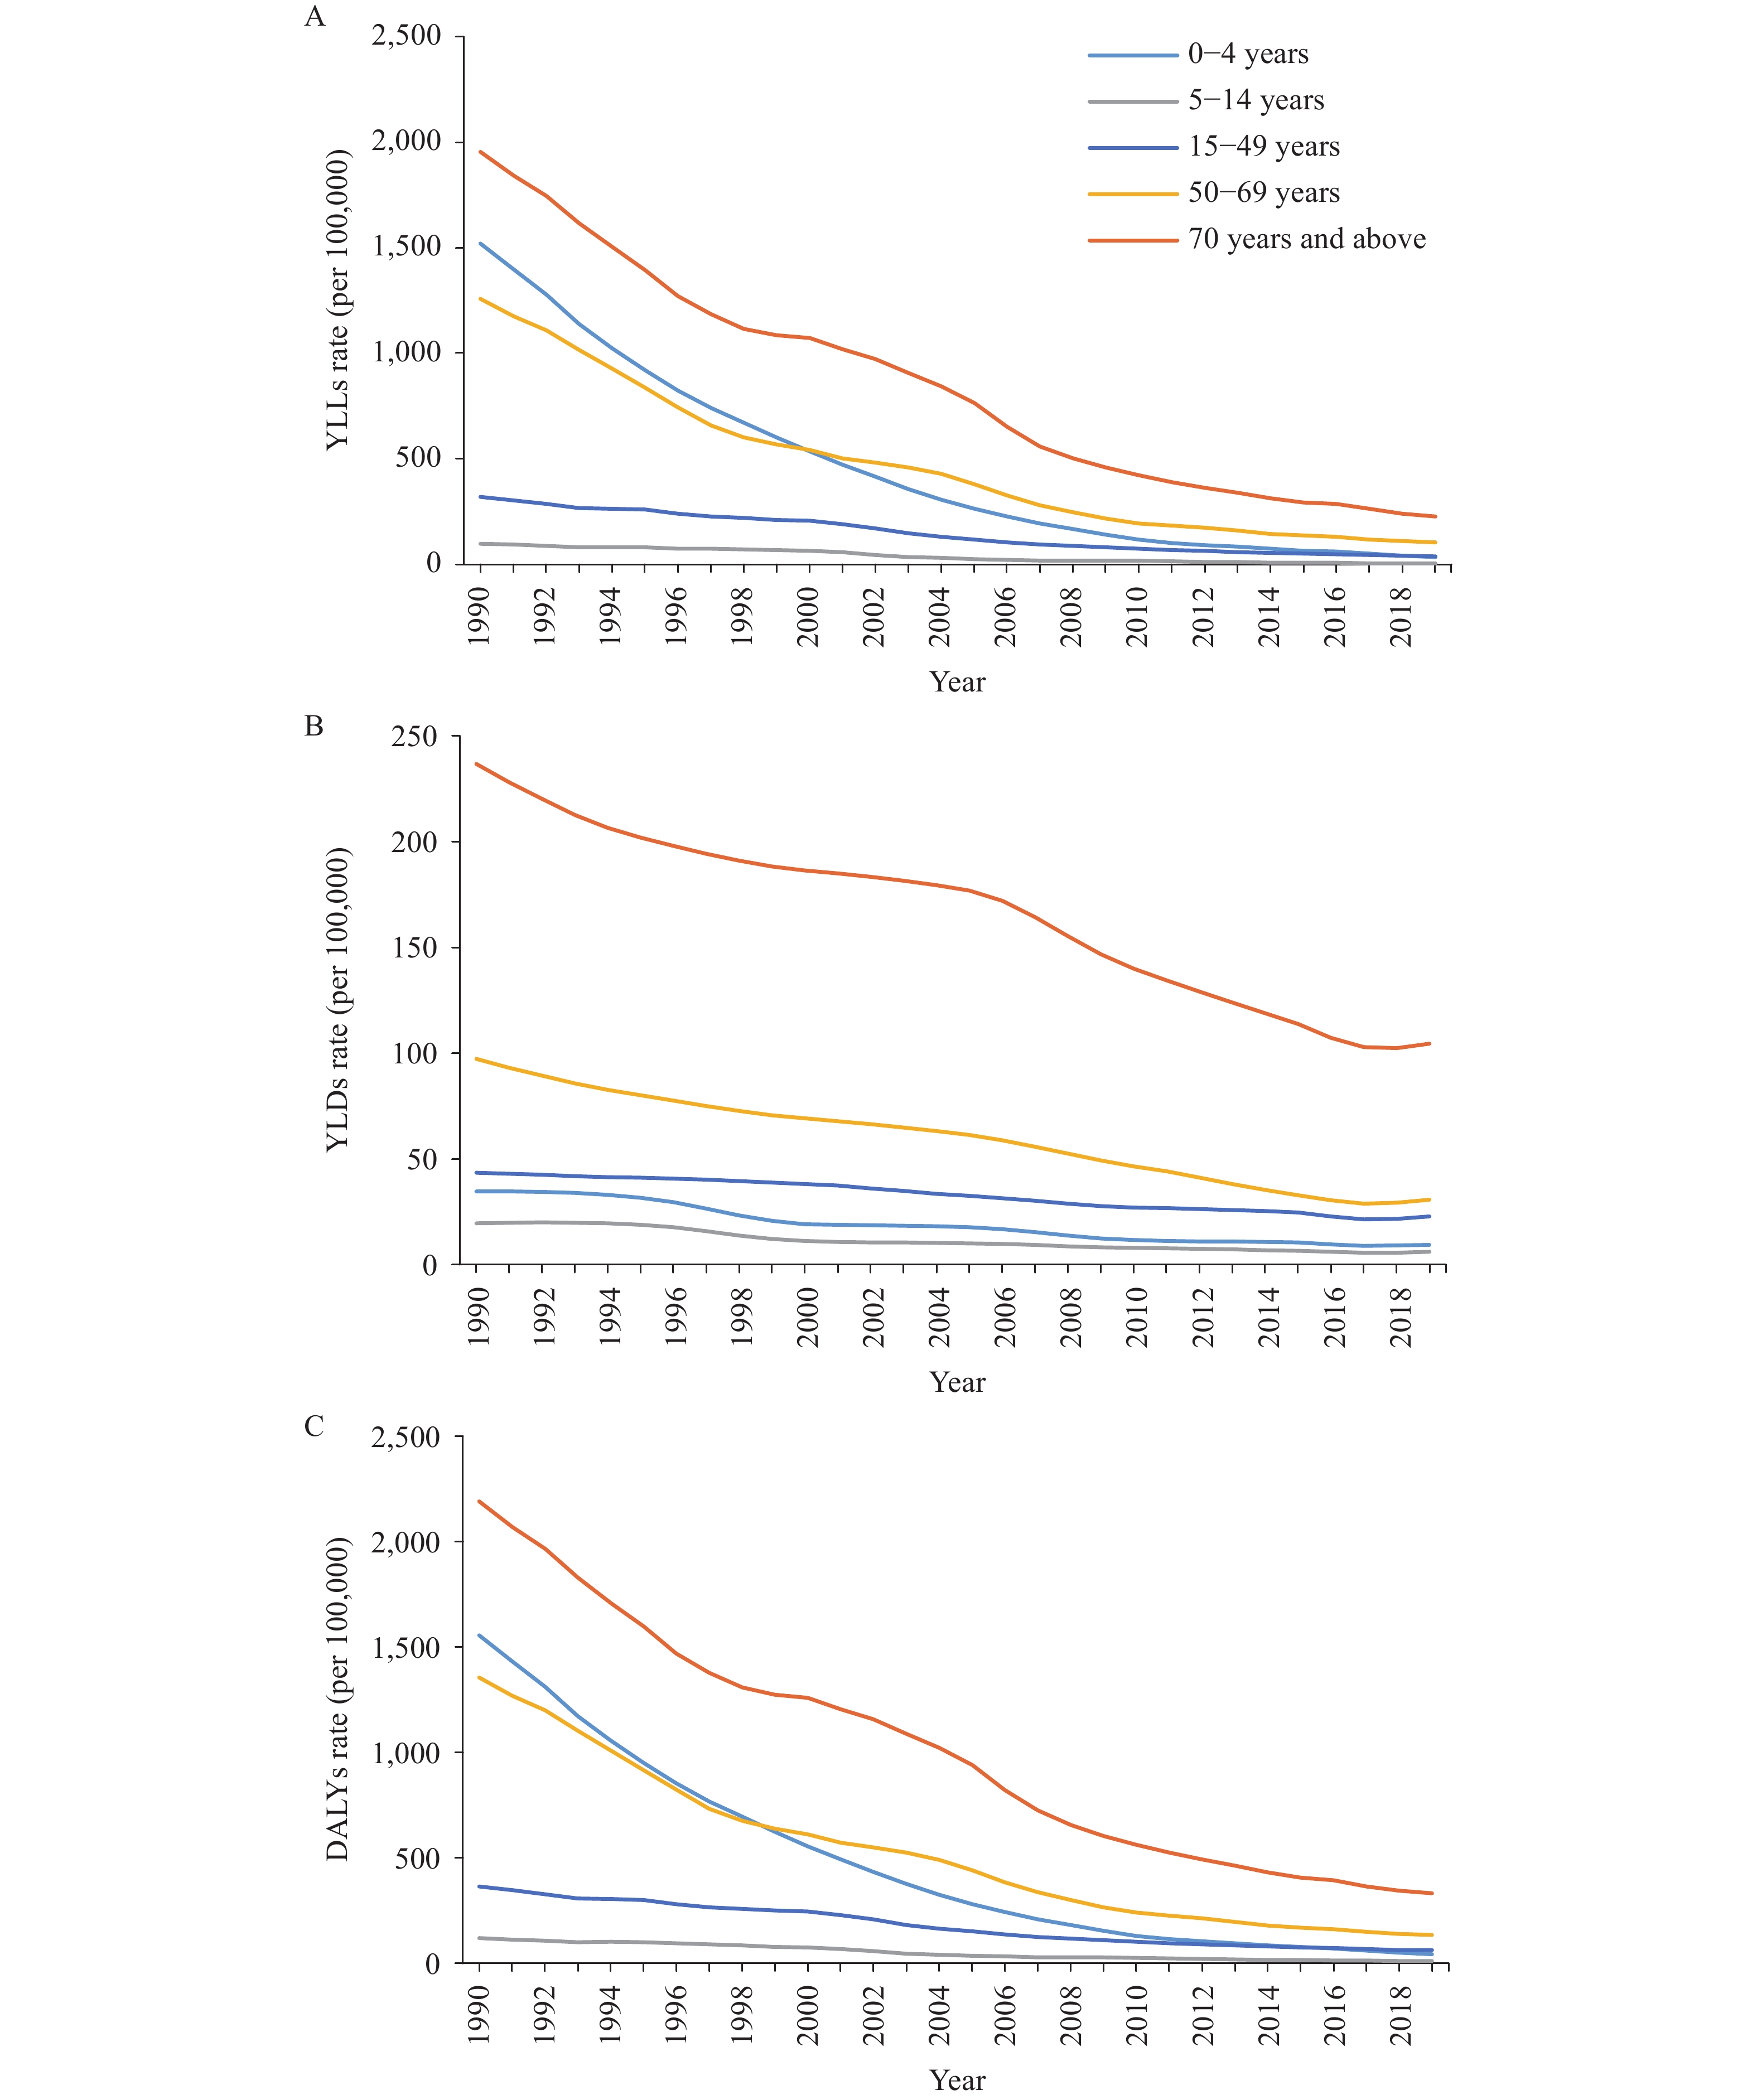 Figure 2.
The rate of disease burden caused by TB in China by age group from 1990 to 2019. (A) TB related YLLs; (B) TB related YLDs; (C) TB related DALYs.
Abbreviations: TB=Tuberculosis; YLLs=years of life lost; YLDs=years lived with disability; DALYs=disability-adjusted life years. -
In 2019, DALYs caused by TB in China were estimated at 1.36 million per year, and the ASR was 86.46 per 100,000 population. The disease burden for men was higher than that of women, and the downward trend for women was faster. The highest burden was in the elderly population. This was similar to the demographic characteristics of the prevalence and incidence of TB (2). In 1990–2019 years, the age standardized rate of DALYs decreased significantly (−7.39%). The national TB control plan implemented during the period effectively curbed the epidemic situation of tuberculosis and improved the equity and accessibility of prevention and treatment services (7).
DALYs decreased the most from 2001 to 2010 (ASR decreased by 9.33% and quantity decreased by 50.21%). The core of the two prevention and control plans implemented from 1991 to 2010 was to gradually implement the directly observed treatment of short course strategy (DOTS) and complete the coverage nationwide in 2005. The subsequent maximum decline reflects the effectiveness of DOTS in TB control. Effective control was also achieved from 2011 to 2015. The establishment of a service system with clear divisions of labor, coordination, and cooperation among disease control, medical and grass-roots medical and health institutions played vital roles. The number of DALYs dropped only 11.42% between 2016 and 2019, while the magnitude of change in ASR was similar (−5.73 vs. −6.45 vs. −6.49). This indicated a substantial reduction in the number of patients, but the rebound in YLDs necessitates attention.
The magnitude of the decline was larger than that of the United States, India, Japan, and the global level, but the burden was still higher than that of the United States and Japan (8). The composition of DALYs and YLLs were much higher than YLDs. In particular, there was a ten-fold drop in 1990 while the difference in 2019 was two-fold. This shows that the burden of TB in China was mainly caused by premature death, which is consistent with the situation in other parts of the world (8). However, the proportion of premature deaths decreased significantly, reflecting the therapeutic effectiveness of anti-TB drugs. The decline of YLDs is relatively small, indicating that the disability burden caused by TB needs targeted control measures. This is related to the characteristics of TB, such as the long treatment cycle.
This study was subject to some limitations. First, the GBD study used Japanese life expectancy as estimated value, which partly exaggerated the YLL caused by TB in China. Second, it cannot reflect the specific situation of pulmonary TB or the situation in other regions.
In summary, over the past few decades, the disease burden of TB has been decreasing, but remains high. Administrative regions at all levels must enhance government commitment, especially in high-risk areas (1,7,9). TB prevention and treatment institutions should strengthen research and apply DALYs to comprehensively evaluate the health damage caused by TB.
HTML


| Citation: |

|