

 Download:


-
Acrylamide (AA) is widely used in dam and tunnel construction, paper manufacturing, the oil industry, cosmetics, and pharmaceuticals. It has been reported to be a rodent carcinogen (Group 2A) and a probable carcinogen to humans, possibly having toxic effects on the nervous system along with adverse reproductive and developmental effects. Although there is no limit standard for AA in food, relevant control measures have been implemented by several countries. In 2012, the China National Center for Food Safety Risk Assessment released the “Risk Assessment Report of Acrylamide in Food,” which evaluated its toxicity, formation, and possible human exposure, and proposed suggestions for its control and prevention (1).
Figure 1 showed the contributions of 12 food categories to the overall dietary exposure as analyzed in the Sixth Total Diet Study (TDS), the methodology of which was presented in the Foreword of this issue (2). Vegetables (59.0%) and cereals (18.9%) were the predominant contributors of AA intake, accounting for approximately 80% of the overall estimated dietary intake (EDI). In addition, potatoes were also an important source of AA exposure (10.1%).
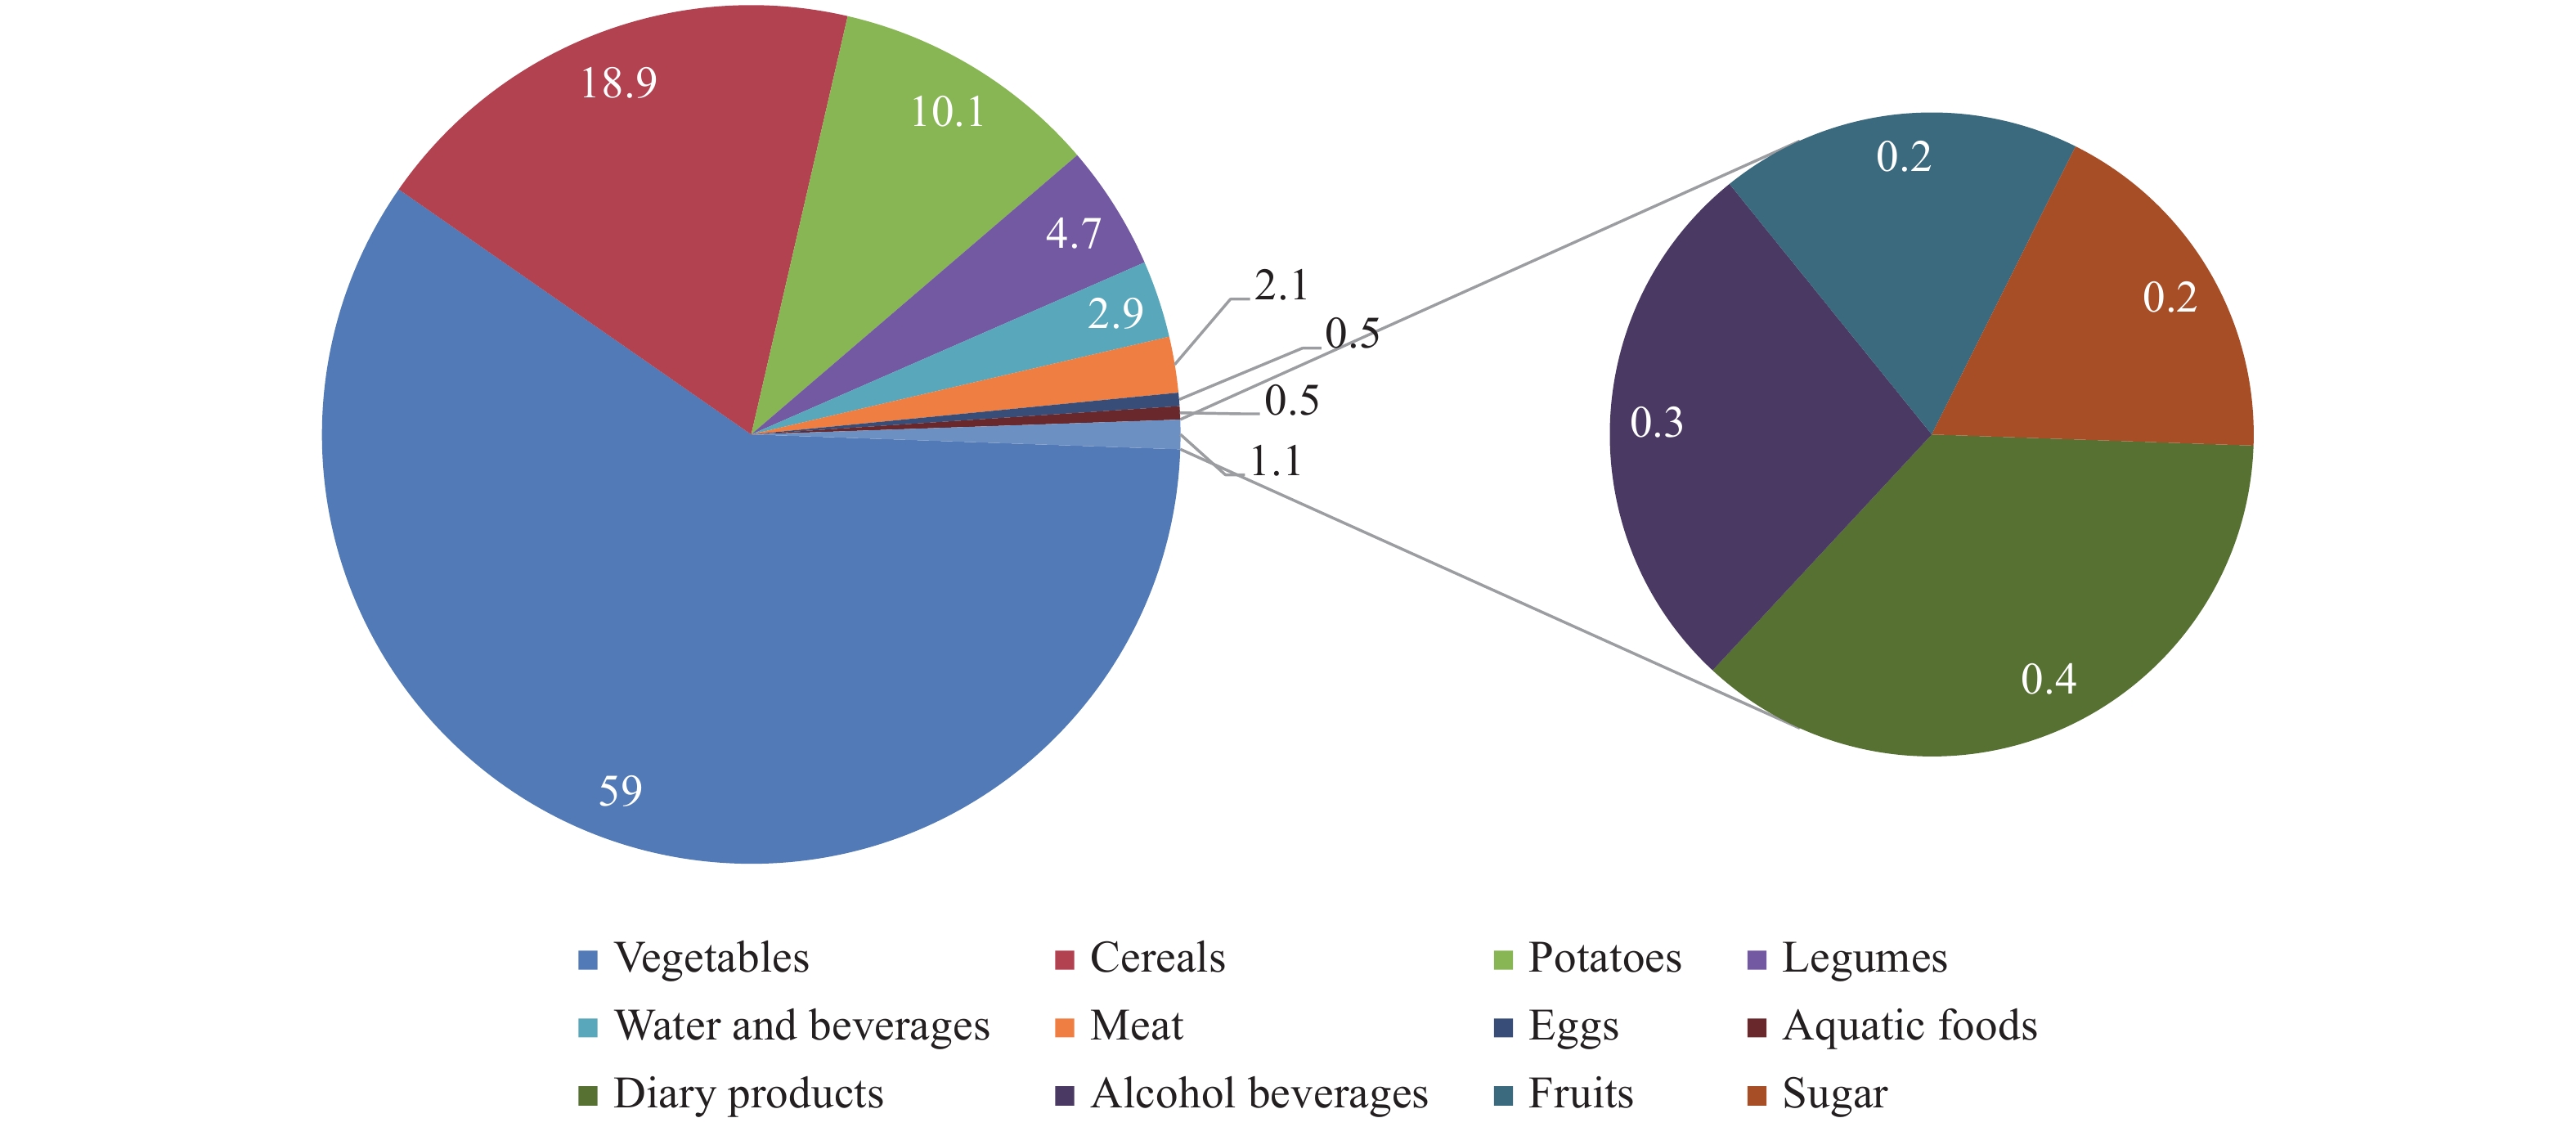 Figure 1.
Daily intake of the different food groups to dietary acrylamide intakes for Chinese general population (%).
Using mean EDI value (0.175 µg/kg body weight per day) with the no observed adverse effect level (NOAEL) value (0.2 mg/kg body weight per day), calculated margin of exposure (MOE) value was 1,142. This result indicates the MOE was well below 10,000. Following the conclusions of European Food Safety Authority (EFSA) committee, a potential human health risk should be concerned.
-
In this study, an up-to-date AA database of the Sixth TDS was established to estimate AA exposure for Chinese adults. We found that cereals and vegetables were 100% contaminated with AA, while water and beverages and alcohol beverages had the lowest contamination rates (Table 1). The highest contamination level of AA was found in potatoes from Jiangxi (176.90 μg/kg), followed by the vegetables from Guizhou (154.85 μg/kg) and sugar from Hebei (129.31 μg/kg). Foods cooked at high temperatures (above 120 ℃) upon frying, roasting, and baking were found to produce large amounts of acrylamide, especially starchy foods such as potatoes. The mean concentration of potatoes was 17.74 μg/kg, which was only half of our last TDS (3). It was lower than the mean level of non-fried products of potatoes (108 μg/kg) in the report of EFSA (4), and also much lower than the mean level of potato snacks (554.5 μg/kg) in a survey conducted in the Republic of Korea (5). According to the commission regulation European Union (EU) 2017/2158, the AA benchmark levels of potato products (750 μg/kg), barley and rice-based products (150 μg/kg), roast coffee (400 μg/kg), and baby foods (40 μg/kg) were reported, which were above levels found in the Sixth TDS. Due to the differences in eating habits, cooking methods, heating temperature, and amount of amino acids and carbohydrates, the levels of AA in the same food category varied between different provincial-level administrative divisions (PLADs).
Food composites HL LN HE BJ JL SX SN HA NX NM QH GS SH FJ JX JS ZJ SD HB SC GX HN GD GZ Mean* Cereals 5.69 1.93 3.21 2.78 6.38 2.14 3.00 2.52 2.57 7.39 2.58 0.14 2.28 1.77 7.76 2.26 0.11 3.15 1.79 2.25 2.27 2.64 1.82 2.47 2.95 Legumes 3.11 10.62 7.32 3.10 2.44 6.49 3.12 11.98 4.56 3.84 1.89 14.20 6.54 4.19 6.37 28.14 3.44 11.56 13.74 9.84 2.83 10.08 1.75 3.51 7.28 Potatoes 2.04 5.36 3.52 16.51 33.90 2.91 6.83 40.22 10.42 30.20 7.75 14.53 6.08 8.34 176.90 3.75 18.96 10.48 5.15 2.42 7.25 5.57 0.08 6.68 17.74 Meat 2.84 0.10 3.01 2.36 1.57 2.69 0.09 2.08 3.23 3.73 4.85 3.82 2.87 2.91 2.41 0.08 3.30 0.09 14.70 4.91 0.08 3.76 0.10 4.13 2.90 Eggs 0.08 0.11 2.53 1.21 0.09 0.11 1.86 1.83 2.92 3.32 4.00 1.24 1.64 1.98 4.21 2.58 2.03 2.34 7.23 2.52 1.79 4.52 1.09 2.05 2.22 Aquatic foods 4.53 0.12 1.63 1.09 3.09 2.96 5.10 2.26 0.08 2.83 8.67 4.47 1.31 1.17 2.25 0.08 2.85 3.58 3.23 3.90 0.08 3.91 1.56 2.45 2.63 Diary products 3.50 0.08 3.60 1.28 1.48 1.46 0.08 1.06 2.21 0.08 1.63 0.08 2.02 0.08 2.61 1.59 3.52 1.21 1.22 1.37 0.08 1.50 2.22 1.89 1.49 Vegetables 21.57 11.29 20.26 7.01 34.24 4.90 3.31 35.15 29.30 11.66 10.29 5.56 4.53 6.38 10.06 1.86 10.98 15.69 4.23 12.52 3.28 3.69 22.06 154.85 18.53 Fruits 1.30 1.13 0.08 1.28 0.08 1.46 0.08 0.08 0.09 0.08 0.08 0.08 0.08 1.16 0.08 0.08 0.08 0.08 1.00 1.41 0.08 1.40 0.08 1.51 0.54 Sugar 0.08 4.02 129.31 9.30 4.03 1.21 7.27 19.44 11.28 14.43 0.08 1.06 19.62 4.02 9.24 3.34 7.45 61.24 7.20 9.30 7.27 8.71 5.17 6.23 14.60 Water and beverages 0.08 2.66 0.08 0.08 0.08 0.08 0.08 0.08 0.08 0.08 0.08 0.08 1.65 6.09 0.08 0.08 0.08 0.08 0.08 0.08 0.08 0.08 0.08 0.08 0.50 Alcohol beverages 0.08 0.08 0.08 1.13 1.73 0.08 6.29 8.10 0.08 0.08 0.08 1.36 0.08 4.88 0.08 0.08 5.88 0.08 0.08 0.08 6.29 0.08 0.08 0.08 1.54 Abbreviations: HL=Heilongjiang; LN=Liaoning; HE=Hebei; BJ=Beijing; JL=Jilin; SX=Shanxi; SN=Shaanxi; HA=Henan; NX=Ningxia; NM=Inner Mongolia; QH=Qinghai; GS=Gansu; SH=Shanghai; FJ=Fujian; JX=Jiangxi; JS=Jiangsu; ZJ=Zhejiang; SD=Shandong; HB=Hubei; SC=Sichuan; GX=Guangxi; HN=Hunan; GD=Guangdong; GZ=Guizhou.
* Results lower than LOD were assigned 1/2 LOD in calculations.Table 1. Levels of acrylamide (µg/kg) in food composites from the Sixth Chinese Total Diet Study, 2016–2019.
The main contributing food group based on the Sixth TDS results was vegetables, followed by cereals, potatoes, legumes and nuts, water and beverages and meat, which was consistent with the Fifth TDS results but different from other international studies. For instance, Japan’s main contributor of AA exposure was beverages, followed by confectioneries, vegetables, potatoes and starches, and cereals (6). While for EU countries, the main contributors were potato fries, followed by bread, other potato products, biscuits, crackers and crispbreads, coffee, and other cereal products (7).
The dietary exposure to AA in the Third, Fourth, Fifth, and Sixth TDSs was 0.188, 0.286, 0.319, and 0.175 µg/kg body weight per day, respectively (2). The mean EDIs of AA for the previous 3 studies showed a significant increasing trend, while a significant decrease of 45.1% (compared with the Fifth TDS) was observed in this study, and the values were the lowest since 2000. According to the 4 TDS results, vegetables were consistently the main contributor of AA intake, and the results were all relatively stable with more than 0.1 µg/kg body weight per day, followed by cereals, potatoes, and legumes (Table 2). The EDI of cereals decreased significantly compared with the previous three times, resulting in the lowest mean dietary exposure to AA in the Sixth TDS. Furthermore, the EDIs of individual PLADs were compared between the Fourth, Fifth, and Sixth Chinese TDS (Figure 2). The EDIs varied in different PLADs, but fortunately, half of the PLADs’ EDI values decreased to the lowest level from 2005 to 2019. For some areas, such as Heilongjiang, Hebei, and Hubei, the main contributors (cereals) decreased compared with the previous study, resulting in a dramatic drop of TDS in these PLADs. The value obtained in the current study was much lower than most international studies (3,6,8), which indicated that the national dietary exposure risk to AA is at a low level compared to the world.
Food composites HL LN HE BJ JL SX SN HA NX NM QH GS SH FJ JX JS ZJ SD HB SC GX HN GD GZ Mean Cereals 49.534 18.904 38.530 35.095 59.296 35.194 36.363 36.991 26.951 84.811 31.417 1.477 16.243 17.780 77.592 27.915 1.071 49.742 15.037 34.590 33.861 24.197 13.182 26.459 33.010 Legumes 2.242 20.557 6.630 5.003 2.917 7.144 4.102 10.259 2.546 2.427 0.194 9.290 12.202 5.225 7.458 37.068 7.702 9.627 14.572 10.561 1.902 11.618 0.775 5.660 8.237 Potatoes 2.502 6.130 3.408 15.317 64.571 5.474 12.423 51.261 16.517 58.639 12.466 33.194 3.464 5.601 90.303 1.990 11.038 7.691 7.240 2.413 1.479 4.743 0.033 3.632 17.564 Meat 2.704 0.105 2.264 2.526 1.661 5.854 0.049 1.829 2.394 4.349 5.462 1.878 5.038 3.969 3.588 0.118 6.201 0.133 12.667 10.039 0.192 8.931 0.167 6.984 3.713 Eggs 0.052 0.068 1.269 0.745 0.059 0.036 0.649 0.865 0.604 1.567 0.834 0.438 1.018 0.596 1.369 1.153 0.771 1.647 2.868 0.585 0.398 1.636 0.413 0.529 0.840 Aquatic foods 1.952 0.030 0.245 0.284 0.547 0.301 0.332 0.166 0.003 0.464 0.490 0.200 1.426 1.196 1.561 0.051 2.274 1.294 2.085 0.518 0.124 4.123 1.268 0.135 0.878 Diary products 0.743 0.056 1.385 1.737 0.759 0.960 0.025 0.330 0.534 0.044 1.386 0.018 2.288 0.046 0.904 0.694 1.871 0.443 0.130 0.273 0.023 0.428 1.284 0.844 0.717 Vegetables 109.745 58.522 94.417 43.580 210.912 24.088 15.105 155.119 72.678 47.589 50.715 21.895 28.835 40.181 72.121 12.547 77.428 101.180 27.798 60.173 18.383 31.233 82.820 1002.636 102.487 Fruits 1.291 1.375 0.048 2.303 0.112 0.809 0.051 0.031 0.125 0.145 0.020 0.042 0.093 1.101 0.072 0.035 0.085 0.069 0.305 0.335 0.082 1.406 0.037 0.503 0.436 Sugar 0.003 0.047 1.006 0.291 0.061 0.021 4.378 0.120 0.143 0.238 0.001 0.007 2.364 0.019 0.141 0.014 0.125 0.476 0.021 0.060 0.054 0.069 0.019 0.029 0.404 Water and beverages 1.552 20.827 0.985 1.407 1.653 0.947 0.439 1.514 0.657 3.270 0.785 1.500 18.414 83.638 1.500 1.281 0.999 2.287 0.362 0.399 1.654 1.349 1.515 1.590 6.272 Alcohol beverages 0.028 0.043 0.014 0.490 0.263 0.000 0.166 0.407 0.001 0.026 0.006 0.071 0.029 1.104 0.027 0.048 5.858 0.144 0.018 0.007 3.196 0.021 0.002 0.003 0.499 Total 172.348 126.664 150.200 108.778 342.811 80.827 74.080 258.893 123.152 203.569 103.777 70.010 91.413 160.457 256.637 82.913 115.424 174.733 83.103 119.954 61.348 89.755 101.514 1049.005 175.057 Abbreviations: HL=Heilongjiang; LN=Liaoning; HE=Hebei; BJ=Beijing; JL=Jilin; SX=Shanxi; SN=Shaanxi; HA=Henan; NX=Ningxia; NM=Inner Mongolia; QH=Qinghai; GS=Gansu; SH=Shanghai; FJ=Fujian; JX=Jiangxi; JS=Jiangsu; ZJ=Zhejiang; SD=Shandong; HB=Hubei; SC=Sichuan; GX=Guangxi; HN=Hunan; GD=Guangdong; GZ=Guizhou. Table 2. Estimated dietary intake of acrylamide (ng/kg body weight per day) from the Sixth Chinese Total Diet Study, 2016–2019 (n=288).
 Figure 2.
Comparative estimated daily intakes of acrylamide from the Fourth, Fifth, and Sixth TDS in various PLADs in China.
Abbreviations: TDS=Total Diet Study; PLADs=provincial-level administrative divisions; EDI=estimated dietary intakes.The MOE approach was employed to estimate the risk of AA exposure by Joint Expert Committee for Food Additives (JECFA) in 2021. Based on the NOAEL value for morphological nerve changes (0.2 mg/kg body weight per day), the overall Chinese MOE of the Sixth TDS was 1,142. According to the conclusions of EFSA committee, an MOE value of 10,000 or higher would be of low public health concern. Hence, the current value (1,142) is far below 10,000, indicating a potential human health risk that should be of concern for Chinese population. Notably, the MOE value for Guizhou was very low (191), which was lower than the value (310) reported by JECFA. Therefore, efforts should be made to reduce dietary exposure to AA, both by changing food processing methods and promoting healthy eating habits. However, there are several limitations of this study, such as food coverage, food processing method (temperature, time, etc.), uncertainties of consumption data, accuracy of detection method, and no assessment for different ages.
In the Sixth TDS, the mean EDI of AA for the Chinese population was 0.175 µg/kg body weight per day, which was lower than the values of the three previous TDSs and other international studies, indicating that measures implemented to reduce AA were effective from 2016 to 2019. However, the calculated MOE value was relatively low, still implying potential human health concerns. Vegetables, cereals, and potatoes were the 3 top predominant sources and accounted for 88% dietary exposure to AA. It is necessary to monitor continuously the AA exposure risk in the Chinese population. In the future, food processing methods and daily diet should be altered to reduce dietary exposure to acrylamide.
-
No conflicts of interest.
-
The 24 provincial-level CDCs in China.
HTML
| Citation: |

|