-
Low-birth-weight infants (LBWI) are newborns weighing less than 2,500 grams at birth (1). Low birth weight (LBW) significantly affects perinatal, neonatal, and infantile health (2) and is an important risk factor for neonatal death. LBW is associated with intellectual disability, obesity, diabetes, other metabolic diseases (3), and an increased risk of chronic diseases in the elderly (4).
This research used publicly available national mortality surveillance data to analyze the epidemiological characteristics of LBWI deaths in China from 2004 to 2019. We used joinpoint regression to estimate trends in death by gender, urban or rural residency, and region.
The study found that while the mortality rate of LBWI decreased between 2004 to 2019, the proportion of overall infant deaths due to LBW increased. LBW therefore continues to threaten the life and health of Chinese infants.
Systematic prevention of LBW during the pre-marital period, pre-pregnancy period, and pregnancy should be improved. It is necessary to strengthen professional neonatal healthcare specialties and improve the treatment of LBWI.
Data for this study came from the “Data set of national mortality surveillance 2004–2019”. This monitoring system uses a multistage stratified cluster sampling technique. From 2004 to 2012, the monitoring system covered 161 monitoring points in 31 provincial-level administrative divisions (PLADs); the population monitored exceeded 77 million, accounting for 6% of the population of China. From 2013 to 2019, the number of monitoring points reporting deaths increased to 605, with a monitored population of more than 300 million, accounting for 24% of the national population.
We used Excel 2019 (Microsoft Office 2019, Microsoft Corporation, Redmond, USA) to input and sort data, calculate mortality rates, and determine the proportion of infant deaths due to LBW. The Joinpoint Regression Program (version 4.9.0.0; Information Management Services, Inc; Calverton, MD, USA) was used for statistical analysis. Joinpoint regression models were fit using a weighted least squares method and were used to estimate trends of LBWI mortality rate and the proportion of infant deaths due to LBW. The permutation test was used to determine statistically significant joinpoints. There were 16 data points in this study. Consistent with the model’s requirements, the maximum number of joinpoints was two. We determined the annual percentage change (APC) in each time period and the average annual percentage change (AAPC) and their 95% confidence intervals (CIs). APC>0 means that the mortality rate or constituent ratio (proportion of deaths attributed to a specific cause) increases year-by-year in a certain time period; APC<0 means decreasing year-by-year. If there were no joinpoint points, APC=AAPC, indicating that the mortality rate or constituent ratio increased or decreased year-by-year over the whole time period. AAPCs by gender, urban or rural area, and region were compared, and the AAPC differences and their 95% CIs were calculated. If 95% CIs did not include 0, the AAPC difference was statistically significant (5). We used a statistical test level, α=0.05.
Mortality rates, constituent ratios, and trends of LBWI during infancy were calculated by gender, area type, and region. According to the classification method of the National Bureau of Statistics, monitoring points were divided into east, central, and west regions, containing 11, 8, and 12 PLADs, respectively. Counties were in rural areas and districts were in urban areas/cities (6). LBW was coded as p05–p07 according to the International Classification of Diseases (ICD-10). The mortality rate of LBWI = number of infant deaths due to LBW / total number of infants × 100,000. The constituent ratio of LBW infant deaths was the percentage of infant deaths due to LBW and was defined as the number of infant deaths due to LBW / total number of infant deaths × 100%.
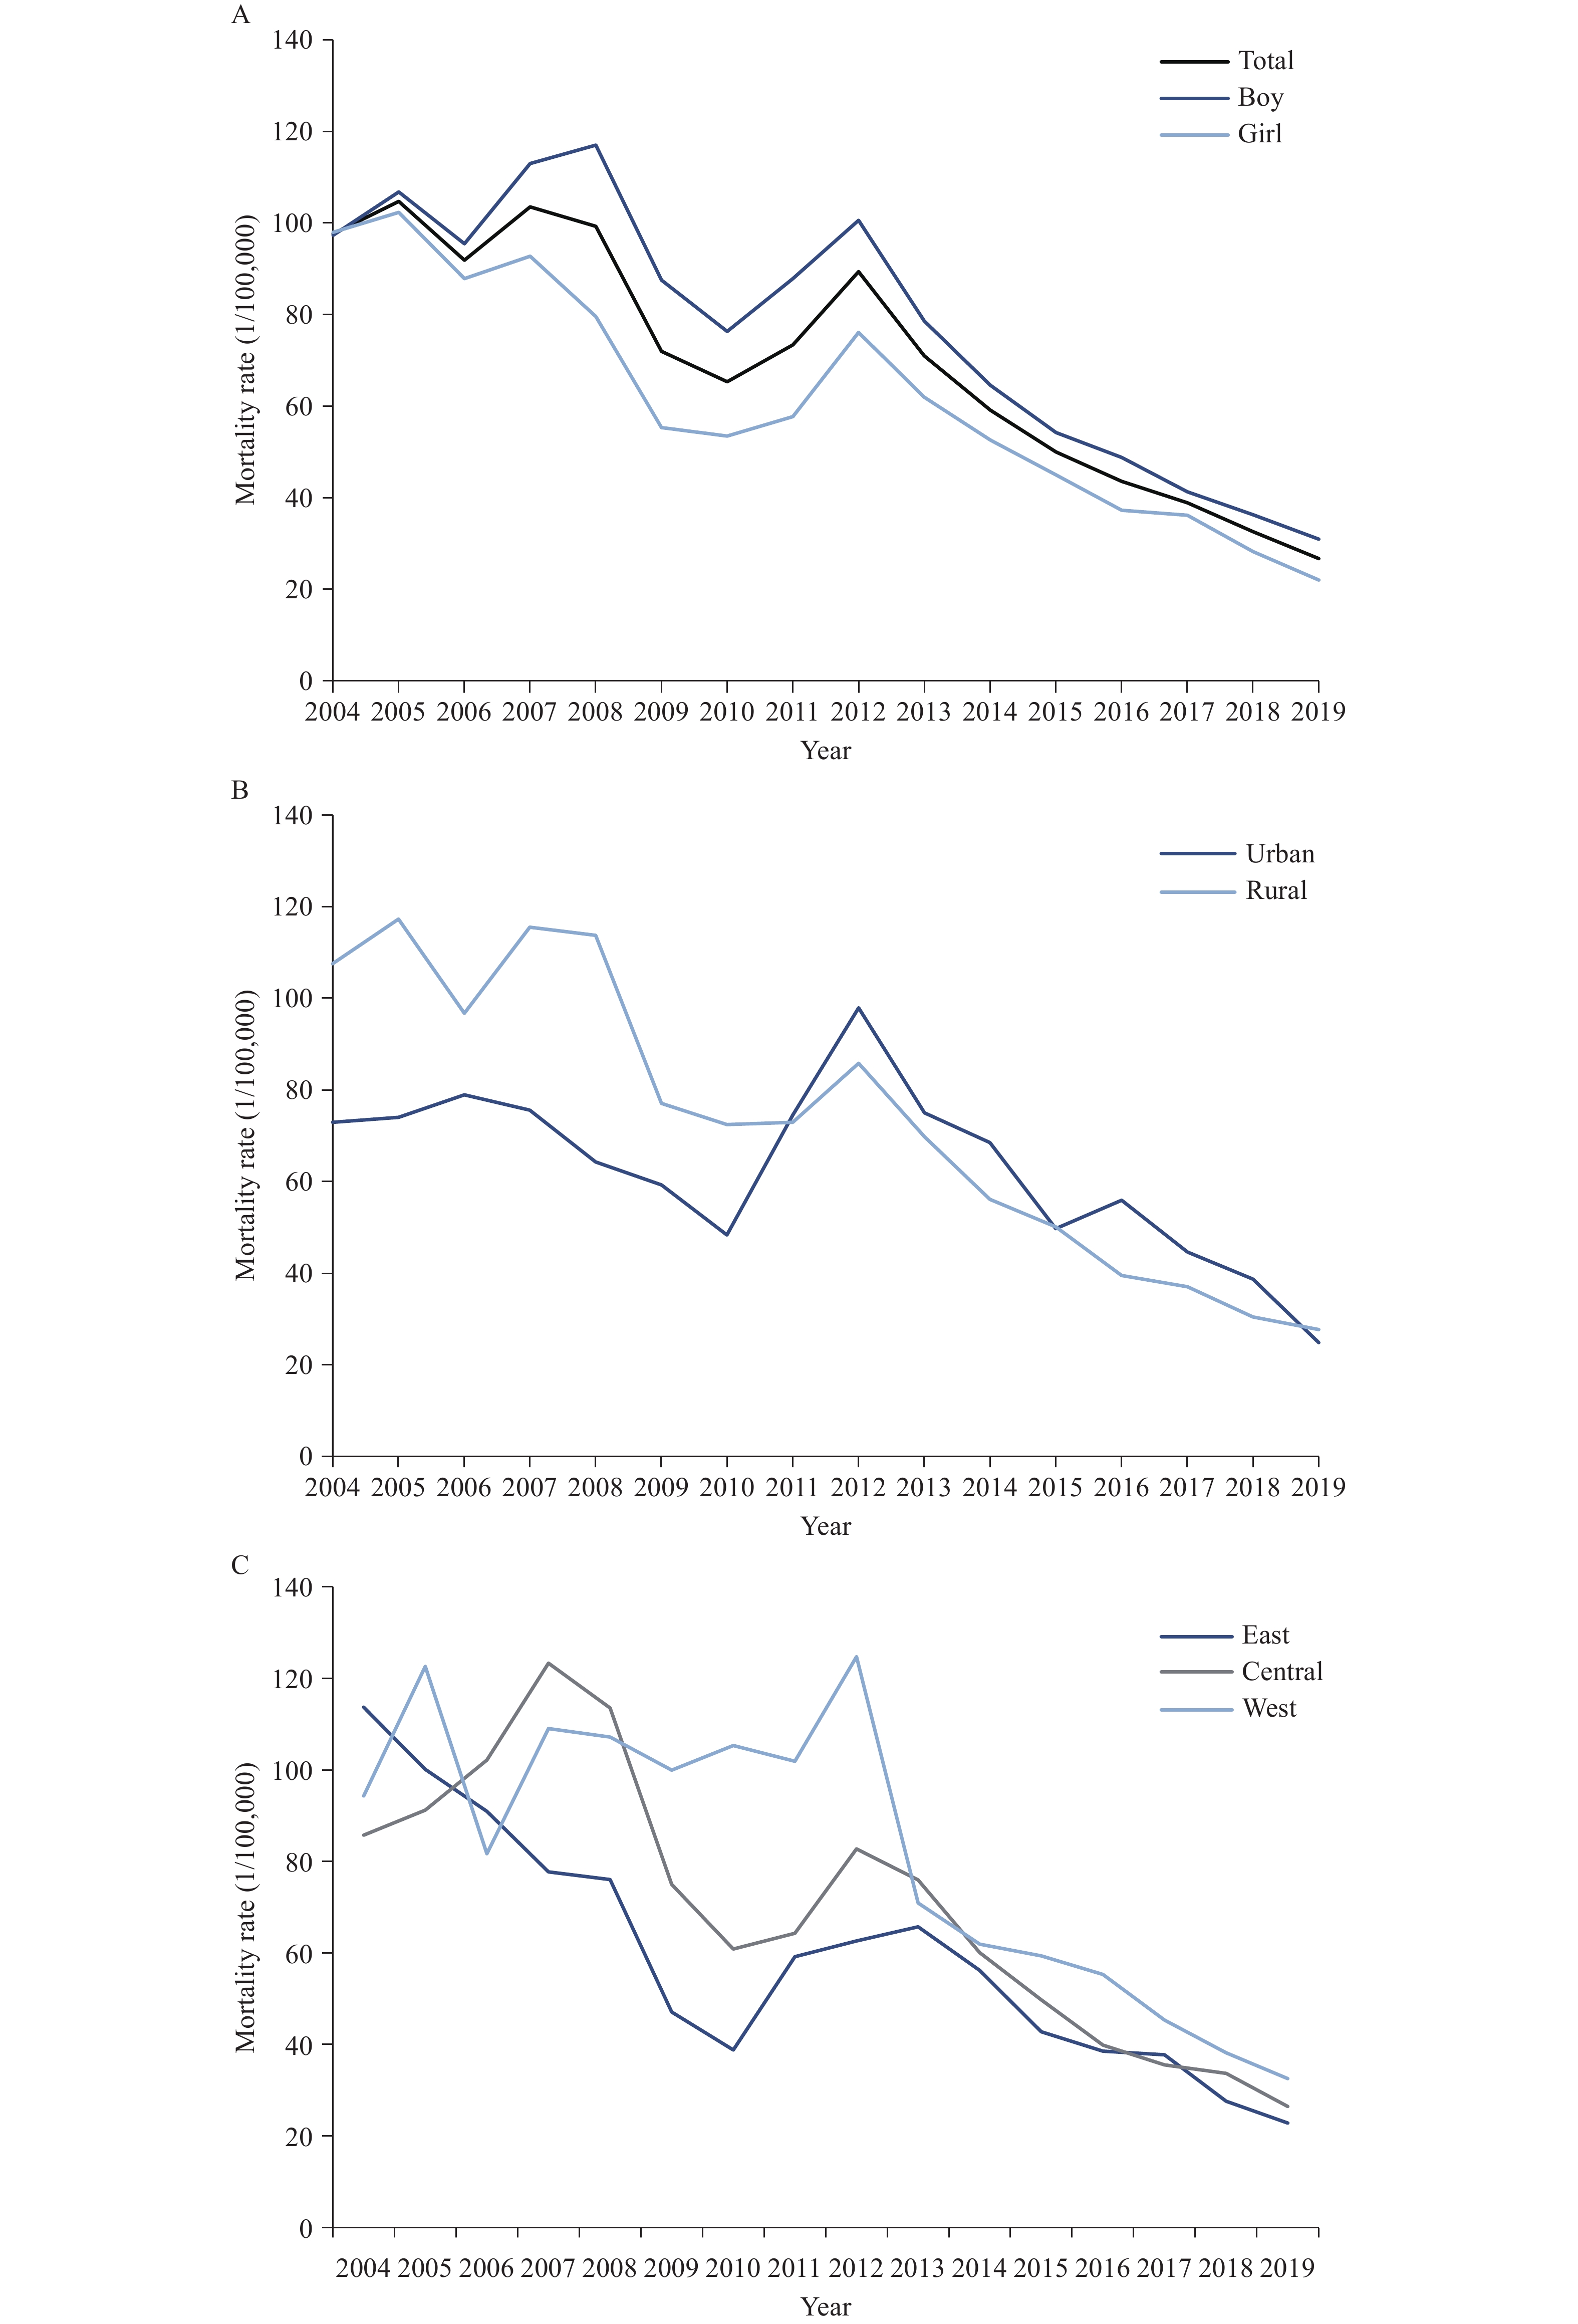
From 2004 to 2019, the mortality rate of LBWI during infancy decreased from 97.66/100,000 to 26.75/100,000 (Figure 1), with a statistically significant AAPC of –8.5% (95% CI: –11.0% to –5.9%). Mortality rates by gender, urban or rural area, and region all decreased significantly. The rural area mortality rate APC was –13.8% (–17.5% to –9.9%) in 2012–2019, a more rapid decline than the –5.1% (–8.5% to –1.6%) mortality rate APC in 2004–2012 (Table 1). Other than in 2004, the mortality rate of LBWI of boys was consistently higher than that of girls (Figure 1).
 Figure 1.
Mortality rates of low-birth-weight infants by (A) gender, (B) urban or rural area, and (C) region in China from 2004 to 2019 (1/100,000).
Dimension Trend 1 Trend 2 Trend 3 AAPC
(95% CI)AAPC difference
(95% CI)Year APC (95% CI) Year APC (95% CI) Year APC (95% CI) Total 2004−2013 −4.2
(−7.3 to −1.0)*2013−2019 −14.6
(−19.7 to −9.3)*−8.5
(−11.0 to −5.9)*Gender Boy 2004−2012 −2.0
(−5.2 to 1.3)2012−2019 −14.2
(−17.6 to −10.6)*−7.9
(−10.0 to −5.7)*2.0
(−4.2 to 8.1)Girl 2004−2010 −10.3
(−15.3 to −5.0)*2010−2013 4.8
(−25.4 to 47.1)2013−2019 −16.1
(−20.7 to −11.1)*−9.9
(−15.5 to −3.9)*Area type Urban 2004−2014 0.0
(−4.5 to 4.8)2014−2019 −16.4
(−26.8 to −4.5)*−5.8
(−10.2 to −1.1)*3.5
(−1.6 to 8.6)Rural 2004−2012 −5.1
(−8.5 to −1.6)*2012−2019 −13.8
(−17.5 to −9.9)*−9.3
(−11.5 to −7.0)*Region East 2004−2010 −15.1
(−19.8 to −10.2)*2010−2013 14.2
(−18.2 to 59.4)2013−2019 −16.2
(−20.8 to −11.4)*−10.4
(−15.8 to −4.6)*−3.8
(−11.2 to 3.7)†Central 2004−2007 10.8
(−15.0 to 44.5)2007−2019 −10.6
(−13.3 to −7.7)*−6.6
(−11.4 to −1.6)*0.8
(−4.6 to 6.2)§West 2004−2012 −0.1
(−3.5 to 3.4)2012−2019 −15.2
(−18.7 to −11.5)*−7.5
(−9.7 to −5.2)*−2.9
(−9.0 to 3.1)¶Abbreviations: APC=annual percentage change; AAPC=average annual percentage change; CI=Confidence interval.
* P<0.05.
† the AAPC in the eastern region is compared with that in the central region.
§ the AAPC in the central region is compared with that in the western region.
¶ the AAPC in the eastern region is compared with that in the western region.Table 1. Trends in mortality of low-birth-weight infants by gender, urban or rural area, and region in China from 2004 to 2019 (%).
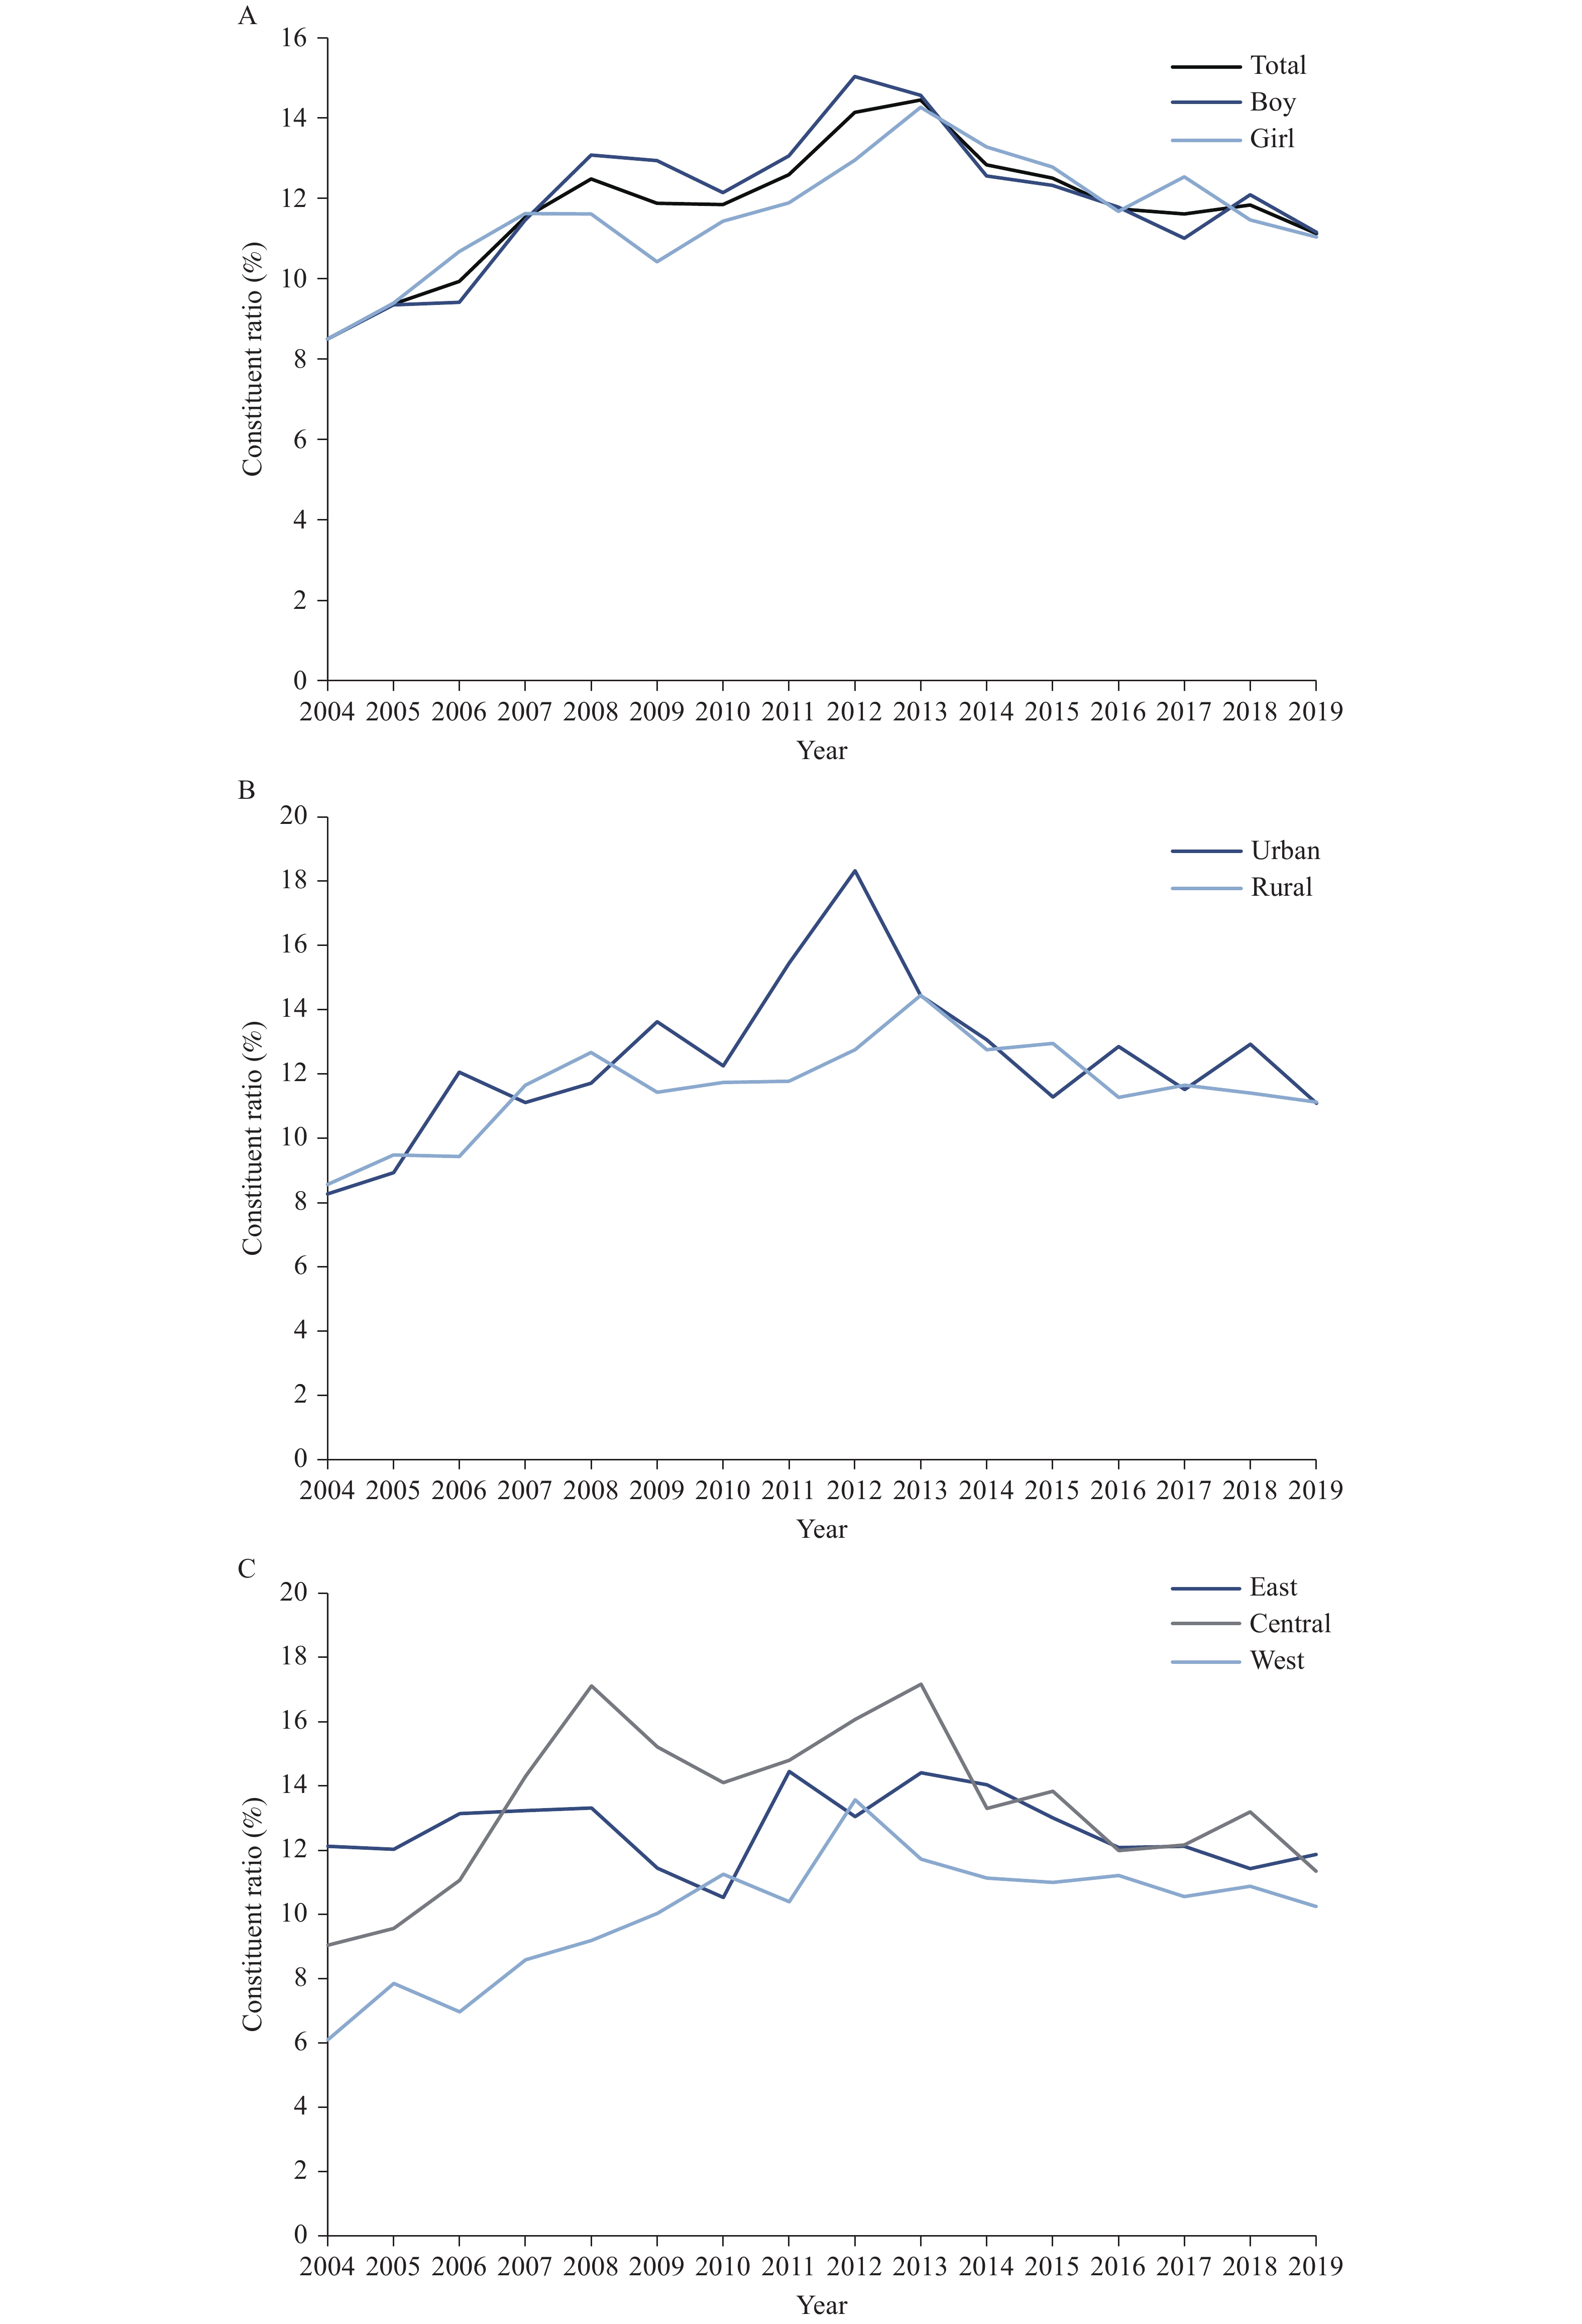
From 2004 to 2019, the percent of deaths due to LBW among infants increased from 8.5% to 11.12%, with a statistically significant AAPC of 1.4% (95% CI: 0.0% to 2.7%) (Table 2, Figure 2). In 2019, the percentages of infant deaths due to LBW in the eastern, central, and western regions were 11.87%, 11.35%, and 10.25%, respectively, with the largest increase in the western region, from 6.11% to 10.25% (Figure 2). From 2004 to 2019, the AAPCs of infant deaths due to LBW were 3.0% (95% CI: 1.5% to 4.5%) in the western region, 2.3% (95% CI: –0.1% to 4.8%) in the central region, and –0.1% (95% CI: –1.2% to 0.9%) in the eastern region. There was a statistically significant difference in AAPC between the east and west (P<0.05) (Table 2).
 Figure 2.
Percentages of infant deaths due to low birth weight (constituent ratios) in China from 2004 to 2019 by gender (A), urban or rural area (B), and region (C).
Dimension Trend 1 Trend 2 AAPC (95% CI) AAPC difference
(95% CI)Year APC (95% CI) Year APC (95% CI) Total 2004−2012 5.7 (3.7 to 7.8)* 2012−2019 −3.4 (−5.7 to −1.1)* 1.4 (0.0 to 2.7)* Gender Boy 2004−2012 6.3 (3.8 to 9.0)* 2012−2019 −4.2 (−7.1 to −1.3)* 1.3 (−0.5 to 3.0) −0.0 (−2.3 to 2.3) Girl 2004−2013 4.5 (2.7 to 6.4)* 2013−2019 −3.3 (−6.4 to −0.1)* 1.3 (−0.2 to 2.8) Area type Urban 2004−2012 7.5 (4.3 to 10.8)* 2012−2019 −5.3 (−8.7 to −1.7)* 1.3 (−0.8 to 3.5) 0.2 (−2.5 to 2.9) Rural 2004−2013 4.6 (2.5 to 6.6)* 2013−2019 −3.9 (−7.3 to −0.3)* 1.1 (−0.6 to 2.8) Region East 2004−2019 −0.1 (−1.2 to 0.9) −0.1 (−1.2 to 0.9) −2.5 (−5.1 to 0.2)† Central 2004−2008 18.0 (8.2 to 28.6)* 2008−2019 −2.9 (−4.6 to −1.1)* 2.3 (−0.1 to 4.8) −0.7 (−3.6 to 2.2)§ West 2004−2012 8.4 (6.1 to 10.7)* 2012−2019 −2.8 (−5.3 to −0.3)* 3.0 (1.5 to 4.5)* −3.1 (−4.9 to −1.3)*¶ Abbreviations: APC=annual change percentage; AAPC=average annual change percentage; CI=confidence interval.
* P<0.05.
† the AAPC in the eastern region is compared with that in the central region.
§ the AAPC in the central region is compared with that in the western region.
¶ the AAPC in the eastern region is compared with that in the western region.Table 2. Trends in percentages of infant deaths due to low birth weight (constituent ratios) by gender, urban or rural area, and region in China from 2004 to 2019 (%).
-
LBW is an important cause of infant deaths that threatens the life and health of infants. Based on the analyses of causes of death from 2004 to 2019, we found that mortality rates of LBWI decreased overall, and by gender, urban or rural area, and region. Our findings were similar to another study (7), and may be due in part to many special maternal and child health projects for pregnant women and newborns implemented by the government of China. These projects include a neonatal resuscitation project and a rural maternal hospital delivery subsidy that improved maternal and child healthcare and newborn resuscitation practices, leading to a reduction in LBWI mortality.
The infant mortality rate in rural areas decreased faster after 2012 than it did before 2012. This may be related to accelerating implementation of the “China Children’s Development Program (2011–2020)”, which increased funding for maternal and child health in rural and remote areas (8) and expanded basic coverage of the new rural cooperative system after 2010 (9). The Ministry of Health and three other governmental departments pointed out that beginning in 2012, newborns were automatically eligible for the new rural cooperative medical treatment program (10), effectively increasing the accessibility of basic health services for LBWI in rural areas.
The infant mortality rate of boys was higher than that of girls, which was consistent with existing research (7). Biological factors were a determining factor of sex differences in infant mortality. According to a study, girls are likely to have an innate survival advantage, leading to a lower infant mortality rate compared to boys (11).
The percent of infant deaths due to LBW increased during the study period, indicating that LBW still affects the life and health of Chinese infants. This may be related to a relatively insufficient investment in medical and healthcare for LBWI (12), as infant mortality from causes other than LBW declined faster than infant mortality due to LBW. Currently, LBW is the most common cause of infant death in China (13). A key to reducing child mortality and improving children’s health is to reduce the mortality of LBWI. From 2004 to 2019, the percent of infant deaths due to LBW increased faster in the western region than in the eastern region, suggesting that the western region should focus on LBW prevention and clinical care improvement in the future.
Our study was subject to at least two limitations. The data were extracted from a publicly available cause of death monitoring data system in China. The monitoring system was integrated and expanded in 2013. There may be omissions in reporting data at various monitoring points, especially the expanded monitoring points, so that the mortality of LBWI may be underestimated. We could not obtain individual level data, and therefore could not determine the risk factors of LBW. Further targeted research is needed.
A LBW prevention and control system covering pre-marital and pre-pregnancy periods, pregnancy, and newborn and infant care is recommended to be implemented to reduce the occurrence of LBW and its associated death. Health policies that increase investment in the prevention of LBW and improvement in LBWI healthcare should be promoted, especially in the western region of China. Research should actively explore the etiologies of LBW. The whole society should pay attention to LBWI and take effective measures to improve survival rates and quality of life with the aim of reducing infant mortality and increasing life expectancy.
HTML
| Citation: |


 Download:


