-
China is the world’s leading producer and exporter of coke, and its annual production are at leading level in the world. Coke oven emissions (COE) are the predominant pollutants generated in coking production, which mainly contain particulate matter and volatile organic compounds, especially polycyclic aromatic hydrocarbons (PAHs). Coke oven workers are liable to be at risk for occupational COE exposure and for developing respiratory disorders and diseases, even lung cancer. In the context, this study deals with the assessment of the carcinogenic risk attributable to PAHs exposure based on data collected from the national reporting system of occupational disease in China and interpreted with field investigations. Consequently, coke oven emissions-induced lung cancer was mainly found in manufacturing industries, especially in petroleum processing, coking and nuclear fuel processing, followed by chemical raw materials and chemical products. Coke oven workers exposed to higher levels of PAHs in different workplaces have a higher risk of occupational lung cancer. These findings reinforce the notion that it is necessary to continuously strengthen the monitoring of the COE, regulate emissions, and maintain health surveillance for occupational protection and health promotion among coke oven workers.
In this study, the data from the Chinese reporting system of occupational disease from 2008 to 2019 were systematically gathered based on the retrieval of character strings such as “coke oven emission” and “occupational cancer or tumor”, etc., and the industrial distribution characteristics of lung cancer caused by coke oven emissions were then analyzed.
Based on this context, we selected some coking plants in the East and Southwest of China for further research. The selection of coking plants as key industries is based on these representative industries being closely related to coke oven emissions exposure. A total of 8 different working regions in different coking plants were selected for PAHs concentration detection by high-performance liquid chromatography. Meanwhile, the incremental lifetime cancer risks (ILCR) due to PAHs exposure in different working positions were calculated by using the following formula.
$$ ILCR=\frac{CSF\times C\times IR\times EF\times ED}{AT\times BW} $$ CSF represented the cancer slope factor, which was adopted in this study as 1.38 kg·day/mg proposed by Judith Petts in 1997 (1), C represented the exposure concentration (mg/m3), IR represented the respiration rate as 1.5 m3/h, EF represented days of exposure per year, ED represented the years of exposure, AT represented the average time — which is typically set to 70 years — and BW represented body weight (kg) and was assumed to be 70 kg for adults (2). ILCR was acceptable if it was no more than 1×10⁻⁶.
The industrial distribution of cases was shown in Figure 1. There were differences in the incidence of COE-induced lung cancer among occupational population in different industries, and the two industries with the highest incidence were petroleum processing and coking and nuclear fuel processing (60.93%), followed by chemical raw materials and chemical products (14.88%).
 Figure 1.
Industrial distribution of lung cancer cases caused by coke oven emissions in China from 2008 to 2019.
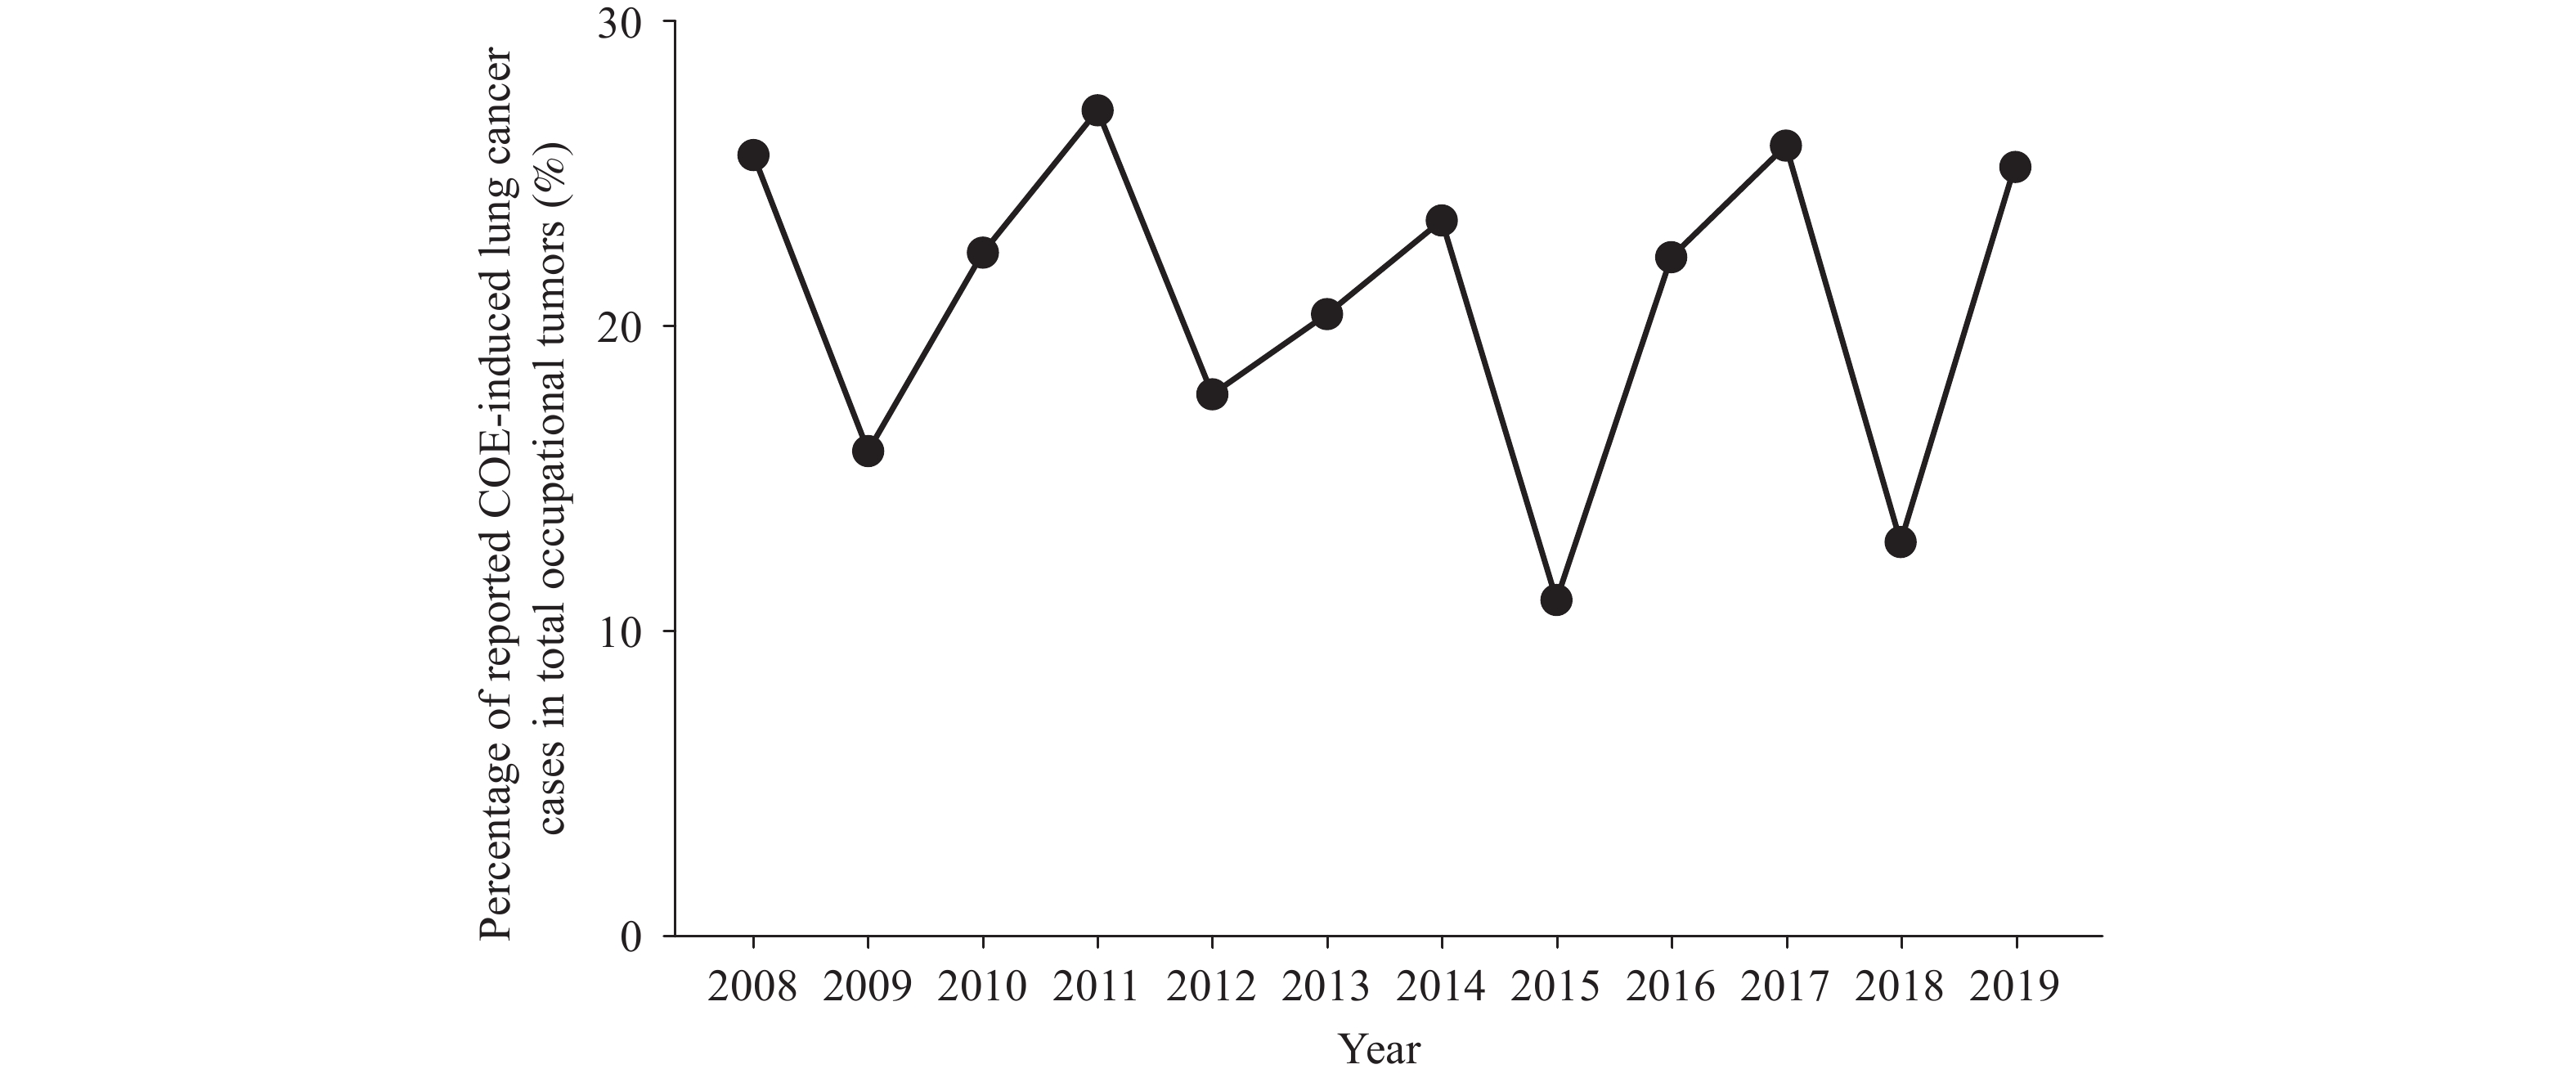
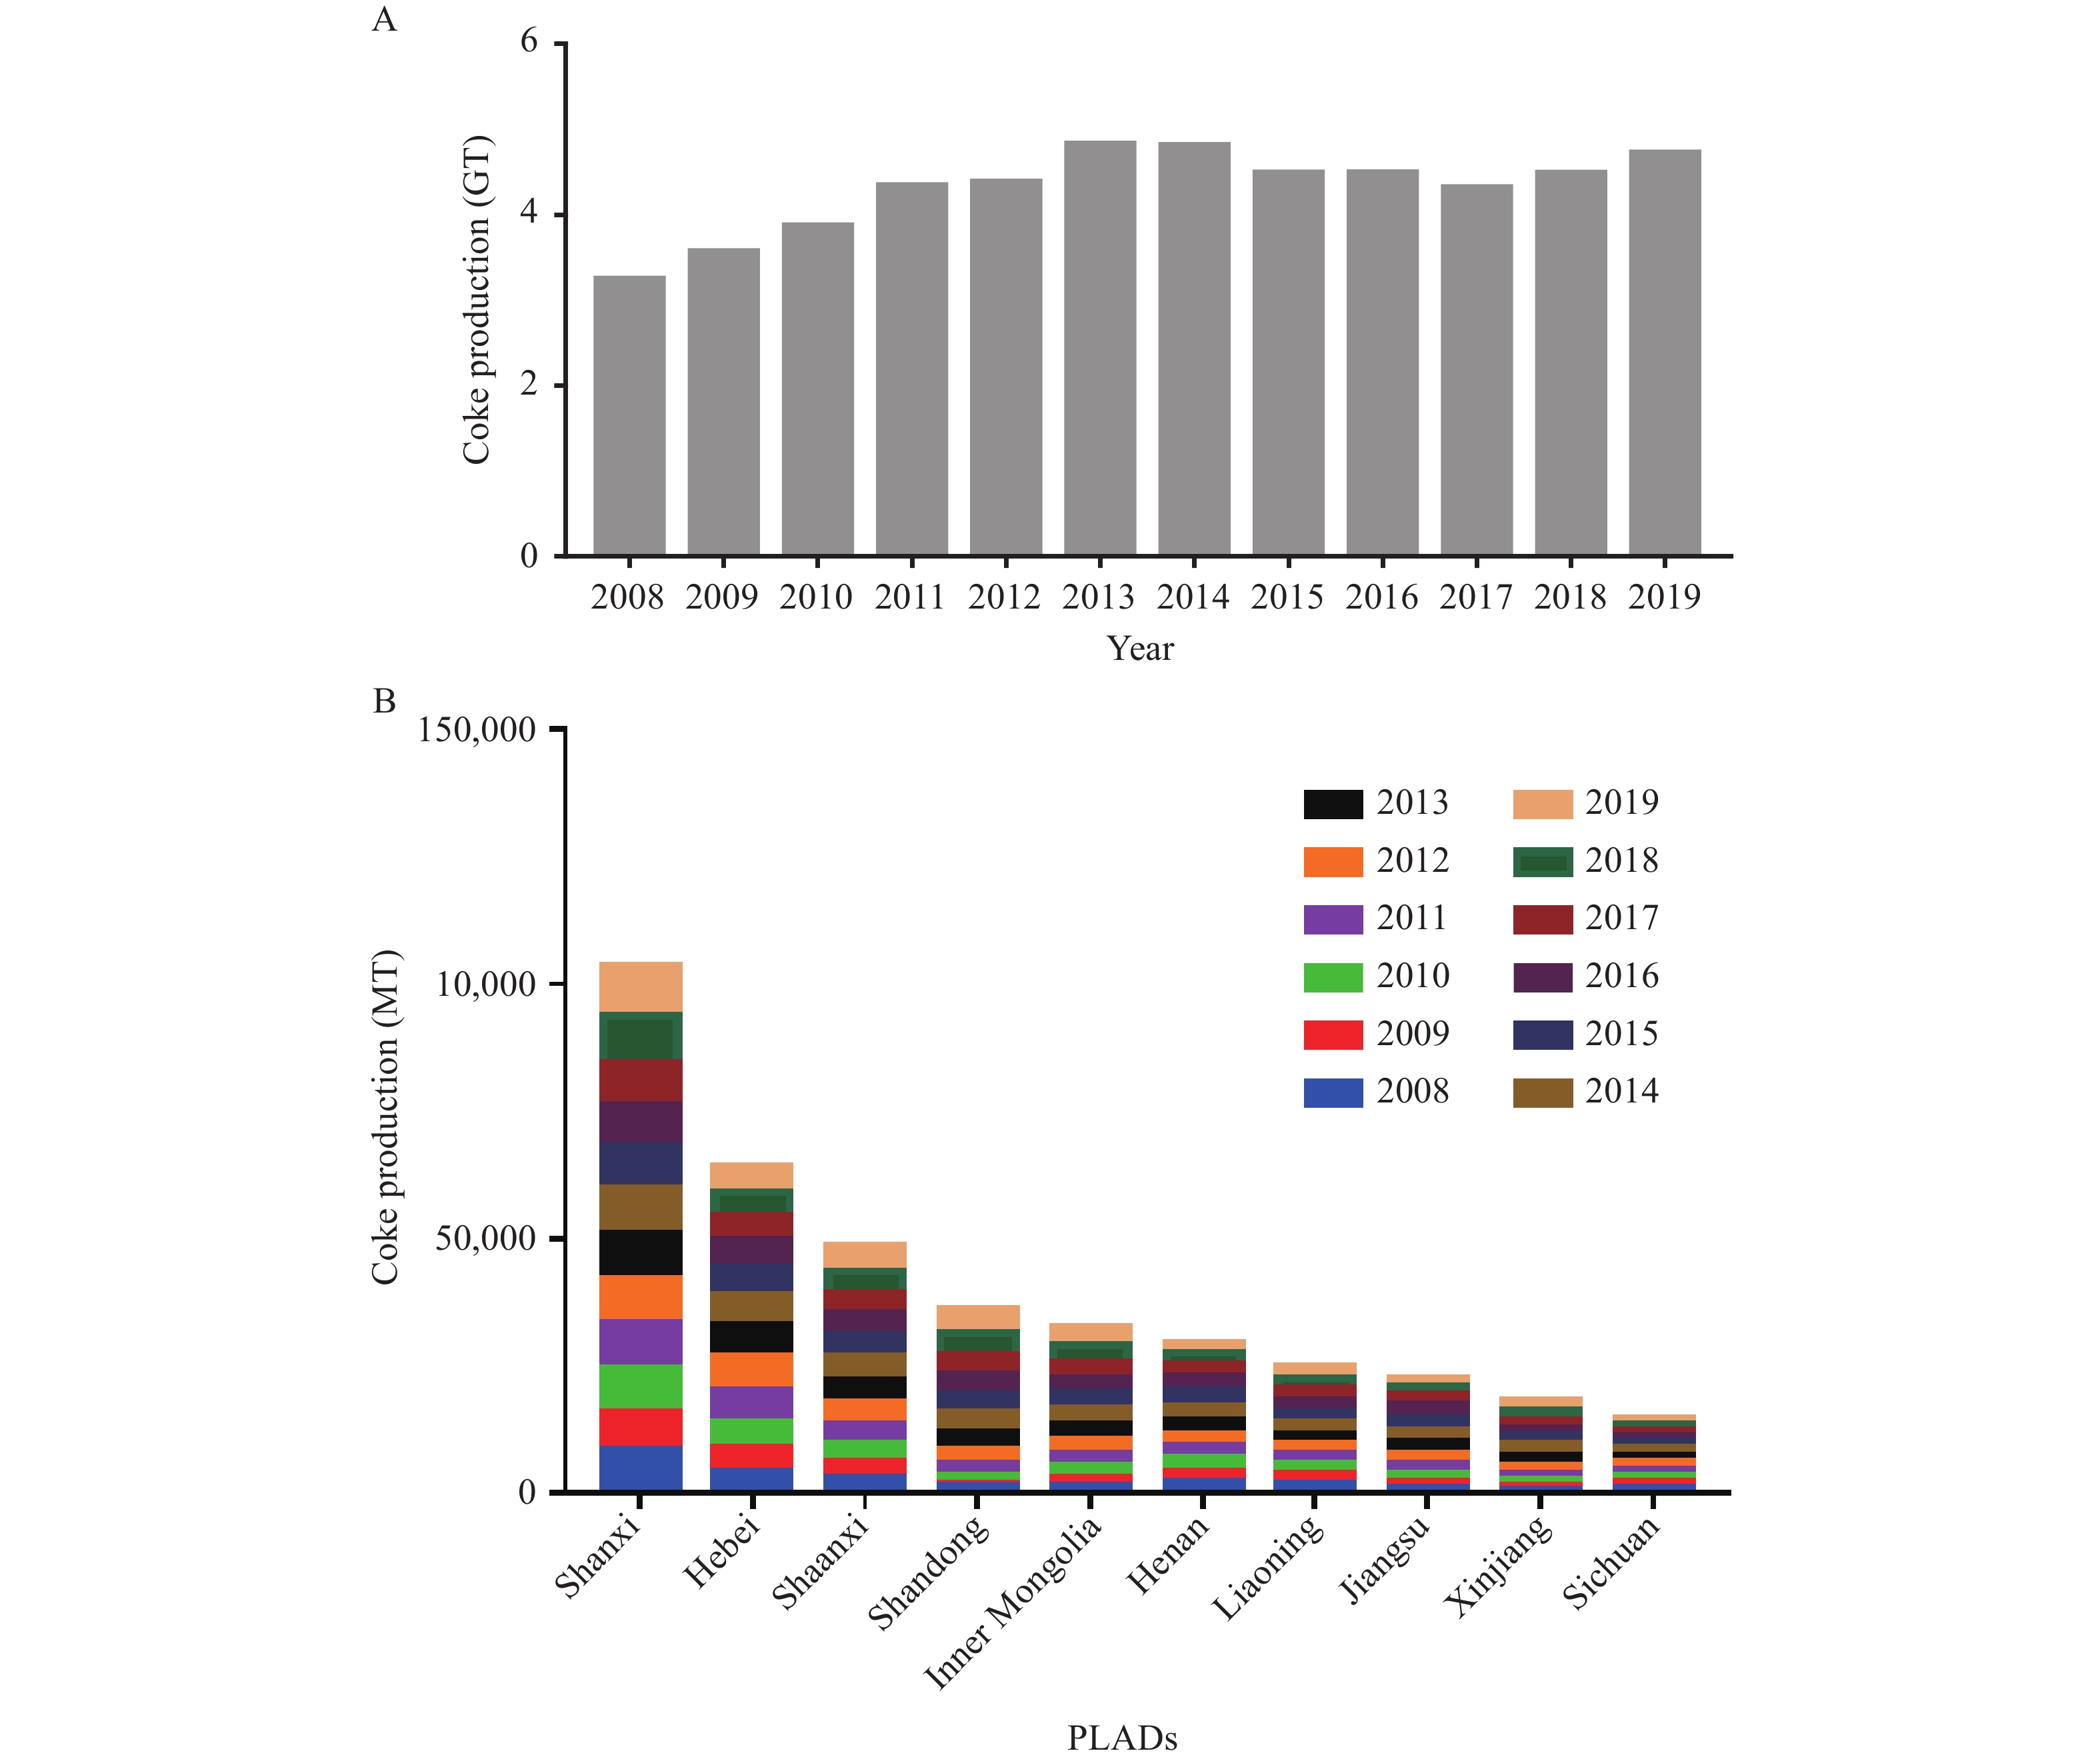
Coke oven emissions-caused lung cancer is one of the most prominent occupational cancers in the national occupational disease reporting system. The change pattern of proportion of COE-induced lung cancer in occupational tumors over time were shown in Figure 2. According to the Chinese reporting system of occupational disease, the proportion of total lung cancer of coke oven workers accounted for more than 25% of total reported occupational tumors in four years (2008, 2011, 2017, and 2019), with the highest in 2011 (27.17%). The coke output in China from 2008 to 2019 was illustrated in Figure 3A, and Figure 3B showed the top ten provincial-level administrative divisions (PLADs) with the highest coke output in China from 2008 to 2019. The average annual coke output from 2008 to 2019 was 4.29 million tons. Shanxi, Hebei, Shandong, Shaanxi, and Inner Mongolia were all PLADs contributing to the production of coke in China.
 Figure 2.
The proportion of lung cancer cases caused by coke oven emissions in occupational tumors from 2008 to 2019.
Abbreviation: COE=coke oven emissions. Figure 3.
Coke production in China from 2008 to 2019 and the top ten PLADs in production from 2008 to 2019. (A) The coke output in China from 2008 to 2019, with with an average annual output of 4.29. (B) The top ten PLADs with the highest coke output in China from 2008 to 2019.
Abbreviations: GT=gigaton; MT=megaton; PLADs=provincial-level administrative divisions.Monitoring data of PAHs and risk analysis of lung cancer induced by coke oven emissions at different positions in coking plants in East and Southwest China were listed in Table 1. The riser platform had the highest carcinogenic risk in two coking plants.
Workplaces A plant in East of China A plant in Southwest of China PAHs concentration (ng/m3) Carcinogenic risk* PAHs concentration (ng/m3) Carcinogenic risk* Furnace cover 8,218.77 5.71×10⁻⁴ 4,227.82 2.94×10⁻⁴ Riser platform 12,560.43 0.87×10⁻³ 48,100.25 3.34×10⁻³ Coal filling car driver 3,678.99 0.26×10⁻³ 24,145.17 1.68×10⁻³ Coke blocking car driver 1,852.47 1.29×10⁻⁴ 1,620.04 1.13×10⁻⁴ Coke side door of coke oven 1,758.37 1.22×10⁻⁴ 889.45 6.18×10⁻⁵ Pusher side door of coke oven 4,135.63 2.87×10⁻⁴ 403.93 2.81×10⁻⁵ Coke pushing car driver 1,757.64 1.22×10⁻⁴ 2,144.22 1.49×10⁻⁴ Switch control 291.40 2.02×10⁻⁵ 681.45 4.73×10⁻⁵ * The ILCR due to PAHs exposures in different working positions were calculated by using the following formula:
$ ILCR=\dfrac{CSF\times C\times IR\times EF\times ED}{AT\times BW} $
where CSF represented the cancer slope factor which was adopted in this study as 1.38 kg·day/mg proposed by Judith Petts in 1997 (1), C represented the exposure concentration (mg/m3), IR represented the respiration rate as 1.5 m3/h, EF represented days of exposure per year, ED represented the years of exposure, AT represented the averaging time which is typically set to 70 years, BW represented body weight (kg) and is typically assumed to be 70 kg for adults (2).
Abbreviations: ILCR=lifetime cancer risks; PAHs=polycyclic aromatic hydrocarbons.Table 1. PAHs monitoring and carcinogenic risk evaluation at working positions in coking plants.
-
Coke production has been steadily developing in China, with a large number of workers being exposed to the emissions in various industries. The lung cancer caused by coke oven emissions has been listed as a national statutory occupational cancer, and a definitive procedure for its diagnosis has been established. This study focused on the occurrence of coke oven emissions-induced occupational lung cancer in China from 2008 to 2019 and selected key industries for further exploration to provide the basis for the prevention of respiratory tumors. From 2008 to 2019 in China, the reported lung cancer cases from COE exposure accounted for 20.69% of the total of 11 occupational tumors. In terms of the industrial distribution of the disease, petroleum processing and coking and nuclear fuel processing industries accounted for more than 50% of total cases, followed by chemical raw materials and chemical products. Moreover, coke oven workers were a high-risk group for lung cancer caused by coke oven emissions with high PAHs concentrations; therefore, prevention and control of lung cancer caused by COE is still of great importance.
Occupational cancers are rapidly globalizing. Occupational cancers can arise due to extensive exposure to well-known and suspected occupational carcinogens. As early as 1976, coke production was classified as “Group 1 carcinogens” by the International Agency for Research on Cancer (IARC), and numerous epidemiological studies have shown that occupational exposure to PAHs was associated with an increased risk of occupational lung cancer (3). A 30 year follow-up study of 15,818 workers with a working history confirmed that coke oven emissions were associated with significant excess mortality of lung cancer with 4.45 times higher risk of respiratory cancer in coke oven workers than in non-oven workers (4).
There were many industries in contact with COE exposure, such as mining, manufacturing, etc. A cumulative meta-analysis of workers exposed to PAHs in various industries and occupations have found that workers in iron and steel foundries included a total of 2,903 lung cancer cases/deaths, with a pooled relative risk (RR) of 1.31 [95% Confidence Interval (CI): 1.07–1.61], and the lung cancer among aluminum production workers included 1,314 cases with a pooled RR of 1.07 (95% CI: 0.93–1.23) (5). In this study, we found that lung cancer induced by coke oven emissions mainly occurred in manufacturing industries. PAHs were the main toxic compounds targeted for risk assessment of coke oven emissions. The characteristics of occupational activities determined the concentration and extent of PAHs exposure. To note, coke oven workers suffering from lung cancer mainly worked at the top of coke oven workshop (6), where concentrations of PAHs would have been highest. In addition, the difference of lung cancer cases among coke oven workers in different industries may be closely related to protective measures during occupational exposure. A study reported that mean PAH exposure levels were reduced by 60% when the coke oven workers used effective masks during work (7). Current evidence demonstrated that the concentration of PAHs in each working region still varied widely. More importantly, working positions with a high carcinogenic risk were more consistent in regions with a high concentration of PAHs. Therefore, it is more important to adopt suitable protection measures for different working positions.
All industries can benefit from comprehensive coke oven emissions exposure prevention. Therefore, it is necessary to carry out in-depth monitoring of hazard factors in work environments, especially among high-risk industries. As the incubation period of lung cancer in coke oven workers can last for decades (8), continuous health surveillance is crucial for health promotion among coke oven workers, even after retirement. In addition, identification of early biomarkers for PAHs exposure may facilitate effective preventive measures to COE related health impairments (9). It has been reported that the serum club cell protein levels may serve as a sensitive marker of pulmonary damage in Chinese populations with COE exposure (10).
This study had strengths as we combined the data obtained from the Chinese reporting system of occupational disease and with field investigations to analyze the lung cancer burden in coke oven workers associated with COE exposure. Second, our risk assessment of PAH exposure incorporated information about the types of work, and the long-time span of this study provided valid information on the pattern of change over time.
This study was subject to some limitations. There was a lack of criteria for occupational PAHs risk assessment in China. In this study, the carcinogenic effects of PAHs inhalation in workers at different work positions in a coking plant were evaluated by using an EPA assessment model. In addition, we could not evaluate the age of onset and occupational history of lung cancer in coke oven workers in reported cases, and the industry classification of coke oven worker was relatively difficult, including only 2 large-scale industries (mining and manufacturing) with the rest being classified as other industries.
In summary, PAHs composition is a definitive hazard for cancer in coke oven workers as evidenced by the health risk assessment analysis, accounting for a leading cause for COE-induced occupational tumor in China. There was more urgent demand to place great emphasis on the supervision and monitoring of PAHs exposure during coke production. Meanwhile, it is necessary to strengthen the effective measures on wearing of personal protective equipment, and biomarkers of early health surveillance in the process of manufacture and cancer prevention.
-
No conflicts of interest reported.
HTML
| Citation: |


 Download:


