
 Download:


-
Over the past few decades, transitions in population structure and the growing urbanization process have led to a sharp increase in the number of middle-aged and elderly persons dwelling in urban community in Beijing (1). In recent years, levels of physical activity have declined worldwide, including in China, mainly because of rapid urbanization, reduced physical activity in the workplace, changes in modes of transportation, and other lifestyle aspects (2). Physical inactivity was responsible for an overall global economic burden that costs healthcare systems $53.8 billion worldwide in 2013, taking both direct costs (healthcare expenditure) and indirect costs (productivity losses) into account (3). Considering its prevalence, global reach, and health impact, physical inactivity should be viewed as a pandemic, with far-reaching health, economic, environmental, and social consequences (4). The pandemic of physical inactivity is associated with a range of chronic diseases and early deaths in middle-aged and older adults. The economic burden of physical inactivity remains unquantified at the global level (3). To minimize such burdens brought by physical inactivity, interventions should target middle-aged and older adults to maintain their activities of daily living (ADL) (5). This study aimed to describe the physical activity level (PAL) and its associated factors among the middle-aged and elderly populations in Beijing. The findings of multivariable logistic regression indicated that a certain of physical activity (PA) intensity [≥4,500 metabolic equivalents (MET)-min/week] was associated with varying age, education, registered residence, living arrangement, chronic diseases, and poor sleep. These might become components of a comprehensive intervention measurement for preventing physical inactivity among middle-aged and older adults. A community-based study was conducted between October 2020 and January 2021 among middle-aged and elderly populations in Beijing, China. A stratified random sampling method was used to obtain a representative sample of the community population between 40 and 79 years of age. The sampling of study areas was stratified by the type of sociodemographic features in the community, while considering the accessibility of eligible participants and feasibility of laptop-based questionnaire collection within the areas. Six communities including Changchunyuan Community, Weixiuyuan Community, Zhongguanyuan Community, Yanbeiyuan Community, Kangzeyuan Community, and Xima Community were selected as the study areas where participants were randomly selected proportionally to the total samples. The inclusion criteria were age between 40 and 79 years and functional independence in activities of ADL. Taking note of minimum representative numbers, approximately 4% of the target population was randomly selected as the sample group. Trained interviewers conducted the face-to-face computer-assisted personal interview (CAPI) with a total of 1,319 participants. After data cleaning, 1,284 data points were included in the analysis. The study protocol was approved by the Ethics Committee at School of Psychological and Cognitive Sciences, Peking University (protocol number #2019-08-04).
The structured questionnaire included sociodemographic questions (age, gender, education level, marital status, living arrangement, income, and household registration), behavioral questions (alcohol consumption and smoking), individual health status and medical history (hypertension, dyslipidemia, cardiovascular disease, diabetes, chronic lung diseases, digestive disease, arthritis, or rheumatism), all of which were self-reported by the participants, and were based on clinical diagnoses in secondary or higher hospitals.
PA was measured using the International Physical Activity Questionnaires-Long Form (IPAQ-L) by metabolic equivalents (METs). As one MET is defined as the oxygen consumption while sitting at rest [3.5 mL O2 /(kg·min)], IPAQ-L calculated metabolic equivalent minutes per week by assigning standardized MET values of 3.3, 4, 6, and 8 for walking, moderate-intensity activities, cycling, and vigorous-intensity activities. Furthermore, for the outliers, each time variable exceeding 180 minutes was truncated in accordance with IPAQ scoring protocol to minimize the possible measurement error and prevent misclassification. PAL was categorized into three levels according to MET-min/week, with <4,500 MET-min/week (low PAL), 4,500–6,000 MET-min/week (moderate PAL), and ≥6,000 MET-min/week (high PAL). Sleep quality was evaluated by using the Pittsburgh Sleep Quality Index (PSQI), where a self-rated PSQI score demonstrated superior sensitivity and specificity in distinguishing good and poor sleepers at a cut-off of 5 (6).
Univariate logistic regressions were performed to assess differences between three physical activity levels in terms of individual exposures (sociodemographic characteristics, lifestyle behaviors, individual health status, and medical history). Multivariable logistic regression was used to evaluate the association between exposure factors and different physical activity levels after adjusting for potential confounding factors, and adjusted odds ratios (aOR) with corresponding 95% confidence intervals (CIs) were calculated. All statistical analyses were performed using R software (version 3.4.4; R Foundation for Statistical Computing, Vienna, Austria).
Among 1,284 participants included in the analysis. Table 1 presents sociodemographic characteristics, behavioral factors, and chronic disease distribution at different physical activity levels. Low, moderate, and high PAL accounted for 45.72%, 25.62%, and 28.66% among 1,284 middle-aged and elderly people, respectively. There were significant differences between moderate PAL group and low PAL group in terms of age, gender, education, registered residence, living arrangement, hypertension, cardiovascular disease, and smoke. There were differences between high PAL group and low PAL group in terms of age, education, living arrangement, dyslipidemia, cardiovascular disease, and sleep quality (Table 1).
Exposure factors Physical activity level* <4,500 MET-min/week
(n=587)4,500–6,000 MET-min/week
(n=329)≥6,000 MET-min/week
(n=368)n (%) n (%) cOR (95% CI) n (%) cOR (95% CI) Age (years) <60 264 (44.97) 119 (36.17) 1.00 141 (38.32) 1.00 ≥60 323 (55.03) 210 (63.83) 1.44 (1.09–1.91)† 227 (61.68) 1.32 (1.01–1.72)† Gender Male 171 (29.13) 64 (19.45) 1.00 100 (27.17) 1.00 Female 416 (70.87) 265 (80.55) 1.70 (1.23–2.37)§ 268 (72.83) 1.10 (0.82–1.48) Education level Junior high school or below 192 (32.71) 94 (28.57) 1.00 96 (26.09) 1.00 High school 151 (25.72) 110 (33.43) 1.49 (1.05–2.11)† 145 (39.40) 1.92 (1.37–2.69)§ College or above 244 (41.57) 125 (37.99) 1.05 (0.75–1.45) 127 (34.51) 1.04 (0.75–1.44) Marital status Married 471 (80.24) 278 (84.50) 1.00 297 (80.71) 1.00 Other 116 (19.76) 51 (15.50) 0.75 (0.52–1.07) 71 (19.29) 0.97 (0.70–1.35) Registered residence Agricultural 84 (14.31) 29 (8.81) 1.00 37 (10.05) 1.00 Non-agricultural 503 (85.69) 300 (91.19) 1.72 (1.11–2.73)† 331 (89.95) 1.49 (0.99–2.27) Living arrangement Not with child 390 (66.44) 194 (58.97) 1.00 219 (59.51) 1.00 With child 197 (33.56) 135 (41.03) 1.38 (1.04–1.82)† 149 (40.49) 1.35 (1.03–1.76)† Income (per month) <3,000 CNY 135 (23.00) 75 (22.80) 1.00 89 (24.18) 1.00 3,000–6,000 CNY 276 (47.02) 157 (47.72) 1.02 (0.73–1.45) 187 (50.82) 1.03 (0.74–1.43) >6,000 CNY 176 (29.98) 97 (29.48) 0.99 (0.68–1.45) 92 (25.00) 0.79 (0.55–1.15) Hypertension No 383 (65.25) 251 (76.29) 1.00 249 (67.66) 1.00 Yes 204 (34.75) 78 (23.71) 0.58 (0.43–0.79)§ 119 (32.34) 0.90 (0.68–1.18) Dyslipidemia No 450 (76.66) 263 (79.94) 1.00 309 (83.97) 1.00 Yes 137 (23.34) 66 (20.06) 0.83 (0.59–1.15) 59 (16.03) 0.63 (0.45–0.88)§ Diabetes No 494 (84.16) 281 (85.41) 1.00 326 (88.59) 1.00 Yes 93 (15.84) 48 (14.59) 0.91 (0.62–1.32) 42 (11.41) 0.69 (0.46–1.01) Chronic lung diseases No 570 (97.10) 318 (96.66) 1.00 360 (97.83) 1.00 Yes 17 (2.90) 11 (3.34) 1.17 (0.52–2.51) 8 (2.17) 0.75 (0.30–1.72) Cardiovascular disease No 516 (87.90) 310 (94.22) 1.00 348 (94.57) 1.00 Yes 71 (12.10) 19 (5.78) 0.45 (0.26–0.74)§ 20 (5.43) 0.42 (0.24–0.69)§ Digestive disease No 542 (92.33) 302 (91.79) 1.00 339 (92.12) 1.00 Yes 45 (7.67) 27 (8.21) 1.08 (0.65–1.77) 29 (7.88) 1.03 (0.63–1.67) Arthritis or rheumatism No 496 (84.50) 289 (87.84) 1.00 318 (86.41) 1.00 Yes 91 (15.50) 40 (12.16) 0.76 (0.50–1.12) 50 (13.59) 0.86 (0.59–1.24) Smoke No 501 (85.35) 298 (90.58) 1.00 319 (86.68) 1.00 Yes 86 (14.65) 31 (9.42) 0.61 (0.39–0.93)† 49 (13.32) 0.90 (0.61–1.30) Alcohol consumption No 183 (31.18) 85 (25.84) 1.00 126 (34.24) 1.00 Yes 404 (68.82) 244 (74.16) 1.30 (0.96–1.76) 242 (65.76) 0.87 (0.66–1.15) Sleep quality Good sleep 306 (52.13) 179 (54.41) 1.00 225 (61.14) 1.00 Poor sleep 281 (47.87) 150 (45.59) 0.91 (0.70–1.20) 143 (38.86) 0.69 (0.53–0.90)§ Note: cOR, Risk of exposure factor was estimated by computing the crude odds ratio, and the precision of the odds ratio was assessed by its 95% CI.
Abbreviations: MET=metabolic equivalent; CI=confidence interval; PAL=physical activity level.
* PAL of 4,500–6,000 MET group and PAL of ≥6,000 MET group compared with physical activity level of <4,500 MET group (as control group), respectively.
† P<0.05.
§ P<0.01.
Table 1. The distribution of sociodemographic characteristics, behavioral factors, and chronic diseases affecting physical activity level among middle-aged and elderly population in Beijing, China, October 2020 to January 2021.
Figure 1 shows the distribution of sociodemographic characteristics at various PALs. The sociodemographic characteristics comprising the highest proportions for the 3 PALs were similar, and the top 5 were non-agriculture, married, female, aged ≥60, and having an income of 3,000–6,000 CNY per month; the lowest one was income <3,000 CNY per month.
 Figure 1.
Proportion of sociodemographic characteristics at different physical activity level among middle-aged and elderly population in Beijing, China, October 2020 to January 2021.
Figure 2 shows the proportion of selected chronic diseases and behavioral factors at PAL. The proportion order for the three PALs was basically consistent, and the top three were poor sleep quality, hypertension, and dyslipidemia; the lowest one was chronic lung diseases (Figure 2).
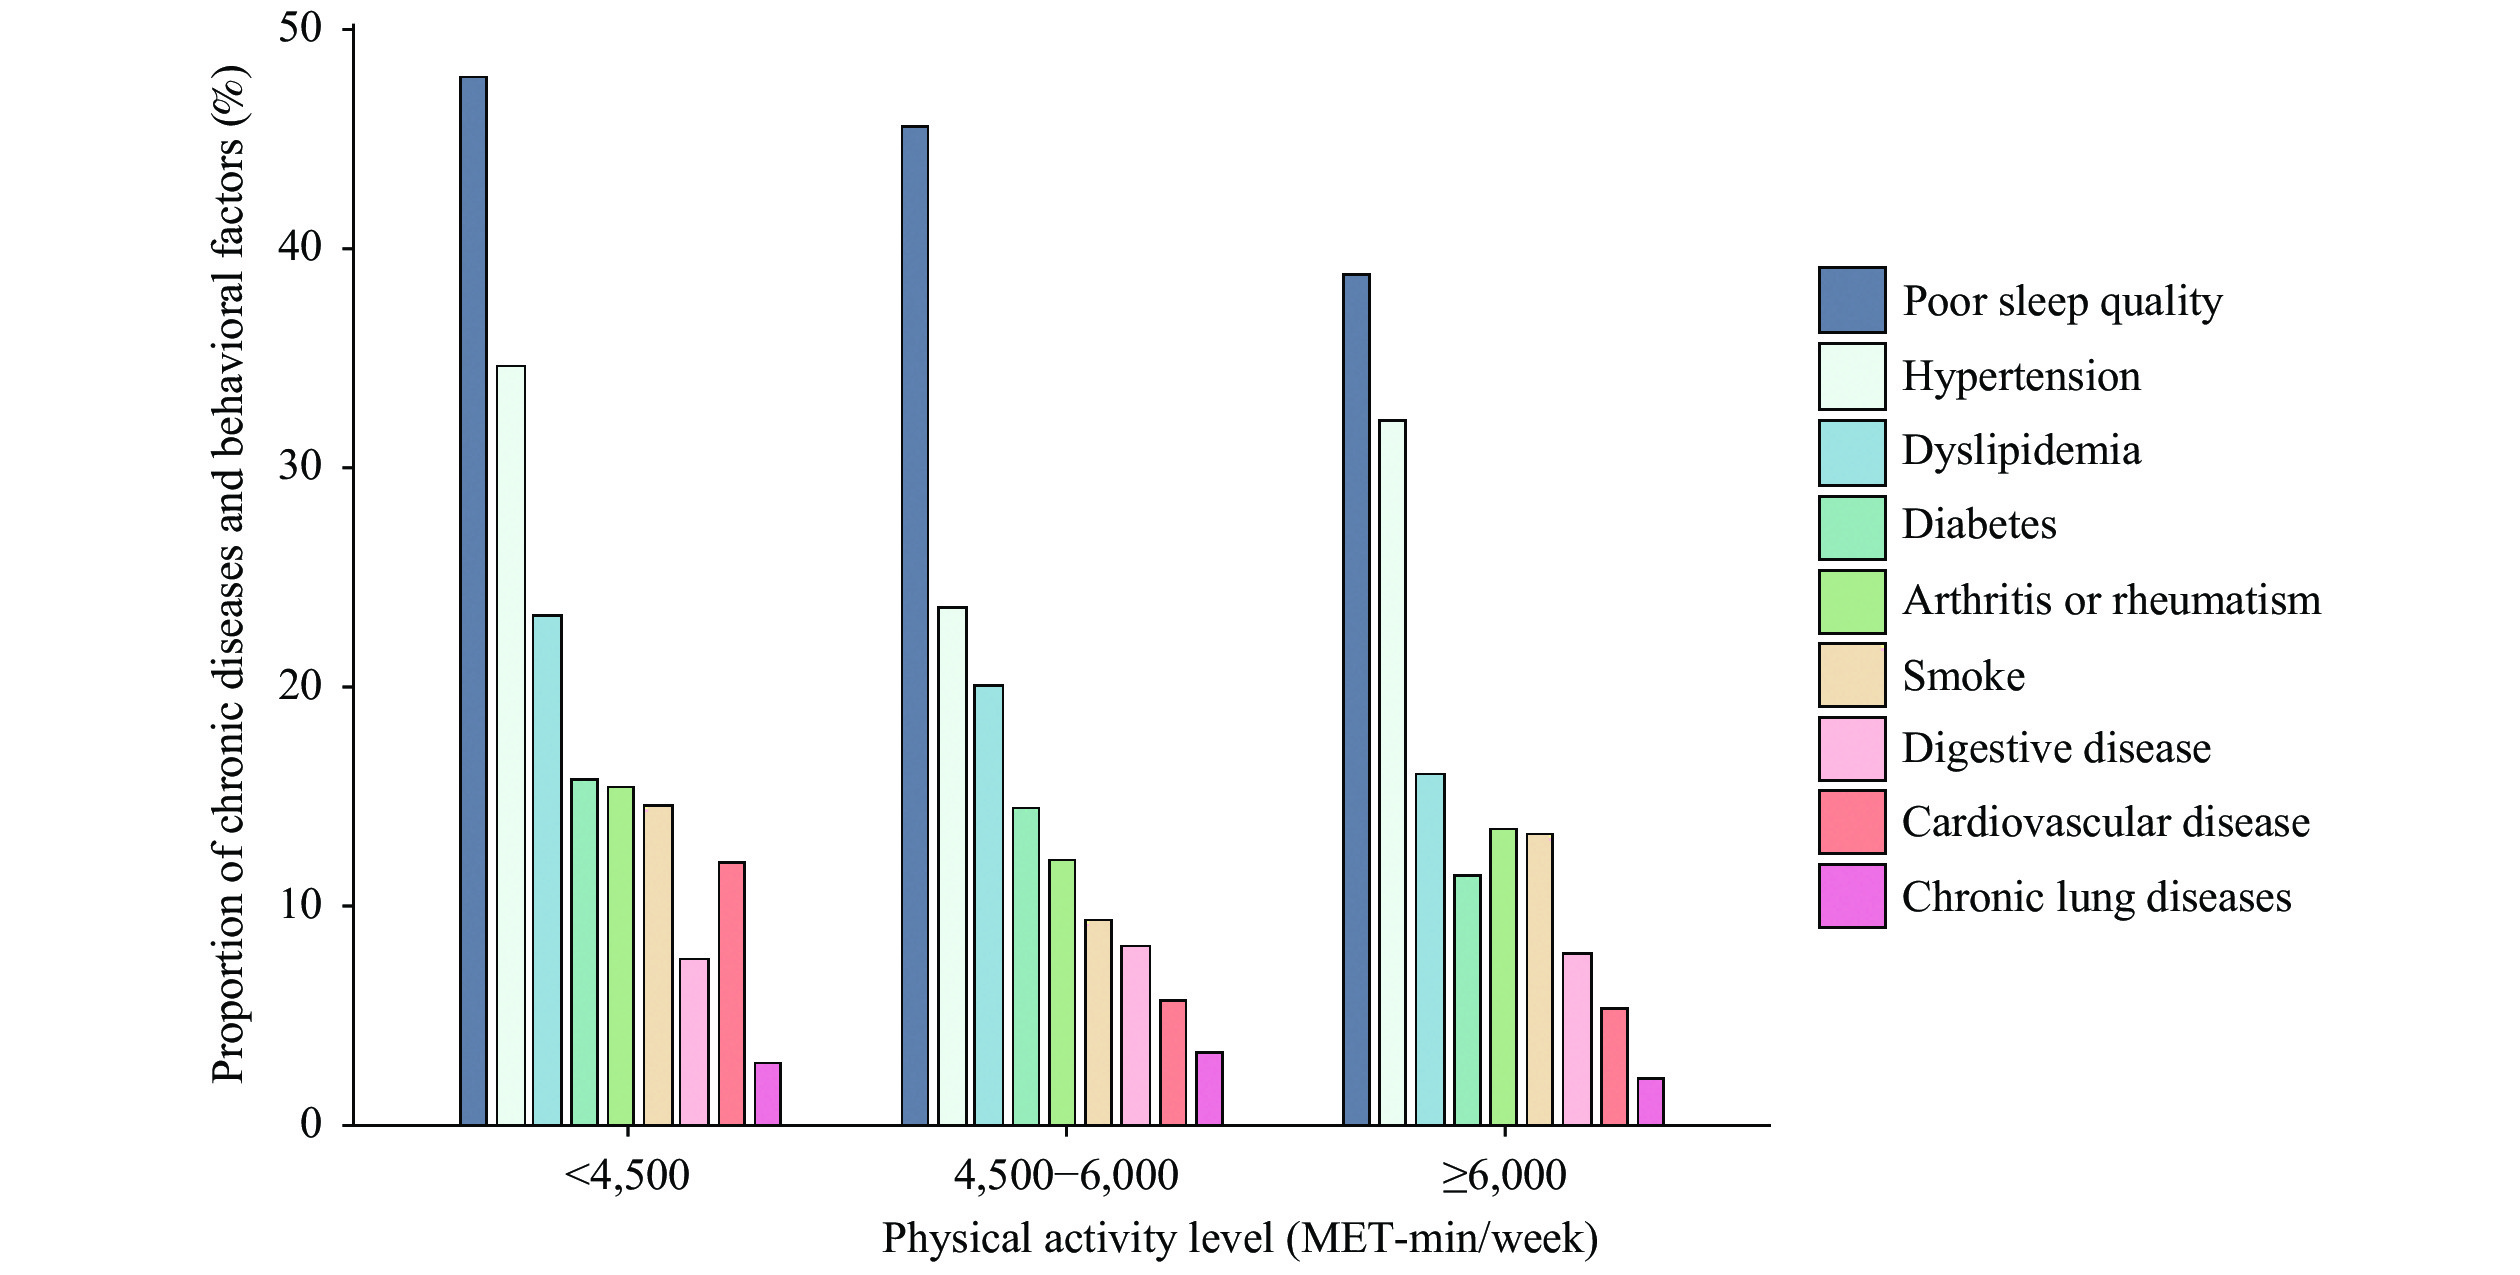 Figure 2.
Proportion of chronic diseases and behavioral factors at different physical activity levels among middle-aged and elderly population in Beijing, China, October 2020 to January 2021.
Table 2 shows the association of physical activity level and exposure factors by multivariate logistic regression analysis. The likelihood of moderate PAL was higher among participants aged ≥60 years (aOR: 1.65, 95% CI: 1.21–2.26), having a non-agriculture residence (aOR: 1.66, 95% CI: 1.03–2.73), and living with at least one child (aOR: 1.35, 95% CI: 1.00–1.80) in the multivariate logistic regression analysis. Moderate PAL was also associated with a reduced risk of hypertension (aOR: 0.58, 95% CI: 0.42–0.80) and cardiovascular disease (aOR: 0.43, 95% CI: 0.24–0.73), respectively.
Exposure factors aOR (95% CI) Forest plots Model 1 PAL 4,500–6,000 MET-min/week

Age (years) <60 1.00 ≥60 1.65 (1.21–2.26) Gender Male 1.00 Female 1.40 (0.96–2.07) Education level Junior high school or below 1.00 Senior high school 1.33 (0.92–1.93) College 0.98 (0.67–1.42) Registered residence Agricultural 1.00 Non-agricultural 1.66 (1.03–2.73) Living arrangement Not with child 1.00 With child 1.35 (1.00–1.80) Hypertension No 1.00 Yes 0.58 (0.42–0.80) Cardiovascular disease No 1.00 Yes 0.43 (0.24–0.73) Smoke No 1.00 Yes 0.84 (0.49–1.40) Exposure factors aOR (95% CI) Forest plots Model 2: ≥6,000 MET-min/week

Age (years) <60 1.00 ≥60 1.59 (1.19–2.12) Education level Junior high school or below 1.00 High school 2.06 (1.47–2.92) College 1.14 (0.81–1.60) Living arrangement Not with child 1.00 With child 1.43 (1.08–1.89) Dyslipidemia No 1.00 Yes 0.61 (0.42–0.88) Cardiovascular disease No 1.00 Yes 0.45 (0.26–0.76) Sleep quality Good sleep 1.00 Poor sleep 0.75 (0.57–0.99) Notes: aOR means Odd Ratio after adjusting for confounding factors.
Model 1: After adjusting for age, gender, education, registered residence, living arrangement, hypertension, cardiovascular disease, and smoking at PAL 4,500-6,000 MET-min/week.
Model 2: After adjusting for age, education, living arrangement, dyslipidemia, cardiovascular disease, and sleep quality.
Abbreviations: CI=confidence interval; PAL=physical activity level; MET=metabolic equivalents.Table 2. Association between physical activity levels and exposure factors by multivariate logistic regression analysis among middle-aged and elderly population in Beijing, China, October 2020 to January 2021.
Among those with a high PAL, the likelihood of the PAL was higher among participants aged ≥60 (aOR: 1.59, 95% CI: 1.19–2.12), education level of at least high school (aOR: 2.06, 95% CI: 1.47–2.92), and living with at least one child (aOR: 1.43, 95% CI: 1.08–1.89). This PAL was associated with a decreased risk of dyslipidemia, cardiovascular disease, and poor sleep, aOR (95% CI) was 0.61 (95% CI: 0.42–0.88), 0.45 (95% CI: 0.26–0.76), and 0.75 (95% CI: 0.57–0.99), respectively, indicating that low PAL may be relative to the increased risks of cardiovascular disease, hypertension, dyslipidemia, and poor sleep quality (Table 2).
-
The latest findings showed that participants with a low PAL accounted for 45.72%, those with moderate and above PA accounted for 54.28% among middle-aged and elderly population. The findings of multivariable logistic regression showed that the likelihood of moderate and high PAL was mainly among elderly population, indicating that the middle-aged population who may be at higher risk of low PAL in urban areas can also be a target population for chronic disease intervention. Moreover, the moderate PAL was associated with a decreased risk of hypertension and cardiovascular disease (CVD), the high PAL was related to a reduced risk of dyslipidemia, CVD, and poor sleep quality. On the contrary, above diseases and poor sleep quality may be an influencing factor for a low PAL. Our findings indicated that a certain PA intensity (≥4,500 MET-min/week) was associated with varying sociodemographic characteristics (age, education, and registered residence), living arrangements, and chronic diseases. Identifying the exposure factors serving as barriers or motivators in middle-aged and older adults’ physical activity could contribute to the development of intensity-specific health promotion interventions. These might become components of a comprehensive intervention measurement for preventing physical inactivity among community-dwelling middle-aged and elderly population in urban areas.
This finding of distribution characteristics was consistent with that in Shenzhen, indicating that the prevalence of physical inactivity in urban Chinese residents was high, especially in middle-aged adults where the prevalence was 45.79% (7). Those findings using a multivariable logistic regression were consistent with a large prospective study in China, in which higher occupational or nonoccupational physical activity was associated with significantly lower risks of major CVD among Chinese adults (8). Even for an elder age, maintaining a high PA level or increasing PA from low to high levels resulted in lower mortality risks (9). Leisure-time physical activity (LTPA) was decreased for those aged over 65 years or those with a history of cardiovascular disease. In addition, high-intensity LTPA had more obvious cardiovascular benefits than those of moderate-intensity leisure-time physical activity (10-11).
Previous studies have proposed various mechanisms to explain the health benefits of LTPA. In general, the protective effects of PA on the risks of CVD include adjustments to blood pressure, lipid levels, glucose tolerance, or body mass index (12-13).
This study was subject to limitations. First, the current study was cross-sectional, and the chronological sequence between exposure factors and physical activity was unclear; therefore, a causal relationship could not be established between the two. Further evidence is warranted using a prospective cohort or randomized controlled trial design to confirm the direction of the association. Second, self-reported chronic diseases may be subject to potential recall bias, especially for the elderly population.
However, this study had several strengths. It was a community-based study with a relatively representative sample, and multiple communities were selected as the study areas to provide diversity in sociodemographic features and physical activity level patterns to avoid selection bias. The trained investigators conducted the face-to-face CAPI which was performed to reduce the potential information bias in the survey. PA was measured using the IPAQ-L by metabolic equivalents to minimize the possible measurement error and misclassification bias. Sleep quality was evaluated by using the PSQI, with a superior sensitivity and specificity in distinguishing good and poor sleepers to reduce the potential measurement bias.
In conclusion, this study represents the most up-to-date data with a relatively large sample size and standardized method to explore the association between physical activity level and various sociodemographic factors and chronic diseases among middle-aged and elderly population in Beijing. The results suggested that more attention should be given to the middle-aged population who may be at high risk of physical inactivity in urban areas.
-
No conflicts of interest.
HTML
| Citation: |

|