

 Download:


-
Leisure-time physical activity (LTPA), which includes sports, fitness, and recreational activities, is well-documented as being able to reduce the burden of chronic disease, prevent early death, and improve health. About 83.8% of adults did not engage in LTPA, and regular LTPA was only reported by 11.9% of adults in China in 2010. In order to understand the latest status of LTPA in China, data from the China Chronic Disease and Nutrition Surveillance (CCDNS), a nationally and provincially representative cross-sectional survey, were analyzed, and the prevalence of LTPA and regular LTPA were determined based on face-to-face interviews with a Global Physical Activity Questionnaire (GPAQ). Key demographic and geographic factors were analyzed via Rao Scott chi-square tests and logistic regression models. This study showed that the prevalence of LTPA and regular LTPA increased from the past but remained at relatively low levels among adults in China. LTPA presented important socioeconomic and geographic inequality. More effort should be made to promote the implementation of the national fitness program, including the construction of public sports facilities, opening more sports venues, developing a variety of fitness activities and special sports items, and strengthening sports education in schools.
Physical activity is defined as any bodily movement produced by skeletal muscles that require energy expenditure (1). The Global Burden of Disease (GBD) study estimated that low levels of physical activity accounted for 1.3 million premature deaths and 2.4 million disability-adjusted life-years (DALYs) worldwide in 2017 (2). To achieve a target of 15% relative reduction in the global prevalence of physical inactivity in adults and in adolescents by 2030, the World Health Orgnization (WHO) has released the “Global action plan on physical activity 2018–2030: more active people for a healthier world” (3). A target of 435 million people regularly exercising by 2020 has also been included in Healthy China 2030 and a national fitness program was implemented in 2016 to improve the physical fitness and health level of the whole nation. Compared to other domains of physical activity, such as for work, for housework, and for transportation, LTPA was found to be better for preventing cardiovascular disease and protecting cognition (4). In China, 83.8% of adults reported no LTPA, and only 11.9% of adults aged 18 years old and above engaged in the regular LTPA in 2010 (5). It was reported that the age-standardized LTPA prevalence increased from 7.13% in 2000 to 11.79% in 2011 (6). While policy initiatives, environmental and financial support, and health education were taken to promote LTPA in China in recent years, little is known about the latest LTPA in China, particularly in rural areas and at the provincial level.
The prevalence of LTPA and regular LTPA among Chinese adults were estimated by using the data from China Chronic Disease and Nutrition Surveillance (CCDNS) in 2015. CCDNS is a periodical cross-sectional survey of major risk factors and major non-communicable and chronic diseases (NCDs), that was conducted in 298 districts/counties acting as surveillance sites across 31 provincial-level administration divisions (PLADs). The surveillance sites were selected randomly from over 2,400 districts/counties to be representative of the population nationwide as well as in every PLAD and specific regions, including urban and rural areas. A multi-stage, cluster-randomized sampling method was used to select respondents aged 18 years old and above within every district/county (7). Using a set of questionnaires, data on chronic-disease-related behaviors was collected by trained professionals from local CDCs. The information on moderate or vigorous physical activity (MVPA) participation in three domains (work, travel, and recreation) was collected by the Global Physical Activity Questionnaire (GPAQ) (8–9). LTPA was measured by asking participants whether they carried out vigorous or moderate LTPA at least 10 minutes continuously (yes/no), frequency of the activities (days per week), and time spent doing the activities in a typical day. In this study, LTPA was defined as participants engaging in any vigorous or moderate LTPA at least once a week. Regular LTPA was defined as carrying out moderate LTPA or an equivalent at least 30 minutes per day and 3 days or more per week.
In 2015, 189,605 participants from 88,250 households completed the survey, which yielded a 95.4% family response rate and 94.9% individual response rate. After excluding 1,675 participants with incomplete data (0.88%), a final sample of 187,930 participants was analyzed in this study. The study was approved by the Ethical Committee of the National Centre for Chronic and Non-Communicable Disease Control and Prevention, China CDC (Approval Notice: No.201519-A). All participants provided written informed consent.
All statistical analyses were weighted to represent both national and region-specific estimates (10). The weighted proportion for the characteristics of Chinese adults aged 18 years old and above was reported. Chi-square tests were used for comparisons among unordered categorical variables, whereas logistic regression models were used to examine the trend for ordered categorical variables. Taylor linearization methods with a finite population correction were used to estimate standard errors (SE) accounting for the complex sampling design. Statistical significance was determined as a two-sided p<0.05. All statistical analyses used software SAS (version 9.4, SAS Institute Inc., Cary, USA).
Among the 187,930 samples in this study, 88,231 men (46.9%) and 99,699 women (53.1%) were included. In 2015, the prevalence of LTPA among adult residents aged 18 years old and above in China was overall 19.7% (95% confidence interval [CI] : 17.9%–21.4%), in males 22.0% (95% CI: 19.9%–24.1%), and in females 17.3% (95% CI: 15.9%–18.8%). The prevalence of LTPA among residents in urban areas was significantly higher than that in rural areas (28.0% vs. 13.8%, p<0.0001), and the prevalence of LTPA among residents in eastern areas (24.7%, 95% CI: 21.6%–27.9%) was significantly higher than other areas. The current prevalence of LTPA differed greatly between men and women in terms of different education levels, family income levels, and occupations. The prevalence of LTPA increased with education level and household income but decreased with age for both men and women (p<0.0001). According to the analysis of different occupations, the prevalence of LTPA (33.7%, 95% CI: 31.3%–36.0%) among office/shop/other non-manual workers was the highest, and the prevalence of LTPA among farming-related workers (10.6%, 95% CI: 9.7%–11.4%) was the lowest. In 2015, the prevalence of regular LTPA among adult residents aged 18 years old and above in China was overall 12.5% (95% CI: 11.4%–13.5%), in males 13.3% (95% CI: 12.1%–14.6%), and in females 11.6% (95% CI: 10.7%–12.5%). Similar to the prevalence of LTPA among residents, the prevalence of regular LTPA differed greatly between men and women in different residences, geographic locations, education levels, household income, and occupations. (Table 1)
Items Overall Men Women N Prevalence/% (95% CI) N Prevalence/% (95% CI) N Prevalence/% (95% CI) LTPA Regular LTPA LTPA Regular LTPA LTPA Regular LTPA Total 187,930 19.7
(17.9−21.4)12.5
(11.4−13.5)88,231 22.0
(19.9−24.1)13.3
(12.1−14.6)99,699 17.3
(15.9−18.8)11.6
(10.7−12.5)Age 18−24 years 6,610 26.6
(24.0−29.3)14.0
(12.3−15.6)3,189 31.7
(28.6−34.8)17.5
(14.7−20.4)3,421 21.3
(18.6−24.1)10.2
(8.6−11.8)25−34 years 21,429 20.7
(18.1−23.4)11.3
(10.1−12.5)9,367 26.1
(22.1−30.2)13.9
(12.2−15.6)12,062 15.2
(13.6−16.7)8.6
(7.7−9.6)35−44 years 29,870 20.3
(18.2−22.5)12.8
(11.3−14.2)13,749 22.1
(19.6−24.6)12.8
(11.2−14.4)16,121 18.5
(16.6−20.4)12.8
(11.3−14.3)45−54 years 47,936 18.5
(17.0−20.0)13.2
(12.0−14.3)21,698 18.2
(16.5−19.9)12.1
(10.9−13.4)26,238 18.8
(17.4−20.3)14.2
(13.0−15.4)55−64 years 45,053 16.4
(15.1−17.6)12.8
(11.8−13.8)21,370 16.1
(14.7−17.4)12.0
(10.9−13.1)23,683 16.7
(15.3−18.1)13.5
(12.3−14.7)≥70 years 37,032 12.9
(11.8−14.0)10.3
(9.3−11.3)18,858 13.9
(12.7−15.1)11.0
(10.0−12.1)18,174 12.0
(10.8−13.2)9.6
(8.4−10.7)p value for trend <0.0001 0.0389 <0.0001 <0.0001 <0.0001 0.0007 Residence Urban 76,521 28.0
(24.9−31.1)18.1
(16.3−19.9)34,686 31.2
(27.5−34.9)19.5
(17.3−21.7)41,835 24.7
(22.2−27.2)16.6
(15.2−18.1)Rural 111,409 13.8
(12.5−15.1)8.5
(7.7−9.3)53,545 15.4
(13.8−17.0)8.9
(7.9−10.0)57,864 12.2
(11.0−13.3)8.0
(7.3−8.8)p value for difference <0.0001 <0.0001 <0.0001 <0.0001 <0.0001 <0.0001 Geographic location East 70,133 24.7
(21.6−27.9)15.8
(14.0−17.6)32,783 28.1
(24.2−31.9)17.6
(15.3−19.9)37,350 21.3
(18.7−23.9)14.0
(12.5−15.5)Central 53,214 16.1
(14.3−18.0)10.2
(9.1−11.4)25,044 17.9
(15.8−20.0)10.5
(9.3−11.8)28,170 14.4
(12.6−16.2)9.9
(8.7−11.1)West 64,583 15.7
(14.0−17.4)9.7
(8.5−10.8)30,404 16.9
(15.0−18.7)9.7
(8.4−10.9)34,179 14.5
(12.8−16.2)9.7
(8.6−10.8)p value for difference <0.0001 <0.0001 <0.0001 <0.0001 <0.0001 <0.0001 Education Primary or less 92,013 9.8
(9.0−10.6)6.8
(6.2−7.4)36,634 9.3
(8.5−10.1)6.0
(5.4−6.5)55,379 10.2
(9.3−11.1)7.4
(6.7−8.2)Junior high 57,434 16.9
(15.4−18.4)10.6
(9.6−11.6)31,321 17.2
(15.7−18.6)10.0
(9.1−10.9)26,113 16.5
(14.7−18.4)11.3
(9.8−12.8)Senior high 24,334 28.7
(25.9−31.4)18.1
(16.5−19.6)13,379 31.4
(27.2−35.6)19.3
(16.6−22.1)10,955 24.8
(23.0−26.6)16.3
(15.1−17.4)College or above 14,149 38.8
(36.4−41.1)23.4
(21.8−25.1)6,897 45.4
(42.5−48.3)27.4
(25.2−29.6)7,252 31.7
(29.1−34.4)19.2
(17.4−21.0)p value for trend <0.0001 <0.0001 <0.0001 <0.0001 <0.0001 <0.0001 Household income per capita, CNY Q1(<6,667) 40,567 11.7
(10.6−12.8)7.1
(6.4−7.8)19,738 12.6
(11.4−13.8)7.4
(6.5−8.2)20,829 10.9
(9.4−12.3)6.8
(5.9−7.6)Q2(6,667−13,332) 37,494 15.6
(14.4−16.8)9.1
(8.2−9.9)17,742 17.0
(15.4−18.5)9.1
(8.0−10.3)19,752 14.2
(12.8−15.7)9.0
(8.0−10.0)Q3(13,333−27,999) 40,398 20.9
(19.0−22.8)13.5
(12.2−14.8)18,750 22.9
(20.4−25.4)14.1
(12.4−15.8)21,648 18.8
(17.3−20.3)12.9
(11.8−14.0)Q4(28,000+) 37,617 29.1
(26.7−31.5)19.3
(17.8−20.7)17,376 33.0
(30.2−35.8)21.4
(19.4−23.4)20,241 25.0
(22.9−27.2)17.0
(15.8−18.2)Don’t know or refused 31,854 17.4
(14.9−19.9)10.7
(9.2−12.2)14,625 20.1
(16.8−23.3)11.4
(9.7−13.2)17,229 14.8
(12.6−17.0)10.0
(8.5−11.6)p value for trend <0.0001 <0.0001 <0.0001 <0.0001 <0.0001 <0.0001 Occupation Office/shop/other non−manual 27,281 33.7
(31.3−36.0)20.2
(19.0−21.3)14,216 37.4
(34.7−40.2)22.5
(20.9−24.0)13,065 29.0
(26.9−31.2)17.3
(16.2−18.5)Factory and construction manual 24,343 20.8
(17.7−23.8)12.4
(10.1−14.6)15,227 22.5
(19.1−26.0)13.0
(10.3−15.6)9,116 16.9
(14.3−19.6)11.1
(9.3−12.9)Farming related 84,883 10.6
(9.7−11.4)6.6
(6.1−7.1)42,288 10.7
(9.8−11.6)6.1
(5.6−6.5)42,595 10.4
(9.5−11.4)7.1
(6.4−7.8)Retired 17,103 29.8
(27.8−31.8)25.7
(23.9−27.5)7,877 29.4
(27.0−31.9)25.2
(23.0−27.4)9,226 30.1
(27.9−32.3)26.2
(24.3−28.1)Not working 34,320 13.8
(12.5−15.2)9.3
(8.2−10.4)8,623 14.8
(12.9−16.8)9.1
(7.6−10.5)25,697 13.4
(11.9−15.0)9.3
(8.1−10.6)p value for difference <0.0001 <0.0001 <0.0001 <0.0001 <0.0001 <0.0001 Abreviation: LTPA=leisure-time physical activity.
* Table presented weighted prevalence, which represents the national total population.Table 1. Prevalence of LTPA and regular LTPA among Chinese adults aged 18 years old and above at the provincial level in China in 2015*.
Figure 1 and Figure 2 showed the current provincial geographic distribution of the prevalence of LTPA and regular LTPA, respectively, among adult residents aged 18 and above in China. Figure 1 showed that in 2015, the prevalence of LTPA exceeded 25% in 7 PLADs and was highest in Beijing (44.1%). The prevalence of LTPA in 6 PLADs was less than 14.9%. In Figure 2, the prevalence of regular LTPA in Beijing, Shanghai, Qinghai, Guangdong, Jiangsu, Fujian, and Shandong exceeded 15%, while the prevalence of regular LTPA in Hainan, Sichuan, Chongqing, Hunan, Guizhou, and Xizang (Tibet) Autonomous Region was less than 9.3%.
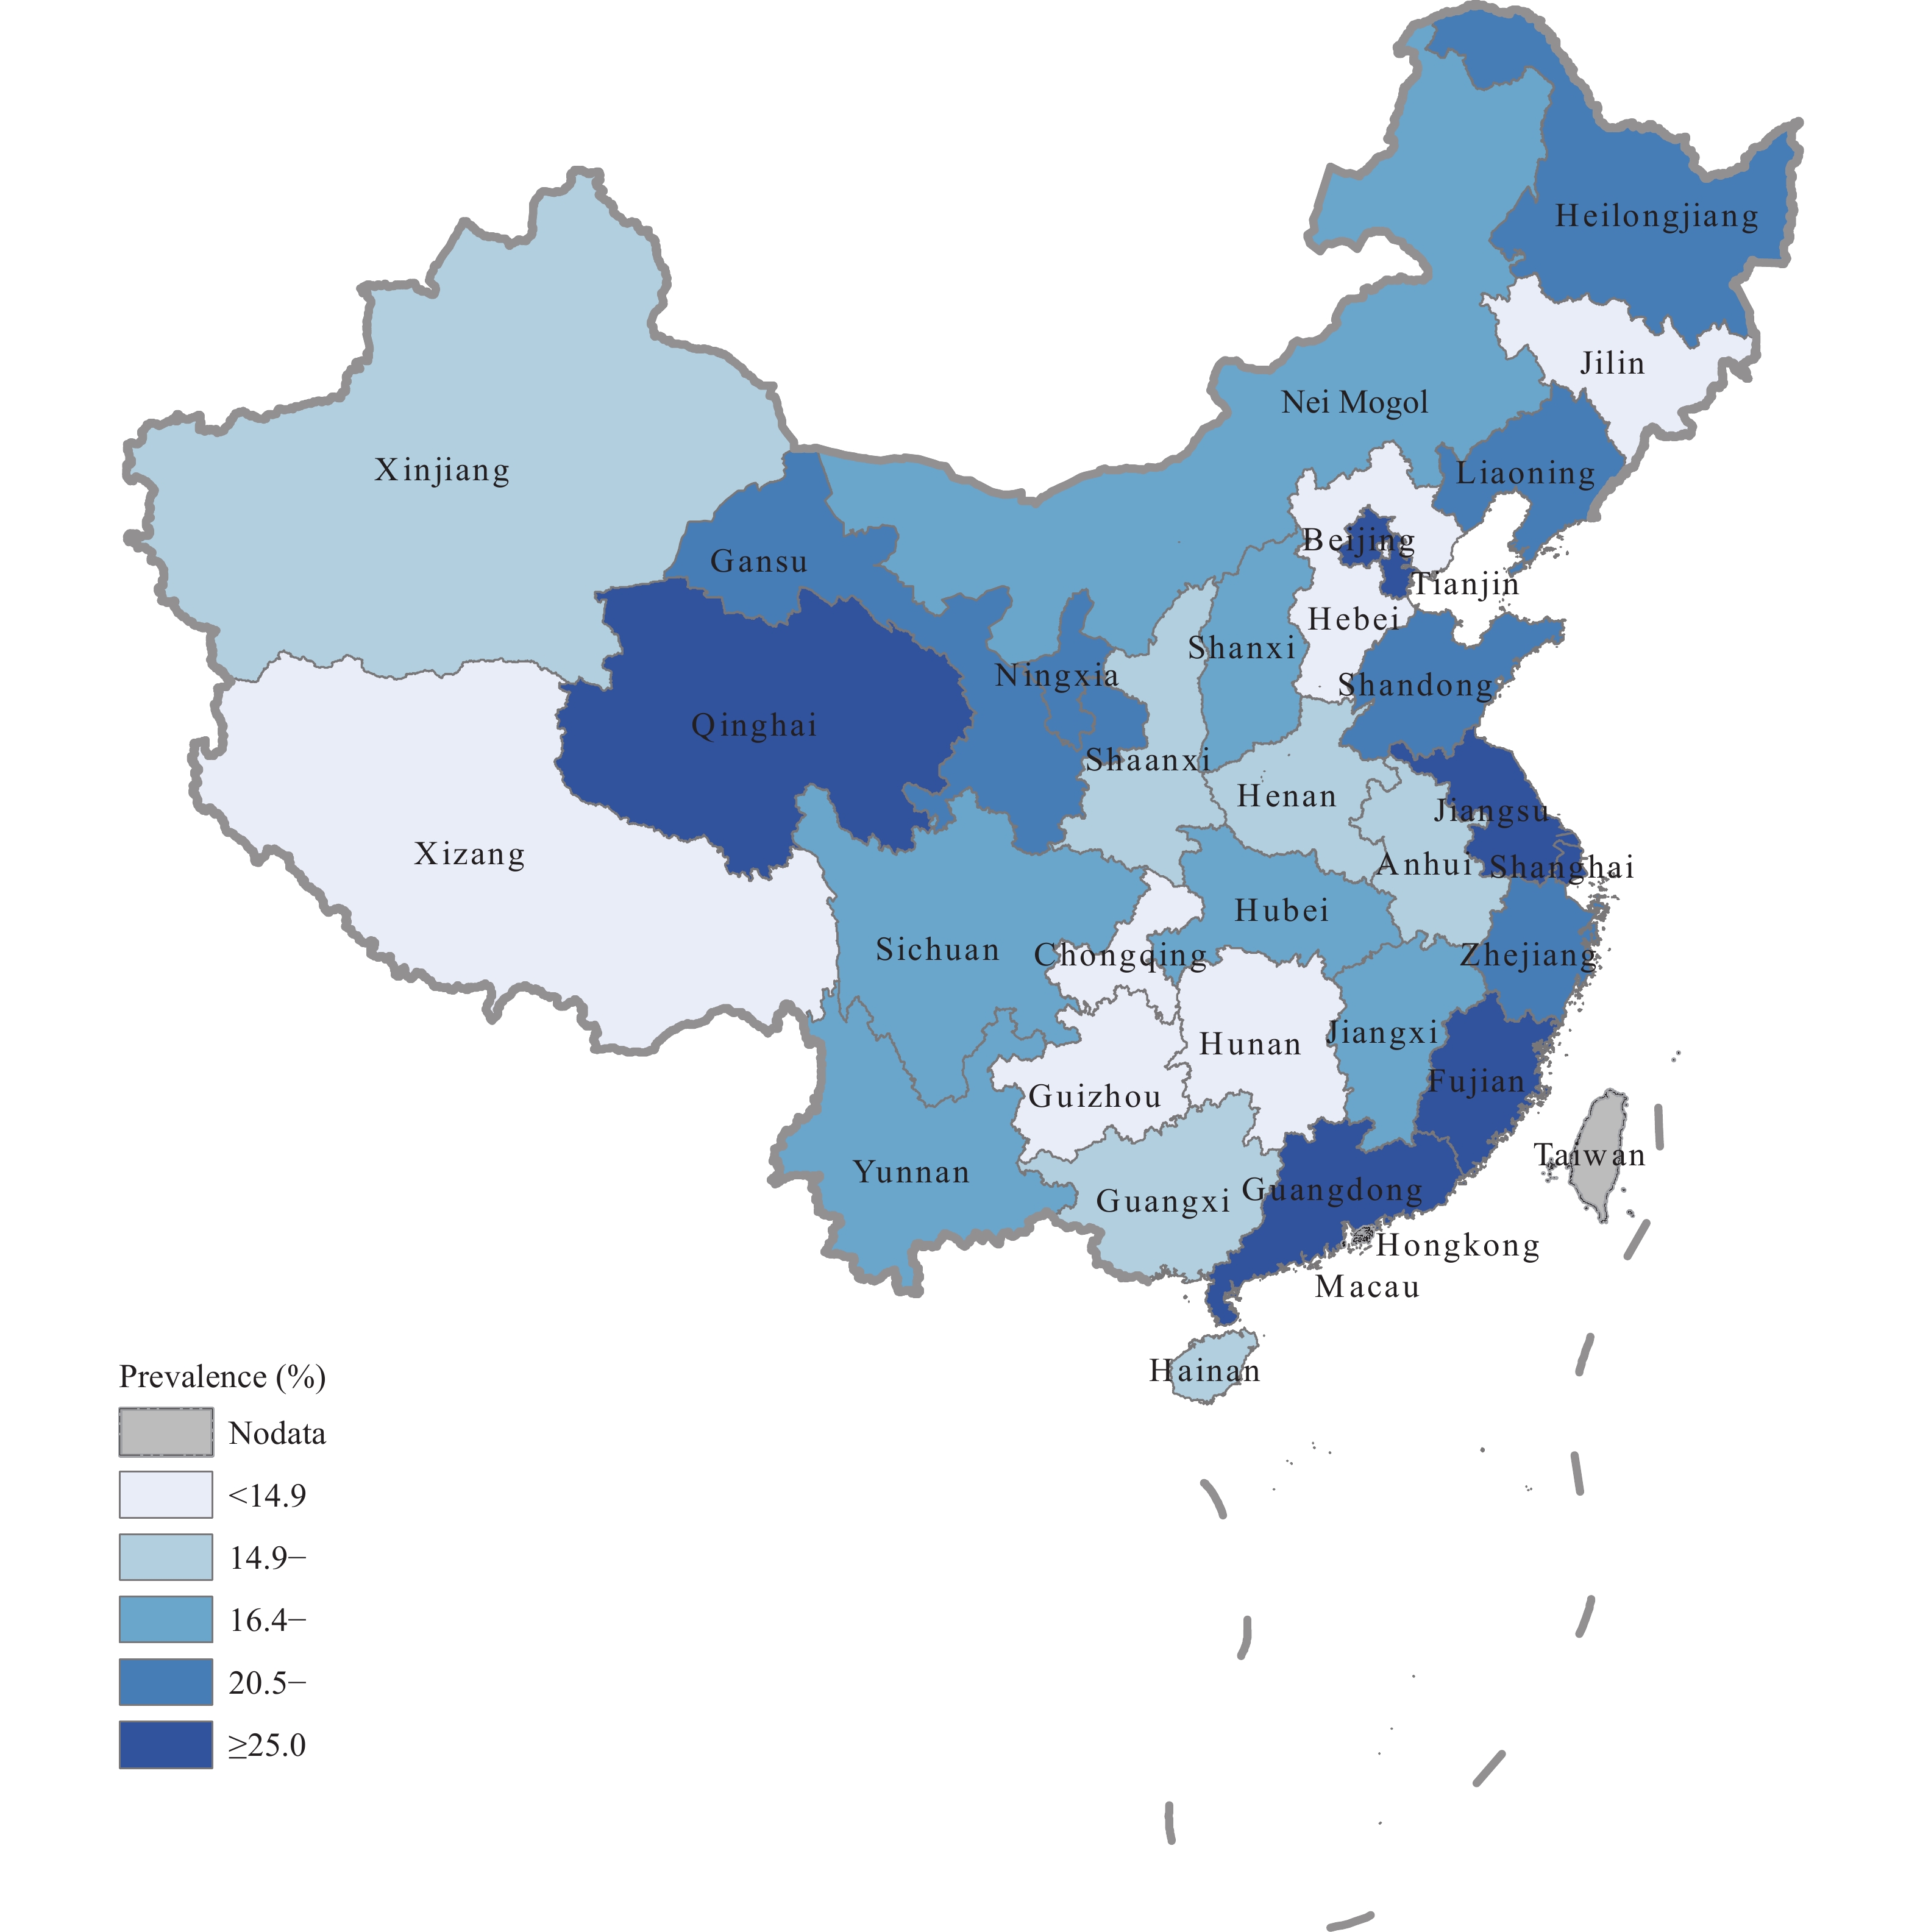 Figure 1.
Age-standardized prevalence of leisure-time physical activity (LTPA) among adults at the provincial level in China in 2015.
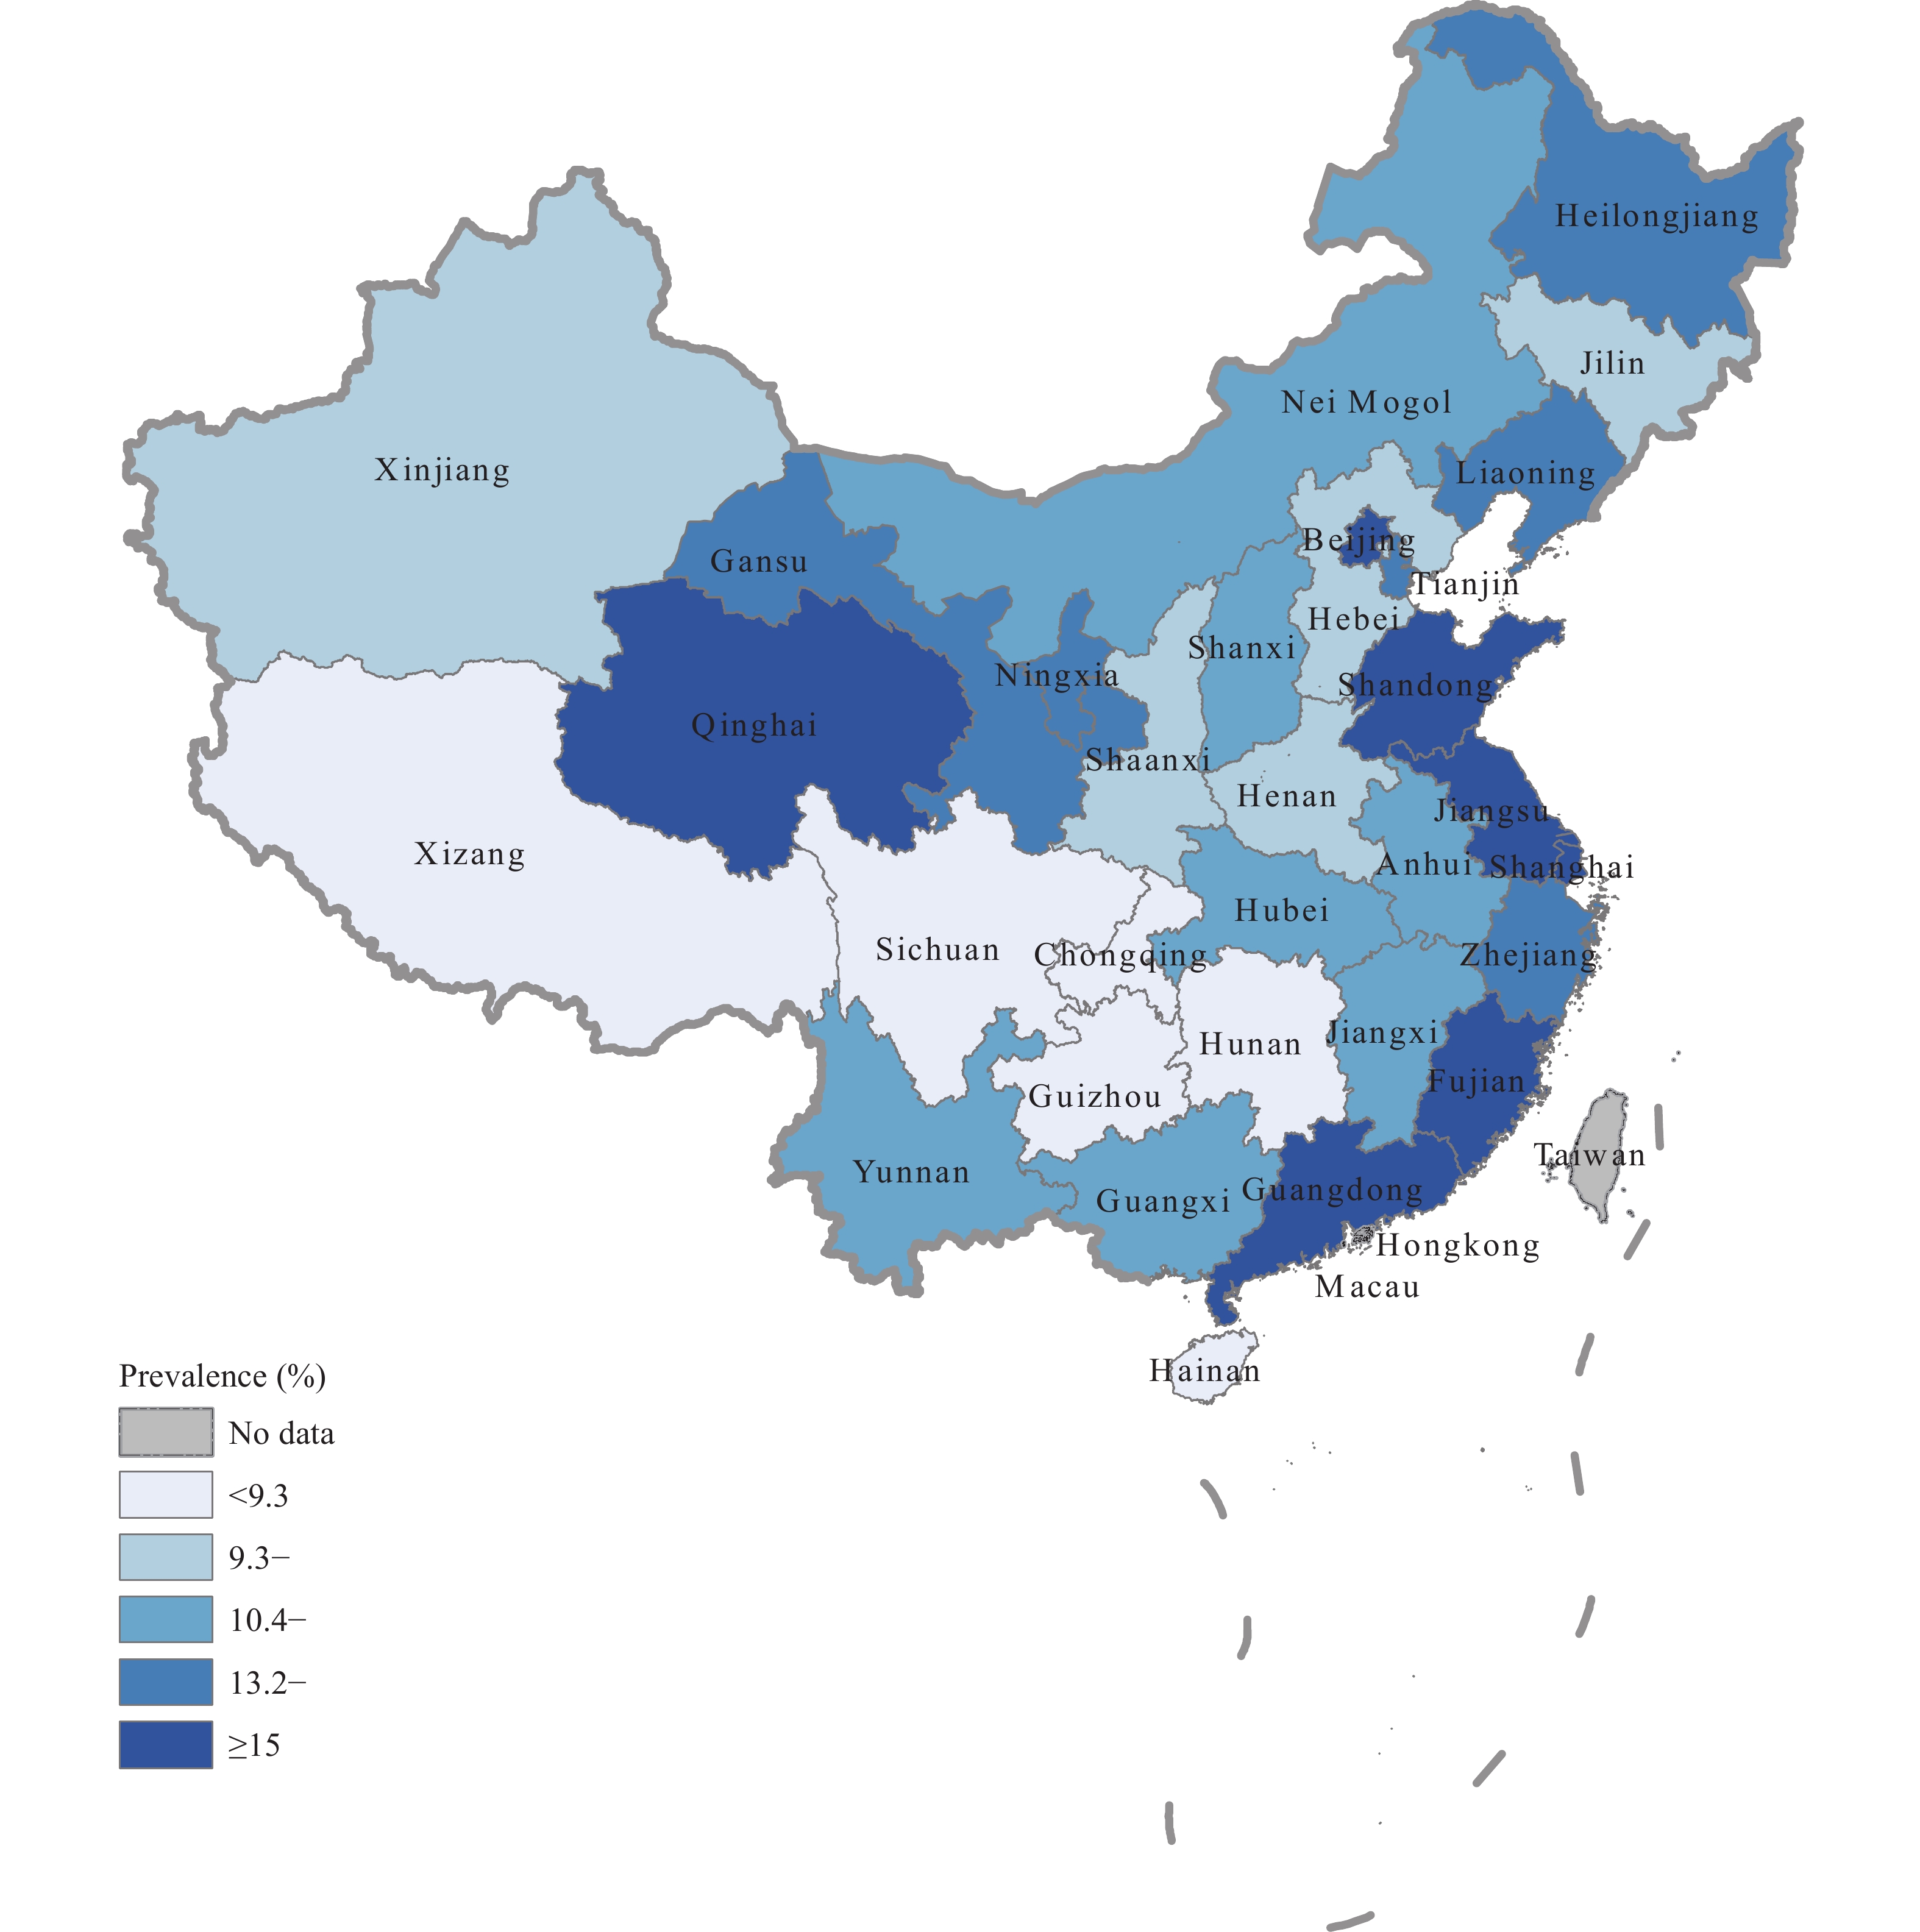 Figure 2.
Age-standardized prevalence of regular leisure-time physical activity (LTPA) among adults at the provincial level in China in 2015.
HTML
-
This study showed that the prevalence of LTPA (19.7%) and regular LTPA (12.5%) remained low in China. The male adults or adults who were living in urban areas, living in eastern China, had better education, had higher income, and doing non-manual work or retired were more likely to be physically active in their leisure time than their counterparts.
The prevalence of regular LTPA was found to increase slightly from 11.9% in 2010 to 12.5% in 2015. However, the criteria of regular LTPA in the previous study was at least 10 minutes per day and at least 3 days per week, which was less strict the criteria in this study so the estimated prevalence in 2010 would likely be lower than 11.9%. The current prevalence of regular LTPA was far below the prevalence of 46.7% in adults in the United States (11). The gap between urban and rural areas still existed but has narrowed from 11.7% in 2010 to 9.6% in 2015. The main reason might be attributable to the increasing investment in sports facilities in rural areas in recent years. In addition, the prevalence of LTPA and regular LTPA were also lower in undeveloped western regions, compared to central and eastern China.
A previously reported study showed different prevalence of LTPA than that reported in this study (6). However, the questionnaire used in that study differed from the questionnaire used in this study in the design of questions about LTPA. These differences could be explained due to the questionnaire in this study covering a wider range of LTPA.
Our study showed a positive association between socioeconomic position (SEP) and LTPA, which was consistent with the previous studies (12). With an increase of education or income level, people were more likely to be physically active in their leisure time. Also, no-manual workers were more physically active in leisure time than manual workers. Adults with higher SEP were considered to have a better knowledge about the benefit of PA, or have more financial possibilities to participate in LTPA. Furthermore, manual workers, most of whom also might have lower SEP, generally engaged in more occupational PA. A study had shown that fatigue after work was a barrier of LTPA (13).
The comparative estimates of provincial LTPA among all 31 PLADs in China were shown for the first time in our study. The provincial variations in the prevalence of LTPA and regular LTPA were identified, which indicated the potential impacts of geographical feature, leisure life customs, and socioeconomic development. Beijing, as the only host city for the Olympic Games in China, had the highest prevalence of both LTPA and regular LTPA and was 10% more than Shanghai, which ranked second. The lowest LTPA among adults in Xizang (Tibet) Autonomous Region was probably due to the high-altitude hypoxic environment.
According to Healthy China 2030 issued by the State Council in 2016, 435 million people (>30% of the whole population) and 530 million people (>40% of the whole population) are expected to do physical exercise regularly by 2020 and 2030, respectively. However, based on our study, with approximately 1.09 billion adults in total in the mainland of China, it was projected that only less than 150 million adults were involved in regular LTPA in 2015. So it seems to be difficult to reach the goal by 2020. Thus, to achieve the goal in 2030, more effort should be made to promote the implementation of the national fitness program.
This study was subject to at least one limitation. The individual history of physical activity was based on self-reporting. Some participants might have difficulty distinguishing between low-intensity activities and moderate-intensity activities as well as accurately recalling specific amounts of activity. This recall bias and difficulty interpreting the questions might have resulted in a slight overestimation of LTPA in Chinese adults.
In conclusion, this study provides an updated assessment as of 2015 of the largest nationwide and population-based self-reported status of LTPA in China. The prevalence of LTPA and regular LTPA had increased from the past but were still at a low level. To promote more people, especially those with lower socioeconomic status, to participate in LTPA, great effort are required to strengthen national and local policy initiatives, financial support, sports facilities construction, and health education, especially in rural areas and in western China.
| Citation: |

|