
 Download:


-
Coronavirus disease 2019 (COVID-19) is an emerging infectious disease, and the ongoing quick spread of COVID-19 cases has become a global pandemic (1). Detecting serum-specific antibodies has become one of the key approaches for the identification of COVID-19 virus infection. However, the interpretation of antibody detection largely depends on understanding host antibody responses during infection, but the profiles of the antibody responses and the relationship between IgM, IgA, IgG, and the neutralizing antibodies (NAb) among COVID-19 patients with different disease severity is not yet clearly understood. Therefore, the purpose of this study was to supplement the knowledge regarding the human immune response to COVID-19 virus infection.
In this study, the confirmed COVID-19 patients by real-time reverse transcription polymerase chain reaction (real-time RT-PCR) were included. A total of 210 sera were collected from 160 COVID-19 patients based on varying course of disease in Gansu and Heilongjiang provinces of China during January to March in 2020. The age of the cases ranged between 1–98 years (median age: 46 years). The sampling time of all the sera ranged from 0 to 64 days after onset of illness (median days: 28 days). According to disease classifications outlined in the “Guidelines on the Novel Coronavirus-Infected Pneumonia Diagnosis and Treatment (Seventh Edition)” issued by the National Health Commission of China (NHC), the majority of the COVID-19 cases (76.7%) belonged to the mild (39 cases/45 samples) and moderate (83 cases/109 samples) categories, and the remainder were classified as either severe (34 cases/52 samples) or critical (4 cases/4 samples); 81% of the severe and critical cases were older than 40 years old.
After the sera were inactivated at 56 °C for 30 minutes, the IgM, IgA, and IgG antibodies against COVID-19 virus were detected by using a commercial magnetic chemiluminescence enzyme immunoassay (MCLIA) kit (Bioscience, China) (2). The luminescence value of each sample was positively correlated with the antibody concentration to evaluate the level of IgM/IgA/IgG antibodies against COVID-19 virus in the serum samples. NAb was evaluated using the microneutralization assay (3). Antibody titers greater than or equal to 1∶8 indicated a positive result in this study. To calculate the geometric mean titer (GMT), antibody titers of <1∶8 and >1∶256 were assigned as 1∶4 and 1∶256, respectively, and the 95% confidence interval (95% CI) was calculated. The median and interquartile range (IQR) were used for statistical analysis of IgM/IgA/IgG/NAb levels. The Kruskal-Wallis test and Pearson chi-square test were used to test the differences among groups, including age, days after onset of disease, and clinical classification by using R software (version 3.5.2, Lucent Technologies, FL, USA). A p-value less than 0.05 was considered statistically significant.
The dynamics analysis for four types of antibodies showed that the positive rate of IgM/IgA was slightly higher than that of IgG/NAb within the first two weeks after onset. The positive rate of the 4 antibodies successively reached 100% after two weeks. The dynamics of positive rates of IgM and IgA was generally consistent reaching 44.4% and 38.9%, respectively, within 4–7 days followed by a peak after 2 weeks. The positive rate between IgG and NAb was consistent throughout the course of the disease, except for the 6th week, when the positive rate was 81.8% and 95.5% for NAb and IgG, respectively. The low positive rate of NAb in the 6th week might be associated with the low level of IgG in three cases with negative NAb (Table 1). The levels of IgM/IgA/IgG/NAb were also analyzed based on days after onset. All antibodies could be detected at low levels within 0–3 days. The levels of the 4 antibodies were similar within 2 weeks, followed by a rapid increase and the maintenance of a high level from the 3rd and 4th weeks. Similar to the positive rate, the levels of IgM and IgA were consistent throughout the course of the disease. In contrast, the NAb antibody rapidly decreased from a GMT of 1∶62 during the 5th week to 1∶31 by the 9th week, while IgG remained at a relatively stable level (Figure 1).
Days after onset No. of samples IgA IgM IgG Neutralization antibody No. of positive samples Detection rate (%) No. of positive samples Detection rate (%) No. of positive samples Detection rate (%) No. of positive samples Detection rate (%) 0–3 26 7 26.9 10 38.5 5 19.2 4 15.4 4–7 18 7 38.9 8 44.4 6 33.3 7 38.9 8–14 13 8 61.5 8 61.5 6 46.2 6 46.2 15–21 21 20 95.2 21 100.0 20 95.2 20 95.2 22–28 27 25 92.6 27 100.0 27 100.0 26 96.3 29–35 33 33 100.0 30 90.9 31 93.9 31 93.9 36–42 22 20 90.9 22 100.0 21 95.5 18 81.8 43–64 50 48 96.0 45 90.9 50 100.0 47 94.0 Total 210 168 80.0 171 81.4 166 79.0 159 75.7 Table 1. The positive detection rate of antibodies against COVID-19 Virus in different course of disease.
 Figure 1.
The changes in levels of antibodies, including IgM, IgA, IgG, and NAb, against COVID-19 virus after symptom onset. COVID-19 patients from the cross-sectional cohort were grouped based on days after disease onset (0–3 days, 4–7 days, 8–14 days, 15–21 days, 22–28 days, 29–35 days, 36–42 days, 43–64 days). The left Y-axis indicated the S/CO values of the IgM, IgA, and IgG antibodies converted by Log2(S/CO+1), and the antibody levels of all the groups were shown with the median values. The right Y-axis indicated the geometric mean titer (GMT) level of the neutralizing antibody.
All 160 cases in this study were divided into 3 age groups: 1–39 years, 40–59 years, and ≥60 years. Due to the limited number of cases aged 1–19 years, all cases younger than 40-year-old were classified into 1 group for statistical analysis in this study. The levels of IgA, IgG, and NAb antibodies showed significant differences among the 3 age groups between the 3rd and 4th weeks (p<0.05), and the level of IgM and NAb showed significant differences among 3 age groups between the 5th and 9th weeks (p<0.05). No obvious differences were observed for all four types of antibodies among different age groups within two weeks after onset (Figure 2).
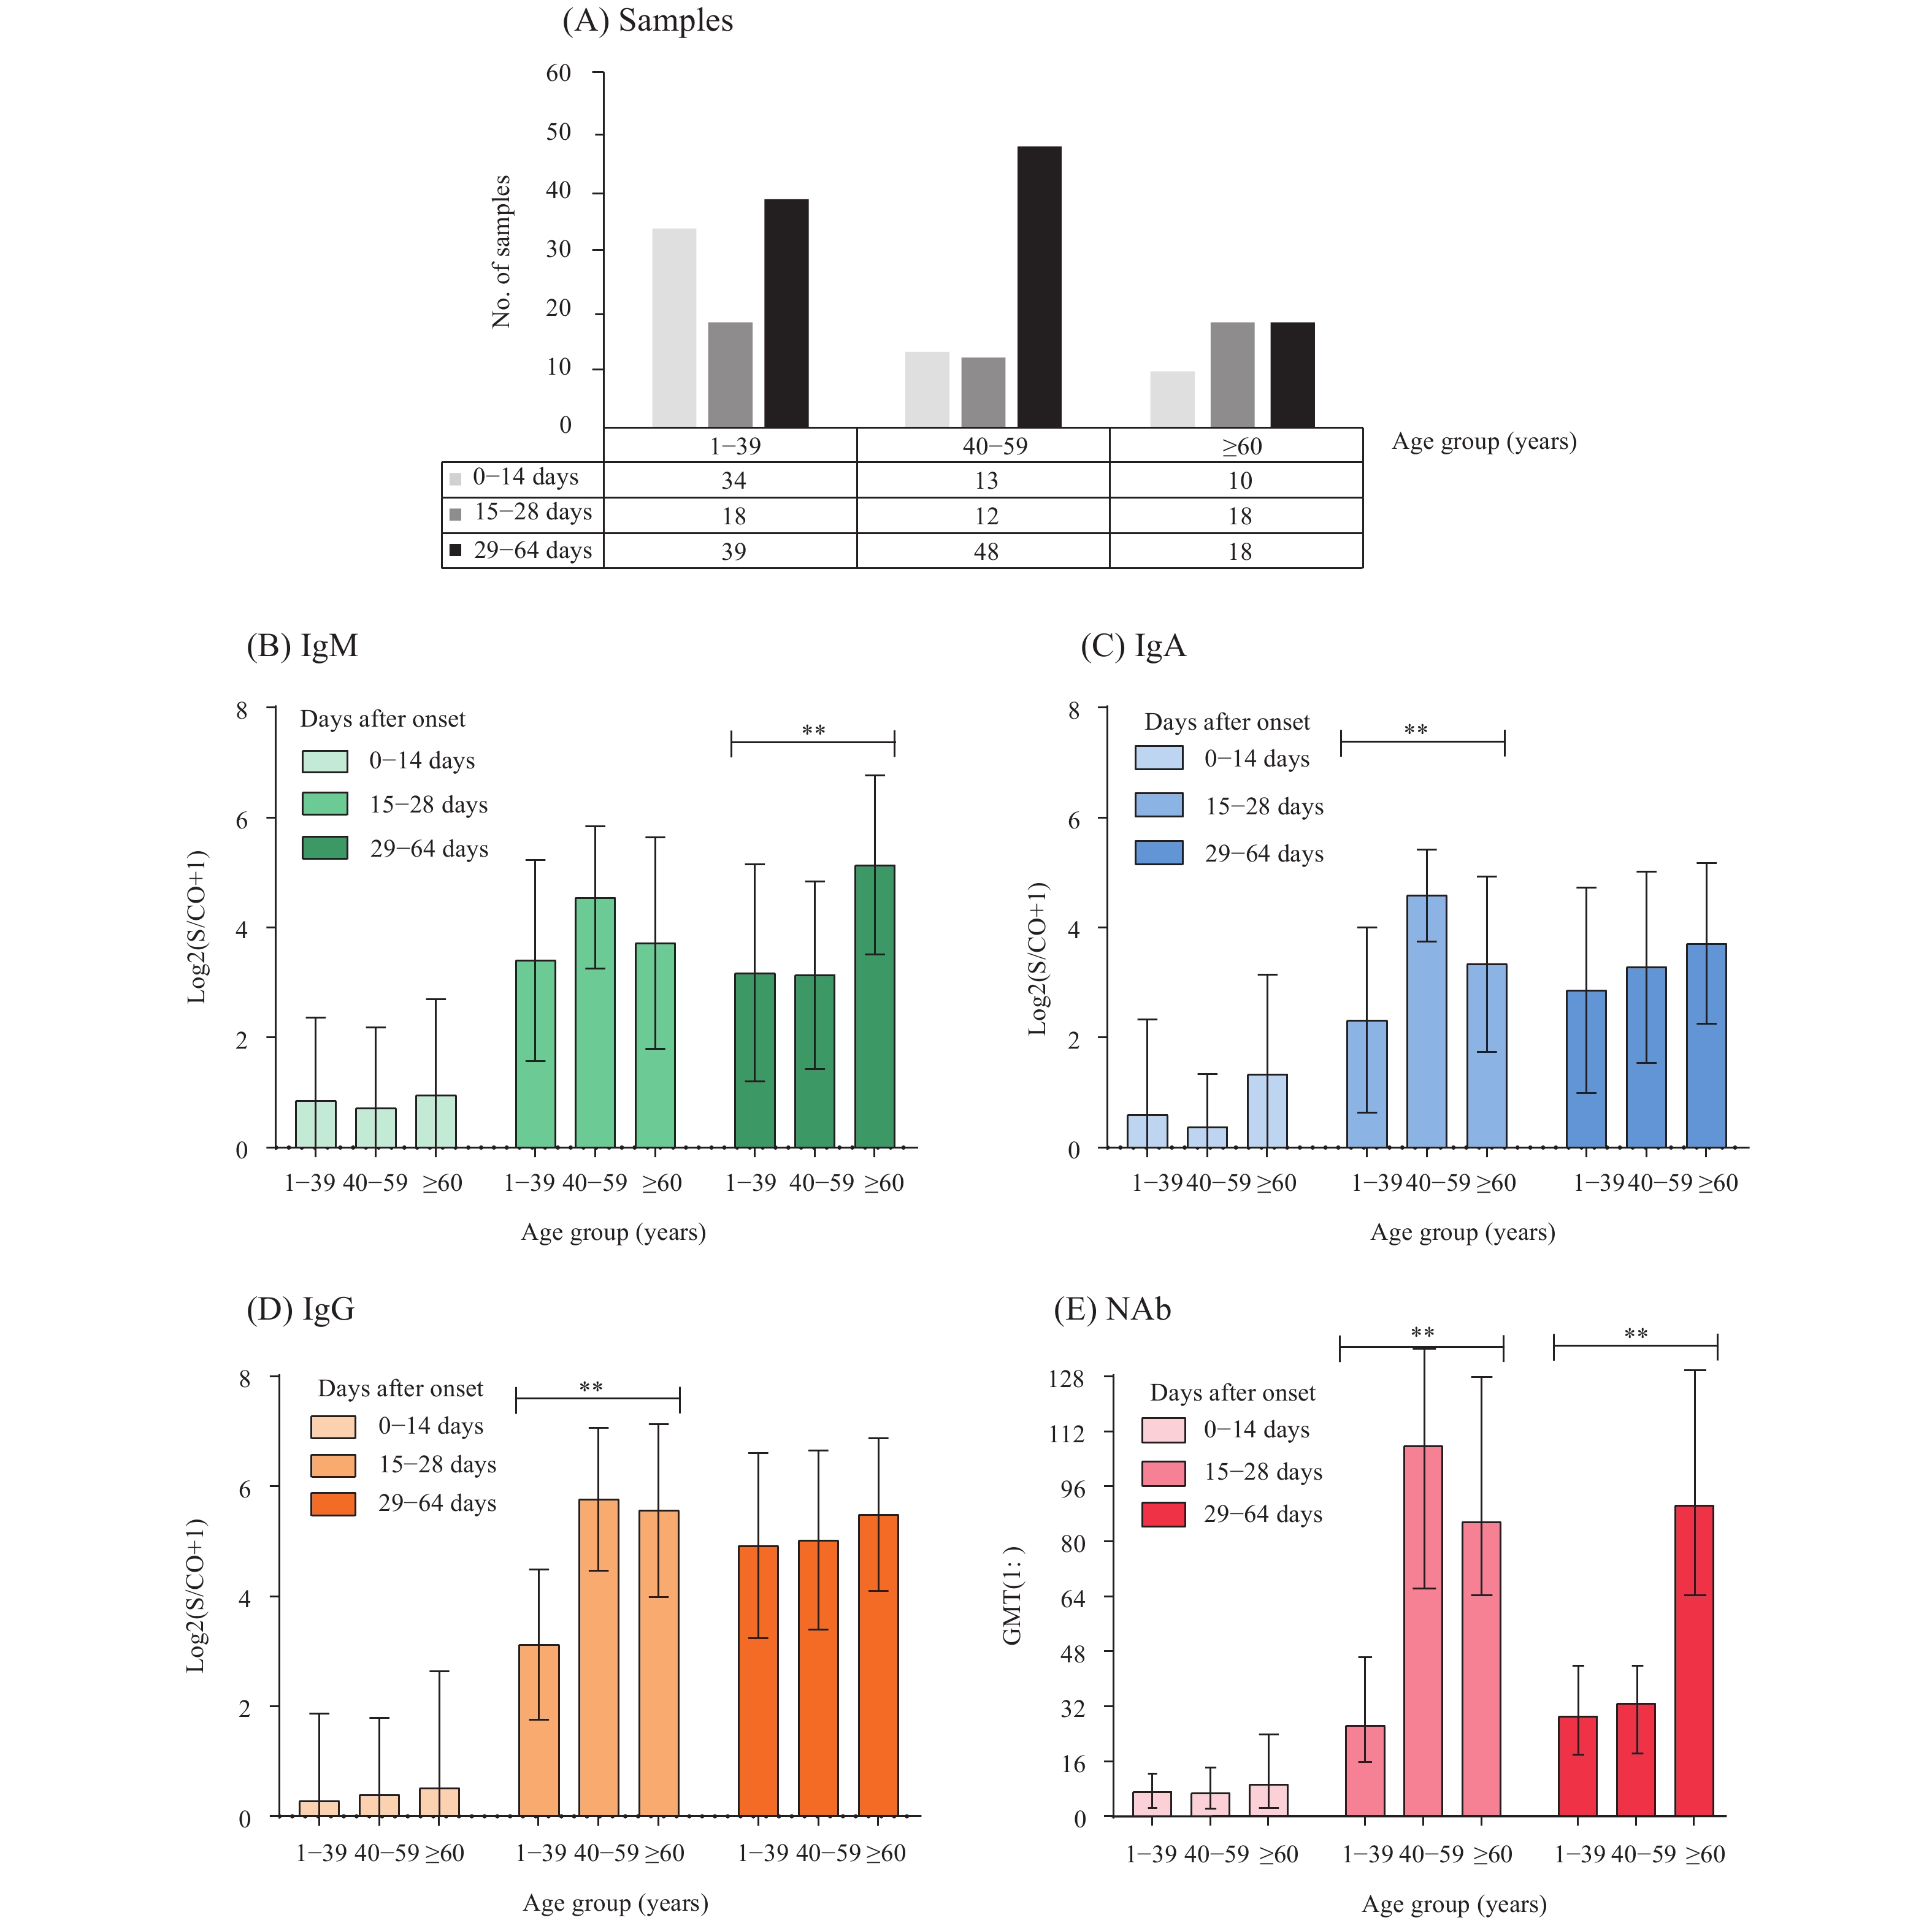 Figure 2.
The changes in levels of antibodies, including IgM (B), IgA (C), IgG (D), and NAb (E), against COVID-19 virus after disease onset based on the age distribution of the COVID-19 cases. (A) showed the number of samples in age groups including those aged 1–39 years, those aged 40–59 years, and those over 60 years of age. The symbol “**” indicated statistical significance (p<0.05) across the age groups. Scatter and histogram plots were created with GraphPad Prism (version 8.0.2, GraphPad Software, San Diego, CA, USA). GMT=geometric mean titer.
Variable responses among the four different disease types were observed for the four types of antibodies. The antibody levels of IgM and IgA showed significant differences among the different disease types within two weeks of onset (p<0.05), and higher antibody levels were observed in the mild and moderate groups than those in the severe and critical groups. While the antibody levels of IgM, IgA, IgG, and NAb showed significant differences among the different disease severities after 4 weeks of onset (p<0.05), higher levels were observed in the severe and critical groups. Persistently higher levels of IgG and NAb were observed from the beginning of disease onset among the four critical-type cases in this study compared to other types of disease classification (Figure 3).
 Figure 3.
The antibody response of IgM (B), IgA (C), IgG (D), and NAb (E) against COVID-19 virus among COVID-19 patients with different disease severity. (A) showed the number of samples in the different disease severities of COVID-19 cases, including mild (Mi), moderate (Mo), and severe and critical types (S/C). (F) showed the antibody levels of critical-type cases based on number of days after disease onset. The level of NAb was shown by the titer of the NAb, instead of geometric mean titer (GMT), due the limited number of critical cases. The symbol “**” indicated statistical significance (p<0.05) across age groups. Scatter and histogram plots were created with GraphPad Prism (version 8.0.2, GraphPad Software, San Diego, CA, USA).
HTML
-
In this study, IgM, IgA, and IgG antibodies and NAb were detected in 210 serum samples from 160 confirmed COVID-19 cases. The changes in the levels of the 4 types antibodies against COVID-19 virus were analyzed. Our results confirmed findings from previous reports that the positive rate of COVID-19 virus antibodies was lower among patients within the first week of onset, then rapidly increasing and remaining at a high level after two weeks of onset (4). Similar antibody responses were also observed from severe acute respiratory syndrome (SARS) and Middle East respiratory syndrome (MERS), where the antibody against the SARS coronavirus (CoV) appeared within approximately two weeks of onset and gradually increased over the course of the disease (5) and the anti-MERS-CoV antibody occurred between days 14–21 after infection (6). However, this was different from the measles virus, in which 90% of measles cases showed detectable levels of IgM 3 days following rash onset (7).
Although the sensitivity of nucleotide acid detection was high in samples collected within the first week after onset, it decreased up to 45.5% in those collected after two weeks (4). The dynamics of the COVID-19 virus-specific antibody responses found in this study indicated their roles in the diagnosis of suspected COVID-19 cases. As a supplement to nucleotide acid detection, IgM, IgA, and IgG antibodies could be useful biomarkers for the confirmation of COVID-19 cases, particularly in the later stages of the disease (after two weeks of onset). However, prolonged antibody response raises challenges in diagnosis and the management of COVID-19 patients.
The levels of 4 types of COVID-19 virus specific antibodies were consistent with the positive rate of detection. A low level of the antibodies was detected within 2 weeks of onset, the levels subsequently increased rapidly and reached a peak between the 3rd and 4th weeks, and then the levels maintained a plateau. A similar trend has also been found in other studies, which showed that the antibody titer peaks at 10–15 days after onset (8). However, the results of this study showed that the level of NAb rapidly decreased between the 5th and 9th weeks after onset while IgG maintained a stable level. Considering that the IgG antibody is the major protective antibody, its ability to offer protection from the virus might decrease due to significant decreases in the NAb titer at the later stages of the disease. Therefore, reinfection might occur if the level of the NAb wanes persistently below the protective level. In addition, the persistence of immunity is a key issue in the development of safe and effective antiviral therapy and vaccines (9). For other coronaviruses, immunity was maintained for several months after infection and then began to wane (10–11). In this study, because the longest period of specimen collection for COVID-19 patients was around nine weeks after disease onset, the persistence of the antibodies remains unclear due to the short observation period. Therefore, more sera of convalescent patients should be collected for further study on the long-term dynamics of COVID-19 virus antibodies.
No obvious differences were observed for antibodies among different age groups within 2 weeks, while higher NAb level were found among the older age groups (≥40 years) after 2 weeks, which was consistent with a previous report (3). However, variable antibody responses among the COVID-19 cases with different disease severity were observed for the four types of antibodies. The higher antibody levels of IgM and IgA were found in the early stage of the disease in the mild and moderate groups, while higher levels of IgM, IgA, IgG, and NAb were observed in the later stages of the disease in the severe and critical groups. Our findings suggested that the antibody response was closely related to the severity of disease. In addition, persistently high levels of IgG/NAb were observed from the onset among four critical cases. This phenomenon was also found in previous reports that SARS patients with more severe symptoms had stronger serological responses (12–13). Antibody-dependent enhancement (ADE), as a possible underlying mechanism, has been proposed recently (14). Thus, extensive viral replication, cellular damage, and ADE might be responsible for the aggressive inflammation caused by the COVID-19 virus (14–15).
This study was subject to some limitations. Although the sera in this study were obtained at various times following illness onset, more serial sera were recommended to be collected from patients with the different disease severity, in order to study the long-term dynamic of COVID-19 virus antibodies response.. In addition, sample collection should be strengthened among child patients to supplement the knowledge regarding the pediatric immune response against COVID-19 virus.
Our study on the dynamics of serological antibody responses against COVID-19 virus among COVID-19 patients complements the recognition regarding the humoral immune response to COVID-19 virus infection. Our study will help in the interpretation of antibody detection results for COVID-19 patients and be beneficial for the evaluation of vaccination effects.
Acknowledgements: We gratefully acknowledge the staff from clinical hospitals and provincial-level CDCs in Gansu and Heilongjiang provinces for the clinical investigation and serum samples collection presented in this article.
Fundings: This work was supported by the Key Technologies R&D Program of the National Ministry of Science (2018ZX10713002 and 2018ZX10713001-003).
| Citation: |

|