

 Download:


-
Hepatitis C virus (HCV) infection is a major public health problem worldwide (1). It is necessary to clarify the global trends and regional differences in HCV infection prevalence to make tailored prevention strategies. The HCV infection burdens from 1990 to 2017 were collected from the Global Burden of Disease (GBD) Study 2017. Relative changes in HCV cases and estimated annual percentage changes (EAPCs) of age-standardized prevalence rate (ASR) with 95% confidence intervals (CIs) were used to quantify temporal trends of HCV infection. HCV infection ASR decreased by an average of 0.67% (95% CI: 0.64%–0.70%) per year from 2,043.42 per 100,000 in 1990 to 1,728.04 per 100,000 in 2017, while the number of HCV cases increased by 28.82% from 105.15 million in 1990 to 135.45 million in 2017. Against the global background of HCV infection prevalence decreasing, the ASR increased in Eastern Europe (EAPC=0.78, 95% CI: 0.56–0.99). Liver cancer due to hepatitis C increased drastically in the low-middle Socio-Demographic Index (SDI) regions in the last decade. There is no vaccine for hepatitis C, therefore, prevention should be focused on reducing exposure risk to HCV by safe injections, harm reduction, screening, and treatment.
About 55%–85% of infected persons develop chronic HCV infection without treatment, and 15%–30% of those with chronic infections develop complications within 20–30 years (2). Global incidence of HCV infection was 23.7 per 100,000 population in 2015 with 1.75 million new infections (3). About 71.1 million people were living with HCV, accounting for 1% of the population (1), and approximately 399,000 people died from cirrhosis and hepatocellular carcinoma (HCC) due to hepatitis C in 2016 (2). A watershed moment came in 2014 with the development of highly effective direct-acting antivirals (DAAs) for HCV infections (4). DAAs can not only cure those treated, thereby reducing death risk from cirrhosis and HCC, but also reduce HCV transmission and therefore its prevalence (5). Advances in HCV therapeutics prompted World Health Organization (WHO) member states to set targets for HCV elimination. However, only 20% of persons with hepatitis C know their diagnosis, and 15% of those with known hepatitis C have been treated (1). The global epidemic may continue to expand in magnitude in the absence of scaled-up interventions because new infections outnumbered the individuals dying from end-stage HCV infections and those who were cured.
The HCV infection burden, including acute hepatitis C, cirrhosis and other chronic liver diseases due to hepatitis C, and liver cancer due to hepatitis C from 1990 to 2017 by age group, region, and country, was collected from GBD 2017 (6). Specific methods of the estimation process for HCV infection prevalence were described elsewhere (6). First, anti-HCV seroprevalence data from population-based studies and surveys were reviewed to estimate the acute hepatitis C prevalence using DisMod-MR 2.1 model. Second, total cirrhosis and total liver cancer prevalence were modelled using hospital data and cause-specific mortality rate estimates. Third, the proportions of cirrhosis and liver cancer due to underlying etiologies such as hepatitis B, hepatitis C, and alcohol use were estimated by meta-regression. Finally, the prevalence of cirrhosis and liver cancer due to hepatitis C was estimated according to total cirrhosis and total liver cancer prevalence and the proportion attributable to hepatitis C.
The 195 countries and territories were divided into 5 SDI regions according to total fertility rate under 25 years old, years of education for those aged 15 and older, and lag distributed income per capita and were separated into 21 GBD regions based on their epidemiological homogeneity and geographical contiguity. The ASR calculated by the direct method and absolute number of HCV cases were used to show HCV epidemic status. Relative changes in HCV cases and EAPCs of ASR with 95% CIs were calculated to quantify the temporal trends of HCV infection from 1990 to 2017. Change in HCV cases was defined as
$\dfrac{{{\rm{HCV}}\;case{s_{2017}} - {\rm{HCV}}\;case{s_{1990}}}}{{{\rm{HCV}}\;case{s_{1990}}}} \times 100{{\% }}$ . A regression line was fitted to the natural logarithm of ASR, for instance, y=α+βx+ε, where y=ln(ASR) and x=calendar year, EAPCs=100×(eβ−1). All statistical analyses were conducted by R statistical software (version 3.5.1; The R Foundation for Statistical Computing, Vienna, Austria). Statistical significance was attributed to p values (p<0.05).The HCV infection ASR was unevenly distributed worldwide with the highest in Egypt (Figure 1). HCV cases in China and India accounted for one third of the global HCV infections. The HCV infection ASR decreased by 0.67% (95% CI: 0.64%–0.70%) per year globally from 2043.42 per 100,000 in 1990 to 1728.04 per 100,000 in 2017 (Table 1); while the number of HCV cases increased by 28.82% from 105.15 million in 1990 to 135.45 million in 2017, and increased significantly among individuals aged 50−69 years old and 70 years old above by 63.87% and 76.53%, respectively (Supplementary Figure S1). Against the global trend of ASR falling, an increasing trend was reported in Eastern Europe (EAPC=0.78, 95% CI: 0.56–0.99). Meanwhile, the number of HCV cases only decreased in Central and Western Europe. Over 99% of HCV infections were cirrhosis and other chronic liver diseases (Supplementary Figure S1), and the global trends and regional differences of which were similar to those of global HCV infections (Supplementary Figure S2).
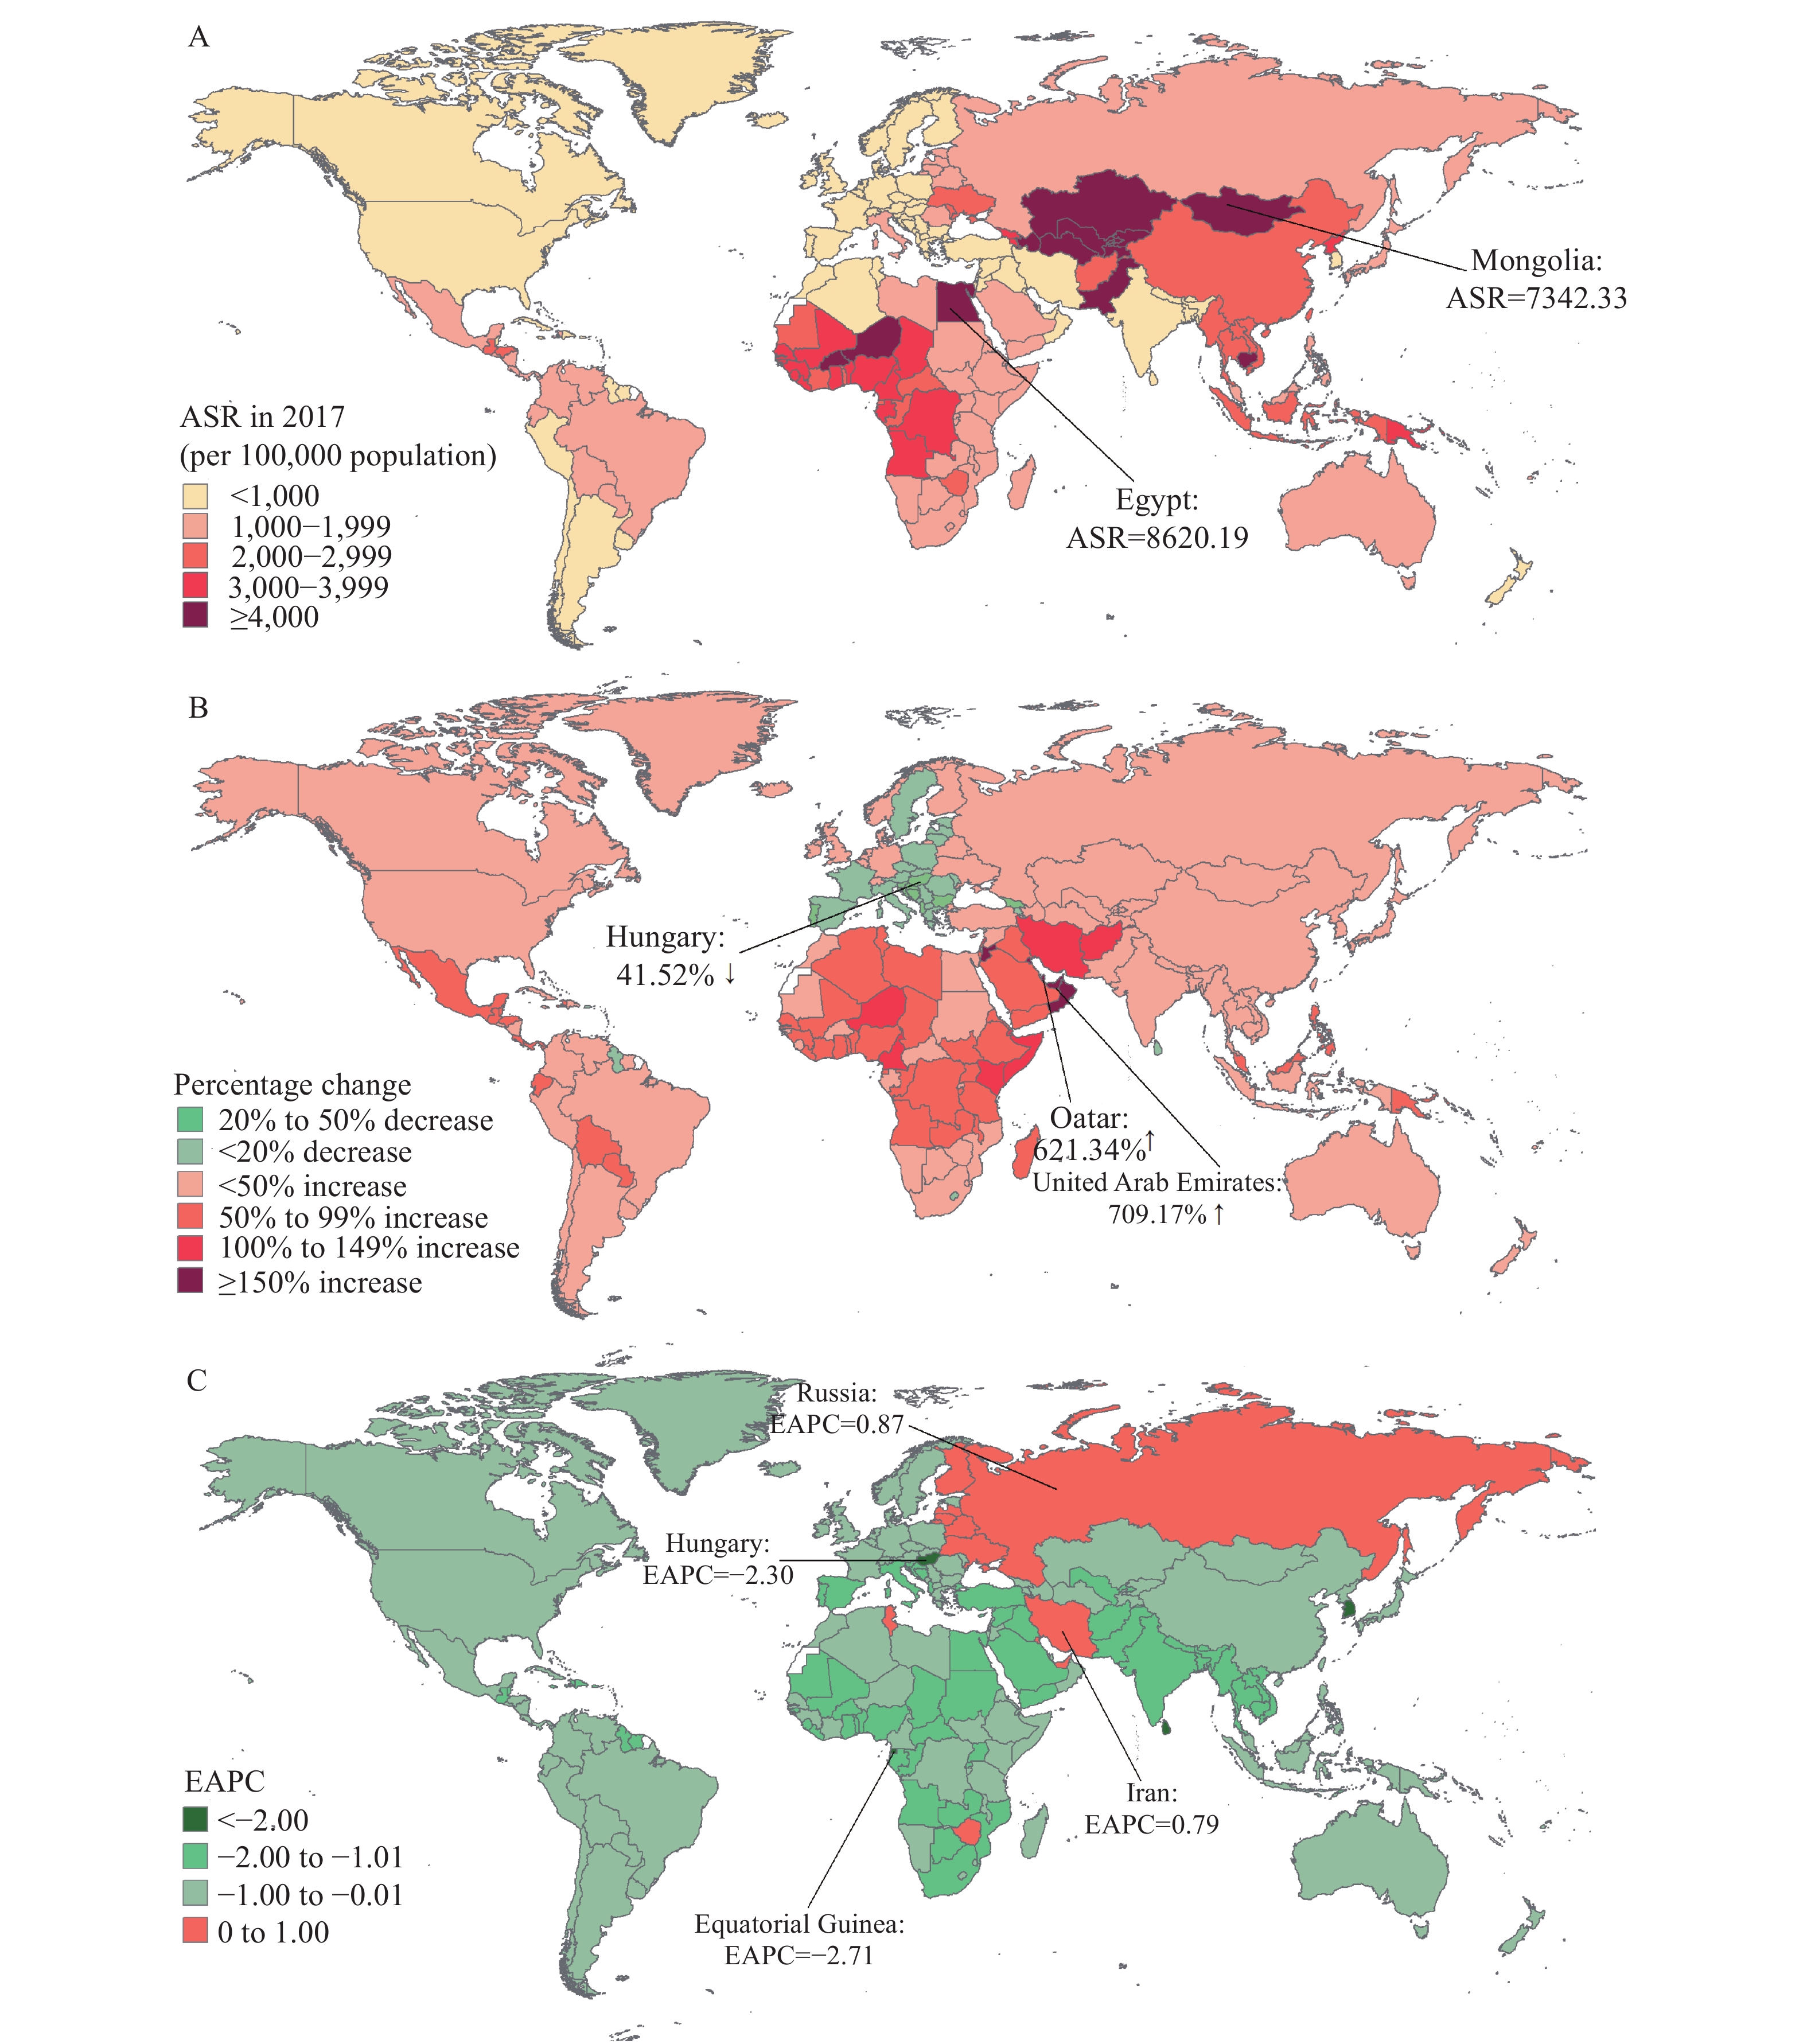 Figure 1.
The global trends of HCV infection burden in 195 countries and territories. (A) The age-standardized prevalence rate (ASR) of HCV infection in 2017; (B) The percentage change in HCV cases between 1990 and 2017; (C) The estimated annual percentage changes (EAPCs) of age-standardized prevalence rate of HCV infection from 1990 to 2017.
Characteristics EAPCs of ASR (95%CI) Acute hepatitis C Cirrhosis and other chronic liver diseases due to hepatitis C Liver cancer due to hepatitis C Total HCV infections Global −0.62(−0.65 to −0.59) −0.67(−0.70 to −0.64) 0.87(0.80 to 0.94) −0.67(−0.70 to −0.64) Socio–Demographic Index Low −0.57(−0.64 to −0.50) −0.79(−0.83 to −0.76) −0.63(−0.67 to −0.59) −0.79(−0.82 to −0.76) Low–middle −0.59(−0.61 to −0.56) −0.87(−0.93 to −0.82) 0.64(0.57 to 0.71) −0.87(−0.92 to −0.82) Middle −0.89(−0.93 to −0.86) −0.94(−0.98 to −0.90) 0.19(−0.01 to 0.38) −0.94(−0.98 to −0.89) High−middle −0.78(−0.82 to −0.73) −0.61(−0.67 to −0.56) 1.24(0.94 to 1.53) −0.61(−0.67 to −0.55) High −1.04(−1.12 to −0.97) −0.71(−0.76 to −0.67) 1.34(1.13 to 1.55) −0.71(−0.75 to −0.66) Global Burden of Disease Region High−income Asia Pacific −1.51(−1.64 to −1.38) −1.01(−1.06 to −0.97) −0.57(−0.75 to −0.38) −1.01(−1.05 to −0.96) Central Asia −0.34(−0.46 to −0.23) −0.63(−0.74 to −0.52) 0.17(0.08 to 0.26) −0.63(−0.74 to −0.52) East Asia −0.66(−0.75 to −0.57) −0.67(−0.74 to −0.6) 0.85(0.56 to 1.13) −0.67(−0.74 to −0.59) South Asia −0.68(−0.75 to −0.61) −1.04(−1.14 to −0.94) 1.16(1.12 to 1.20) −1.04(−1.14 to −0.94) Southeast Asia −0.77(−0.79 to −0.75) −0.84(−0.86 to −0.82) 0.09(0.00 to 0.18) −0.84(−0.86 to −0.82) Australasia −0.30(−0.36 to −0.24) −0.51(−0.57 to −0.44) 4.66(4.24 to 5.08) −0.50(−0.56 to −0.44) Caribbean −1.07(−1.10 to −1.03) −1.00(−1.05 to −0.95) −0.51(−0.63 to −0.39) −1.00(−1.05 to −0.95) Central Europe −0.74(−0.87 to −0.61) −0.96(−1.02 to −0.90) 0.57(0.40 to 0.74) −0.96(−1.02 to −0.90) Eastern Europe 0.65(0.45 to 0.86) 0.78(0.56 to 1.00) −0.18(−0.32 to −0.04) 0.78(0.56 to 0.99) Western Europe −1.33(−1.44 to −1.23) −1.06(−1.13 to −0.98) 2.38(2.02 to 2.73) −1.04(−1.12 to −0.97) Andean Latin America −0.51(−0.54 to −0.47) −0.69(−0.73 to −0.65) 0.27(0.11 to 0.44) −0.69(−0.72 to −0.65) Central Latin America −0.94(−1.01 to −0.86) −0.63(−0.66 to −0.60) −0.63(−0.70 to −0.57) −0.63(−0.66 to −0.60) Southern Latin America −0.86(−0.93 to −0.78) −0.65(−0.71 to −0.59) −0.40(−0.52 to −0.29) −0.65(−0.71 to −0.59) Tropical Latin America −0.48(−0.64 to −0.32) −0.48(−0.69 to −0.27) 0.00(−0.17 to 0.17) −0.48(−0.69 to −0.27) North Africa and Middle East −1.08(−1.12 to −1.03) −1.34(−1.43 to −1.26) 1.10(0.91 to 1.29) −1.34(−1.42 to −1.25) High−income North America 0.01(−0.08 to 0.11) −0.19(−0.34 to −0.05) 4.47(3.99 to 4.95) −0.18(−0.32 to −0.03) Oceania −0.30(−0.39 to −0.21) −0.32(−0.38 to −0.25) 0.32(0.27 to 0.38) −0.32(−0.38 to −0.25) Central Sub−Saharan Africa −0.64(−0.89 to −0.40) −0.70(−0.88 to −0.52) −1.22(−1.40 to −1.04) −0.70(−0.88 to −0.52) Eastern Sub−Saharan Africa −0.85(−0.95 to −0.74) −0.77(−0.87 to −0.68) −0.83(−0.95 to −0.72) −0.77(−0.87 to −0.68) Southern Sub−Saharan Africa −0.90(−1.08 to −0.72) −0.96(−1.12 to −0.79) −0.94(−1.41 to −0.47) −0.96(−1.12 to −0.79) Western Sub−Saharan Africa −0.99(−1.07 to −0.92) −1.07(−1.11 to −1.02) −1.17(−1.2 to −1.14) −1.07(−1.11 to −1.02) Table 1. The estimated annual percentage changes (EAPCs) of the age standardized prevalence rate (ASR) of acute hepatitis C, cirrhosis, and other chronic liver diseases due to hepatitis C, liver cancer due to hepatitis C, and total HCV infections from 1990 to 2017 by region.
The highest acute hepatitis C ASR was observed in Central Asia and the lowest in Western Europe (Supplementary Figure S3). The acute hepatitis C ASR decreased by 0.62% (95% CI: 0.59%–0.65%) per year from 9.50 per 100,000 in 1990 to 8.05 per 100,000 in 2017; while the number of acute hepatitis C cases increased by 8.63% from 0.54 million in 1990 to 0.59 million in 2017. The acute hepatitis C ASR increased in Eastern Europe (EAPC=0.65 95% CI: 0.45–0.86), and the number of acute hepatitis C cases decreased distinctly in Central Europe (30.47%) and East Asia (22.5%) (Supplementary Figure S3).
Liver cancer due to hepatitis C ASR was distributed heterogeneously worldwide with the highest in high-income Asia Pacific Region (14.39 per 100,000 in 2017) (Figure 2). Globally, liver cancer due to hepatitis C ASR increased by 0.87% (95% CI: 0.80%–0.94%) per year from 3.38 per 100,000 in 1990 to 4.54 per 100,000 in 2017. Meanwhile, the number of liver cancer due to hepatitis C increased by 159.40% from 0.14 million in 1990 to 0.37 million in 2017, and significantly increased by 253.15% among those over 70 years old (Supplementary Figure S1). Remarkably, liver cancer due to hepatitis C ASR increased drastically in low-middle SDI regions in the last decade, and increases were also observed in middle SDI regions (Supplementary Figure S4). The liver cancer due to hepatitis C ASR increased enormously in Australasia (EAPC=4.66, 95% CI: 4.24–5.08) and high-income North America (EAPC=4.47, 95% CI: 3.99–4.95), and the number of cases also increased by 521.99% and 455.62%, respectively (Figure 2).
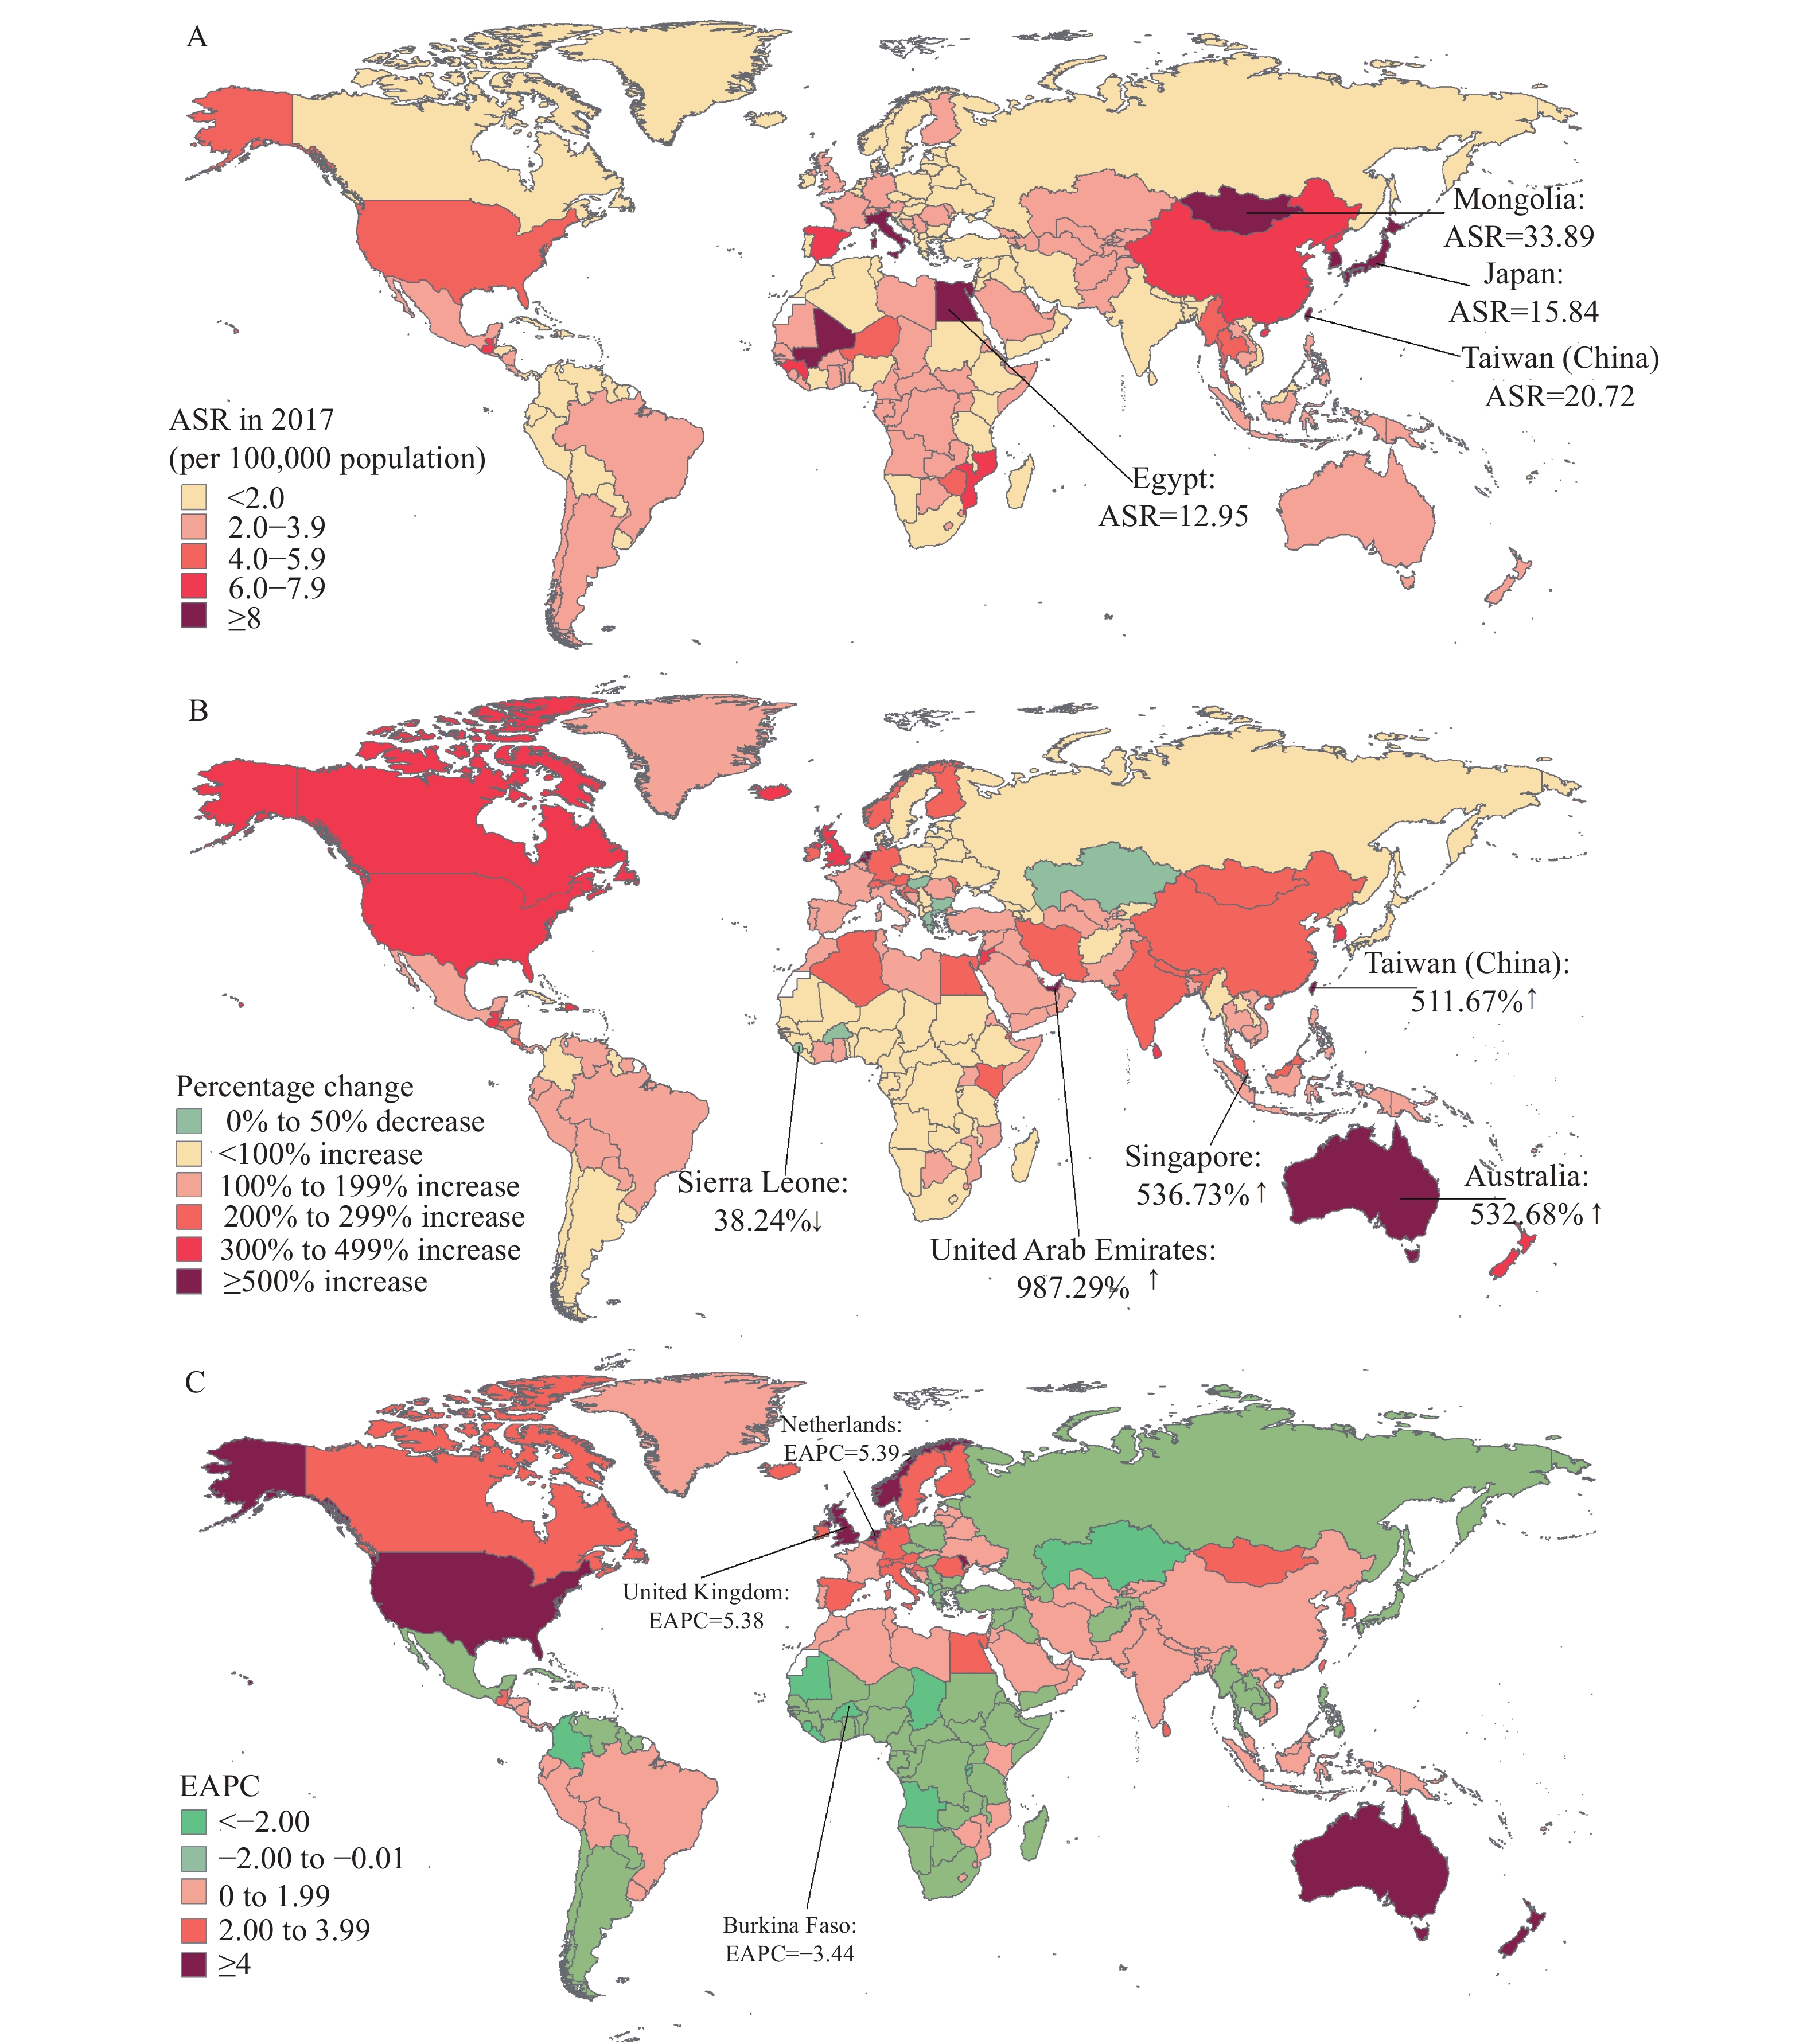 Figure 2.
The global trends of liver cancer due to hepatitis C in 195 countries and territories. (A) The age-standardized prevalence rate (ASR) of liver cancer due to hepatitis C in 2017; (B) The percentage change in the number of liver cancer due to hepatitis C between 1990 and 2017; (C) The estimated annual percentage changes (EAPCs) of age-standardized prevalence rate of liver cancer due to hepatitis C from 1990 to 2017.
HTML

-
HCV infection ASR decreased globally except in Eastern Europe, and liver cancer due to hepatitis C ASR increased worldwide with drastic shifts in low-middle SDI regions in the last decade. The reduction of HCV infection ASR was partly due to the increased mortality due to liver-related causes and an ageing population. Similar with previous studies, Egypt had the highest HCV prevalence with 6.3% of the population living with HCV due to endemic schistosomiasis treatment by unsafe healthcare injections from the 1950s to 1980s, and subsequently inadequate infection control and interfamilial transmission (7). Over 1 million people in Egypt, the first country to negotiate an alternative price of DAAs, were treated from 2015 to 2017; however, treatment numbers stagnated and finding those undiagnosed remained the biggest challenge (7). Being unaware of HCV infection can lead to serious health outcomes and increase HCV transmission risk (8). Consistent with this study, the WHO reported that hepatitis C was found in less than 0.5% of the population in Western, Northern, and Central Europe and as high as 3%–6% in many countries of Eastern Europe and Central Asia, and Eastern Europe suffered from an increasing trend of HCV infection due to sharing of needles and syringes (9).
Nowadays, even in areas where HCV infections were low, an increase in HCV transmission may occur (3). Consistent with our study, surveillance in the United States showed a reemergence of new HCV infections with reported acute hepatitis C rates increasing threefold from 0.3 per 100,000 population in 2009 to 1.2 per 100,000 population in 2018 concurrent with the nation’s opioid crisis; and increasing rates among reproductive-aged persons put multiple generations at risk for chronic hepatitis C (8). Prevention should be focused on reducing exposure risk because no vaccine exists for hepatitis C (9). The protection of safe injections and harm reduction and screening are key points to prevent new infections worldwide.
The global liver cancer due to hepatitis C ASR displayed increases and remarkably increased in most high-income regions probably due to the longer life expectancy and higher ageing population. To some extent, the increases were also driven by the increasing of obesity, diabetes, and steatosis, since these diseases could increase risk of advanced fibrosis among chronic HCV infections (10). A prospective cohort study reported DAA treatment reduced risk for mortality and HCC, therefore, DAAs should be considered in all chronic HCV infections (5). A global mathematical model estimated a comprehensive package of HCV prevention, screening, and treatment could result in a 61% reduction in mortality compared with the 2015 baseline (4). However, the prices of DAAs remained high in high-income countries and those middle-income countries where generic drugs were unable to access and licensing agreements were not covered (3).
To our knowledge, this is the first assessment of the global landscape, long-term trends, and regional differences in HCV infection prevalence using GBD study data. HCV is still prevalent worldwide despite the development of DAAs, and a reemergence of HCV was concurrent with the opioid crisis. HCV infection prevention might involve at least 3 aspects: first, prohibiting HCV widespread transmission among general populations; second, increasing global DAAs coverage; and third, continuously investing in the development of an HCV vaccine. Public health gains can be made in low-resource contexts, provided there is strong government will, budgetary commitments, and smart drug procurement to make life-saving treatments affordable.
Several limitations remained. First, availability of data and quality of available data in different regions might be incomparable and limit accuracy and robustness of HCV infection estimates in the modeling, evaluation of which was not listed due to limited space. Second, different regional governments had different priorities in HCV treatment, prevention, and healthcare policies. Third, EAPCs and change of HCV cases from 1990 to 2017 might mask the short-term trends that reflected the effectiveness of recent prevention interventions.
Acknowledgements: We appreciate the works by the Global Burden of Disease study 2017 collaborators.
Fundings: This study was supported by the grant from National Natural Science Foundation of China (71874003, 71934002, and 81703240).
| Citation: |

|