
 Download:


-
Since the middle of December 2019, cases of pneumonia caused by coronavirus disease 2019 (COVID-19) were found in Wuhan, Hubei Province, and the virus began rapidly spreading throughout China (1-3). The percentage of patients with diabetes or hypertension contracting COVID-19 (excluding those with both diabetes and hypertension) was approximately 10% higher than that those without these disorders. (3). However, statistical evidence to suggest that patients with diabetes or hypertension were more predisposed to suffer more severe illness was insufficient so far. This study aimed to explore the effects of patient characteristics on COVID-19 severity including age, sex, and underlying diseases. We analyzed hospital-based data from January 23, 2020 to February 25, 2020 in Yichang, Hubei Province by applying ordinal and binary logistic regression. The results suggested elderly (≥65 years) patients with diabetes are more likely to suffer severe illnesses. Based on the fact that severity is directly related to patients’ survival, proper treatments for this group are particularly important. Furthermore, prevention must be emphasized.
The medical records of patients who were diagnosed with COVID-19 by nucleic acid tests were obtained from hospital-based data from January 23, 2020 to February 25, 2020 in Yichang, Hubei Province and were collected by a monitoring network for two hospitals including the Third People’s Hospital of Yichang and the Jiangnan branch of the Central People’s Hospital of Yichang based on the big data platform. This study sample consisted of all 882 symptomatic living patients, whose clinical data involved individual information (age and sex) and a personal history of underlying disease (diabetes and hypertension). The severity of disease was diagnosed by the reporting system of communicable disease. This severity was categorized into mild, moderate, and severe illnesses, which could be regarded as an ordinal response variable based on specialized medical knowledge. Age, sex, and personal history of underlying diseases were considered to be study factors. According to global recommendations on physical activity for health developed by WHO, age, which was originally a continuous variable, was dichotomized into the young and middle-aged group (age <65 years), and senior group (age ≥65 years). Personal history of underlying diseases was classified into the following categories: patients without diabetes and hypertension, patients with hypertension only, patients with diabetes only, and patients with diabetes and hypertension. Before we fitted the ordinal logistic regression (OLR) model with studies factors, all independent variables chosen from the studied factors should be significantly associated with the severity of this disease, which were ensured by applying Pearson chi-square test (4). First, an OLR model-proportional odds model (POM) was adopted to explore the risk factors of the severity of this disease if the proportional odds assumption was not violated (4-5). Second, if the above stringent assumption was not satisfied, two efficient approaches were generally developed to fit the data. The one solution for analyzing the data is to apply an OLR partial proportional odds model (PPOM), in which the proportional odds assumption is not valid (5). The other method is to use multiple separate binary logistic regression (BLR) models. Besides, the global goodness-of-fit is crucial to evaluating the adequacy and efficiency of statistical models. The likelihood-ratio test was commonly conducted to assess the overall goodness-of-fit of ordinal logistic regression POM and PPOM, while that of BLR models was verified by the Hosmer and Lemeshow test (4). All statistical analyses were conducted by R statistical software (version 3.5.1; The R Foundation for Statistical Computing, Vienna, Austria).
The proportion of patients with mild, moderate, and severe illnesses in symptomatic living patients was 17.69%, 61.00%, and 21.31% respectively. The distribution of patients with different illnesses according to studied influential factors is depicted in Figure 1 and Table 1. The percentage of males (51.25%) was similar to that of females in patients, and the Pearson chi-square test revealed that there was no difference on gender for the severity of this disease of patients at the 0.05 significance level. The severity of this disease was significantly different on the two age groups and four status of underlying diseases according to the results of Pearson chi-square statistics and p-values. The severity of this disease as three ordinal categories was regarded as the dependent variable, while age group and status of underlying diseases selected to be the explanatory variables were employed to fit the OLR POM. However, the score test of the proportional odds assumption is significant (Chi-square=31.569, df=4, p<0.001), and the results of single score test of that assumption for each independent variable indicated that age violated that assumption (p<0.001). Therefore, we considered the estimate of coefficients obtained to be biased and applied an OLR PPOM as well as a BLR model to analyze the data. Results of the PPOM and BLR model are separately presented in Tables 2–3. The results of PPOM suggested that the risk of suffering severe illness was 4.71 (95% CI: 3.25–6.82) times higher among senior patients, when compared with young and middle-aged patients. The odds ratio for patients with diabetes as well as patients with diabetes and hypertension compared to patients without diabetes and hypertension were approximately 3.00 (95% CI: 1.47–6.09) and 2.89 (95% CI: 1.43–5.82), respectively, when the severe illness was compared with non-severe illnesses, or moderate and severe illnesses were compared with mild illness. Nevertheless, the risk of suffering from severe illness was found insignificant for patients only with hypertension compared to patients without hypertension and diabetes. The likelihood ratio statistic and p-value indicated PPOM built with adequate goodness-of-fit, while the Nagelkerke pseudo R2
of POM and PPOM were 0.103 and 0.140, respectively, further favoring PPOM as a better fit than POM. The results of the BLR model were relatively consistent with that of PPOM. 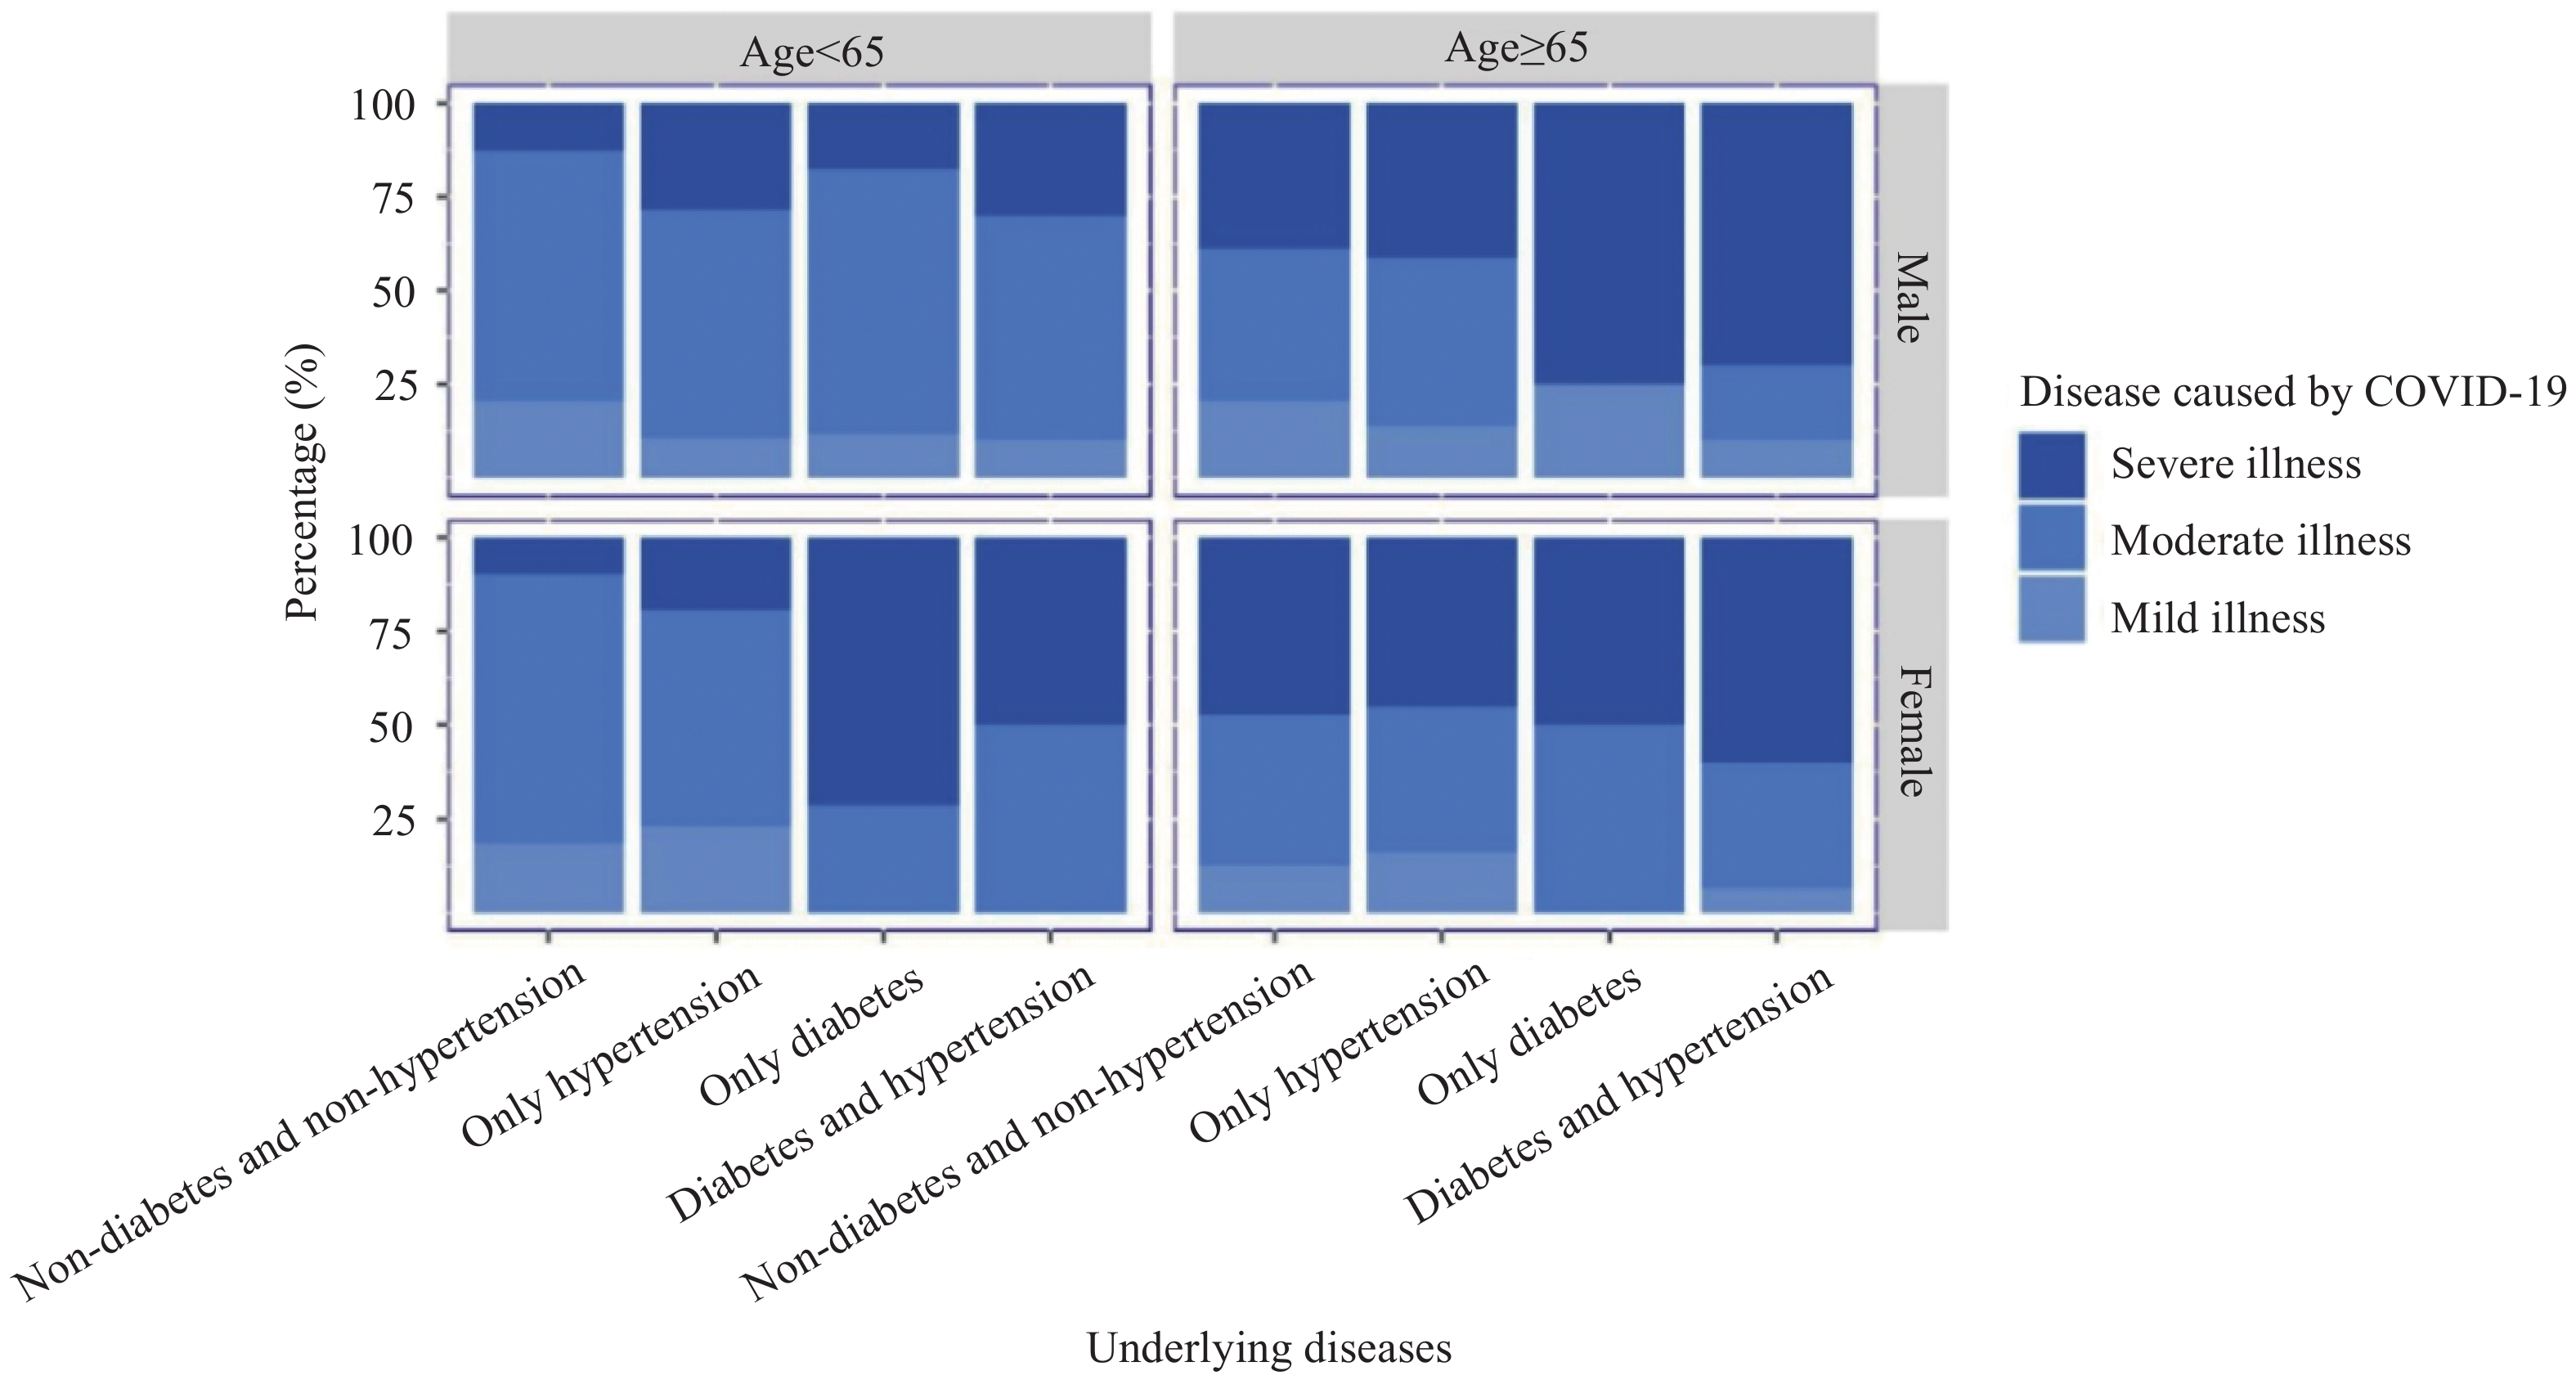 Figure 1.
The distribution of the severity of disease according to studied influential factors from January 23, 2020 to February 25, 2020 in Yichang.
Independent variable Mild illness Moderate illness Severe illness Total Pearson chi-square (p) Age (years) <65 125 457 91 673 104.41 (<0.001) ≥65 31 81 97 209 Sex Male 84 271 97 452 0.596 (0.742) Female 72 267 91 430 Underlying diseases Non-diabetes and non-hypertension 132 450 115 697 53.294 (<0.001) Only hypertension 18 57 39 114 Only diabetes 3 17 14 34 Diabetes and hypertension 3 14 20 37 Total 156 538 188 882 – Table 1. Results of univariate analyses for the effect of the influential factors on the severity of illnesses from January 23, 2020 to February 25, 2020 in Yichang.
Influential factor (Moderate & Severe illnesses) vs. Mild illness Severe illness vs. (Mild & Moderate illnesses) Coefficient OR (95% CI) p Coefficient OR (95% CI) p Intercept 1.416 − <0.001 −1.963 − <0.001 Age (years) (0–64 years as reference) ≥65 years 0.100 1.105 (0.711, 1.719) 0.657 1.549 4.706 (3.248, 6.816) <0.001 Underlying diseases (non-diabetes and non-hypertension as reference) Only hypertension 0.328 1.388 (0.915, 2.106) 0.123 0.328 1.388 (0.915, 2.106) 0.123 Only diabetes 1.095 2.990 (1.467, 6.086) 0.003 1.095 2.990 (1.467, 6.086) 0.003 Diabetes and hypertension 1.060 2.885 (1.430, 5.822) 0.003 1.060 2.885 (1.430, 5.822) 0.003 Note: Score test for the proportional odds assumption: Chi-square=0.607, df=3, p=0.895. Goodness-of-fit of overall model (Likelihood Ratio): Chi-square=111.47, df=5, p<0.001, Pseudo R2=0.1402.
Abbreviation: OLR=ordinal logistic regression, PPOM=partial proportional odds model.Table 2. Results of the effect of the influential factors for the severity of illnesses obtained by OLR PPOM from January 23, 2020 to February 25, 2020 in Yichang.
Influential factor Severe illness vs. Mild illness Severe illness vs. Moderate illness Moderate illness vs. Mild illness Coefficient OR (95% CI) p Coefficient OR (95% CI) p Coefficient OR (95% CI) p Intercept −0.4808 − 0.001 −1.738 − <0.001 1.273 − <0.001 Age (years) (0–64 years as reference) ≥65 years 1.260 3.524
(2.130, 5.933)<0.001 1.619 5.048
(3.406, 7.518)<0.001 −0.385 0.681
(0.421, 1.120)0.123 Underlying diseases (non-diabetes and non-hypertension as reference) Only hypertension 0.545 1.725
(0.905, 3.355)0.101 0.429 1.536
(0.919, 2.534)0.100 0.063 1.065
(0.599, 1.977)0.835 Only diabetes 1.623 5.069
(1.549, 22.841)0.014 1.077 2.937
(1.320, 6.411)0.007 0.547 1.727
(0.567, 7.499)0.390 Diabetes and hypertension 1.499 4.478
(1.407, 19.921)0.022 1.025 2.787
(1.285, 6.153)0.010 0.483 1.620
(0.506, 7.231)0.462 Hosmer-lemeshow goodness-of-fit test 0.614 0.380 0.980 Sample size 344 726 694 Abbreviation: BLR=binary logistic regression. Table 3. Results of the effect of the influential factors for the severity of illnesses obtained by three separate BLR models from January 23, 2020 to February 25, 2020 in Yichang.
-
This study aimed to explore the influential factors of the severity of COVID-19. The results showed that elderly patients with diabetes are more likely to suffer from severe illness, and there was no evidence of the association between either gender or hypertension and the severity. In clinical treatment, there are currently no effective medications, thus conventional adjuvant therapy, which aims to prolong the patients’ life while waiting for the host’s immune system of to fight off the virus, is the primary approach. These findings suggested that more attention should be paid to the elderly with diabetes as a key population of prevention and treatment.
These results were in accordance with the conclusion deduced from an epidemiological study that the average age of patients with severe illness were about 7 years older than that of patients with non-severe illness. Furthermore, the case fatality rate of patients who reported comorbid conditions was much higher than that of those without comorbid conditions (6). It is generally assumed that aging and underlying diseases that would weaken the immune system of patients resulted in patients being at greater risk of developing severe illness caused by this virus (7-8).
There were two explanations for this situation that patients with diabetes were inclined to develop the severe illness. First, adipocytokines, of which the secretion by adipose tissue was increased in diabetic patients, played a central role in immune dysregulation, thus the immune response was changed and immune aging was accelerated (7). Second, the major damage caused by COVID-19 occurred in the lungs (2). However, the innate and adaptive immunity in the pulmonary system in diabetic patients could be destroyed, which could lead to more severe damage in these patients (7). There was no evidence that patients with hypertension were at greater risk of suffering from severe illness, and similar results were reported in an analysis of risk factors of influenza A-associated severe pneumonia in hospitalized patients (9). The elderly tended to develop severe illness caused by the virus generally due to silent or obvious inhalation of virus-containing aerosol that could be increased by reduced cough reflex and the impairment of the immune system functions (10). Previous literature reported antihypertensive drugs that could induce cough could reduce the risk of severe illness, which may be a reasonable explanation to these findings to some degree (10).
This study is subject to at least a few limitations. First, since the data were collected through retrospective surveys, the causal effect of the influential factors on the severity of COVID-19 could not be derived. Second, using multiple separate BLR models for each pair of response variables should be cautiously used because the decrease in sample size could result in a loss of statistical power. The exploration of other influential factors for the severity of this disease with larger sample sizes warrants further studies.
The prevalence of diabetes in China had gone up to 6.2% according the results of global burden disease 2017, and the elderly with diabetes accounted for approximately 30% of the overall diabetic patients. Therefore, strengthening the protection for senior patients with diabetes against COVID-19 and the control of human-to-human transmission of this virus is of great public health significance, and we should implement a community-based education and surveillance program for this group.
HTML
| Citation: |

|