-
Coronavirus disease 2019 (COVID-19) is a respiratory infectious disease caused by COVID-19 virus, also know as SARS-CoV-2 and 2019-nCoV, that was first identified in Wuhan City, Hubei Province, China in December 2019. By April 24, 2020, COVID-19 has affected more than 2 million individuals and caused 15,000 deaths worldwide (1). Rapid and robust responses by the global scientific community described many key aspects of the transmission and natural history of COVID-19 (2), but the full spectrum of the epidemiological characteristics of the disease still require illustration; in particular, several key epidemiological parameters remain to be clarified.
In this study, we aimed to estimate serial interval, basic reproductive number (R0) of COVID-19, and the time-dependent reproductive number (Rt) using epidemiolocal data from 1,365 confirmed cases and 116 infector-infectee pairs in Jingzhou City, Hubei Province. Jingzhou City was the fourth largest city with confirmed cases in Hubei Province, which was the epicenter of the COVID-19 epidemic in China.
We obtained data of laboratory-confirmed COVID-19 cases and clusters from Jingzhou City CDC in Hubei Province, China, from January 1, 2020 to March 12, 2020. A laboratory-confirmed case was defined as a case with a positive test of COVID-19 virus using the real-time reverse transcription polymerase chain reaction (real-time RT-PCR) assay.
The serial interval was defined as the time between symptom onset in a primary case (infector) and a second case (infectee) in a transmission chain (3). The serial interval distribution was estimated from the time lag between all infector-infectee pairs (3). In this study, we selected infector-infectee pairs by the following criteria: 1) the infectee had a clear history of contact with the infector; 2) the infectee had no history of contact with other confirmed or suspected COVID-19 cases; and 3) the infectee had no history of travel or residence in an area affected by COVID-19 within 14 days before symptom onset. Criteria 2 and 3 were used to exclude those infector-infectee pairs in which the infector and infectee shared a common source of exposure to a COVID-19 case or a place where cases were identified. We fit the probability distribution of the serial interval with three methods named “gamma”, “Weibull”, and “lognormal”, and calculated the mean and standard deviation of serial interval using the best-fit method.
We assessed two types of different reproductive numbers: the basic reproductive number (R0) and the effective reproductive number (Rt). R0 was defined as the expected number of secondary infectious cases that one primary case will generate in a susceptible population (4). R0 is a key indicator of the transmissibility of disease. Rt is an indicator of real-time transmissibility of disease, which is frequently used to evaluate the effectiveness of disease control measures. In this study, we estimated R0 for COVID-19 using the maximum likelihood (ML) method (5) and exponential growth (EG) method (5) and evaluated the goodness of fit by coefficient of determination (R2). A higher R2 represents smaller differences between the observed data and the fitted values. We estimated Rt using a time-dependent method (5).
All statistical analyses and visualization were conducted using “R0” and “ggplot2” packages in R software 3.6.2 (R Development Core Team, Vienna, Austria). Two tailed p<0.05 was considered statistically significant for all statistical tests. To quantify the effect of parameters on R0, a series of sensitivity analyses were conducted by varying the mean serial interval and transmission start date. The R2 statistic was calculated to evaluate the goodness of fit of the model.
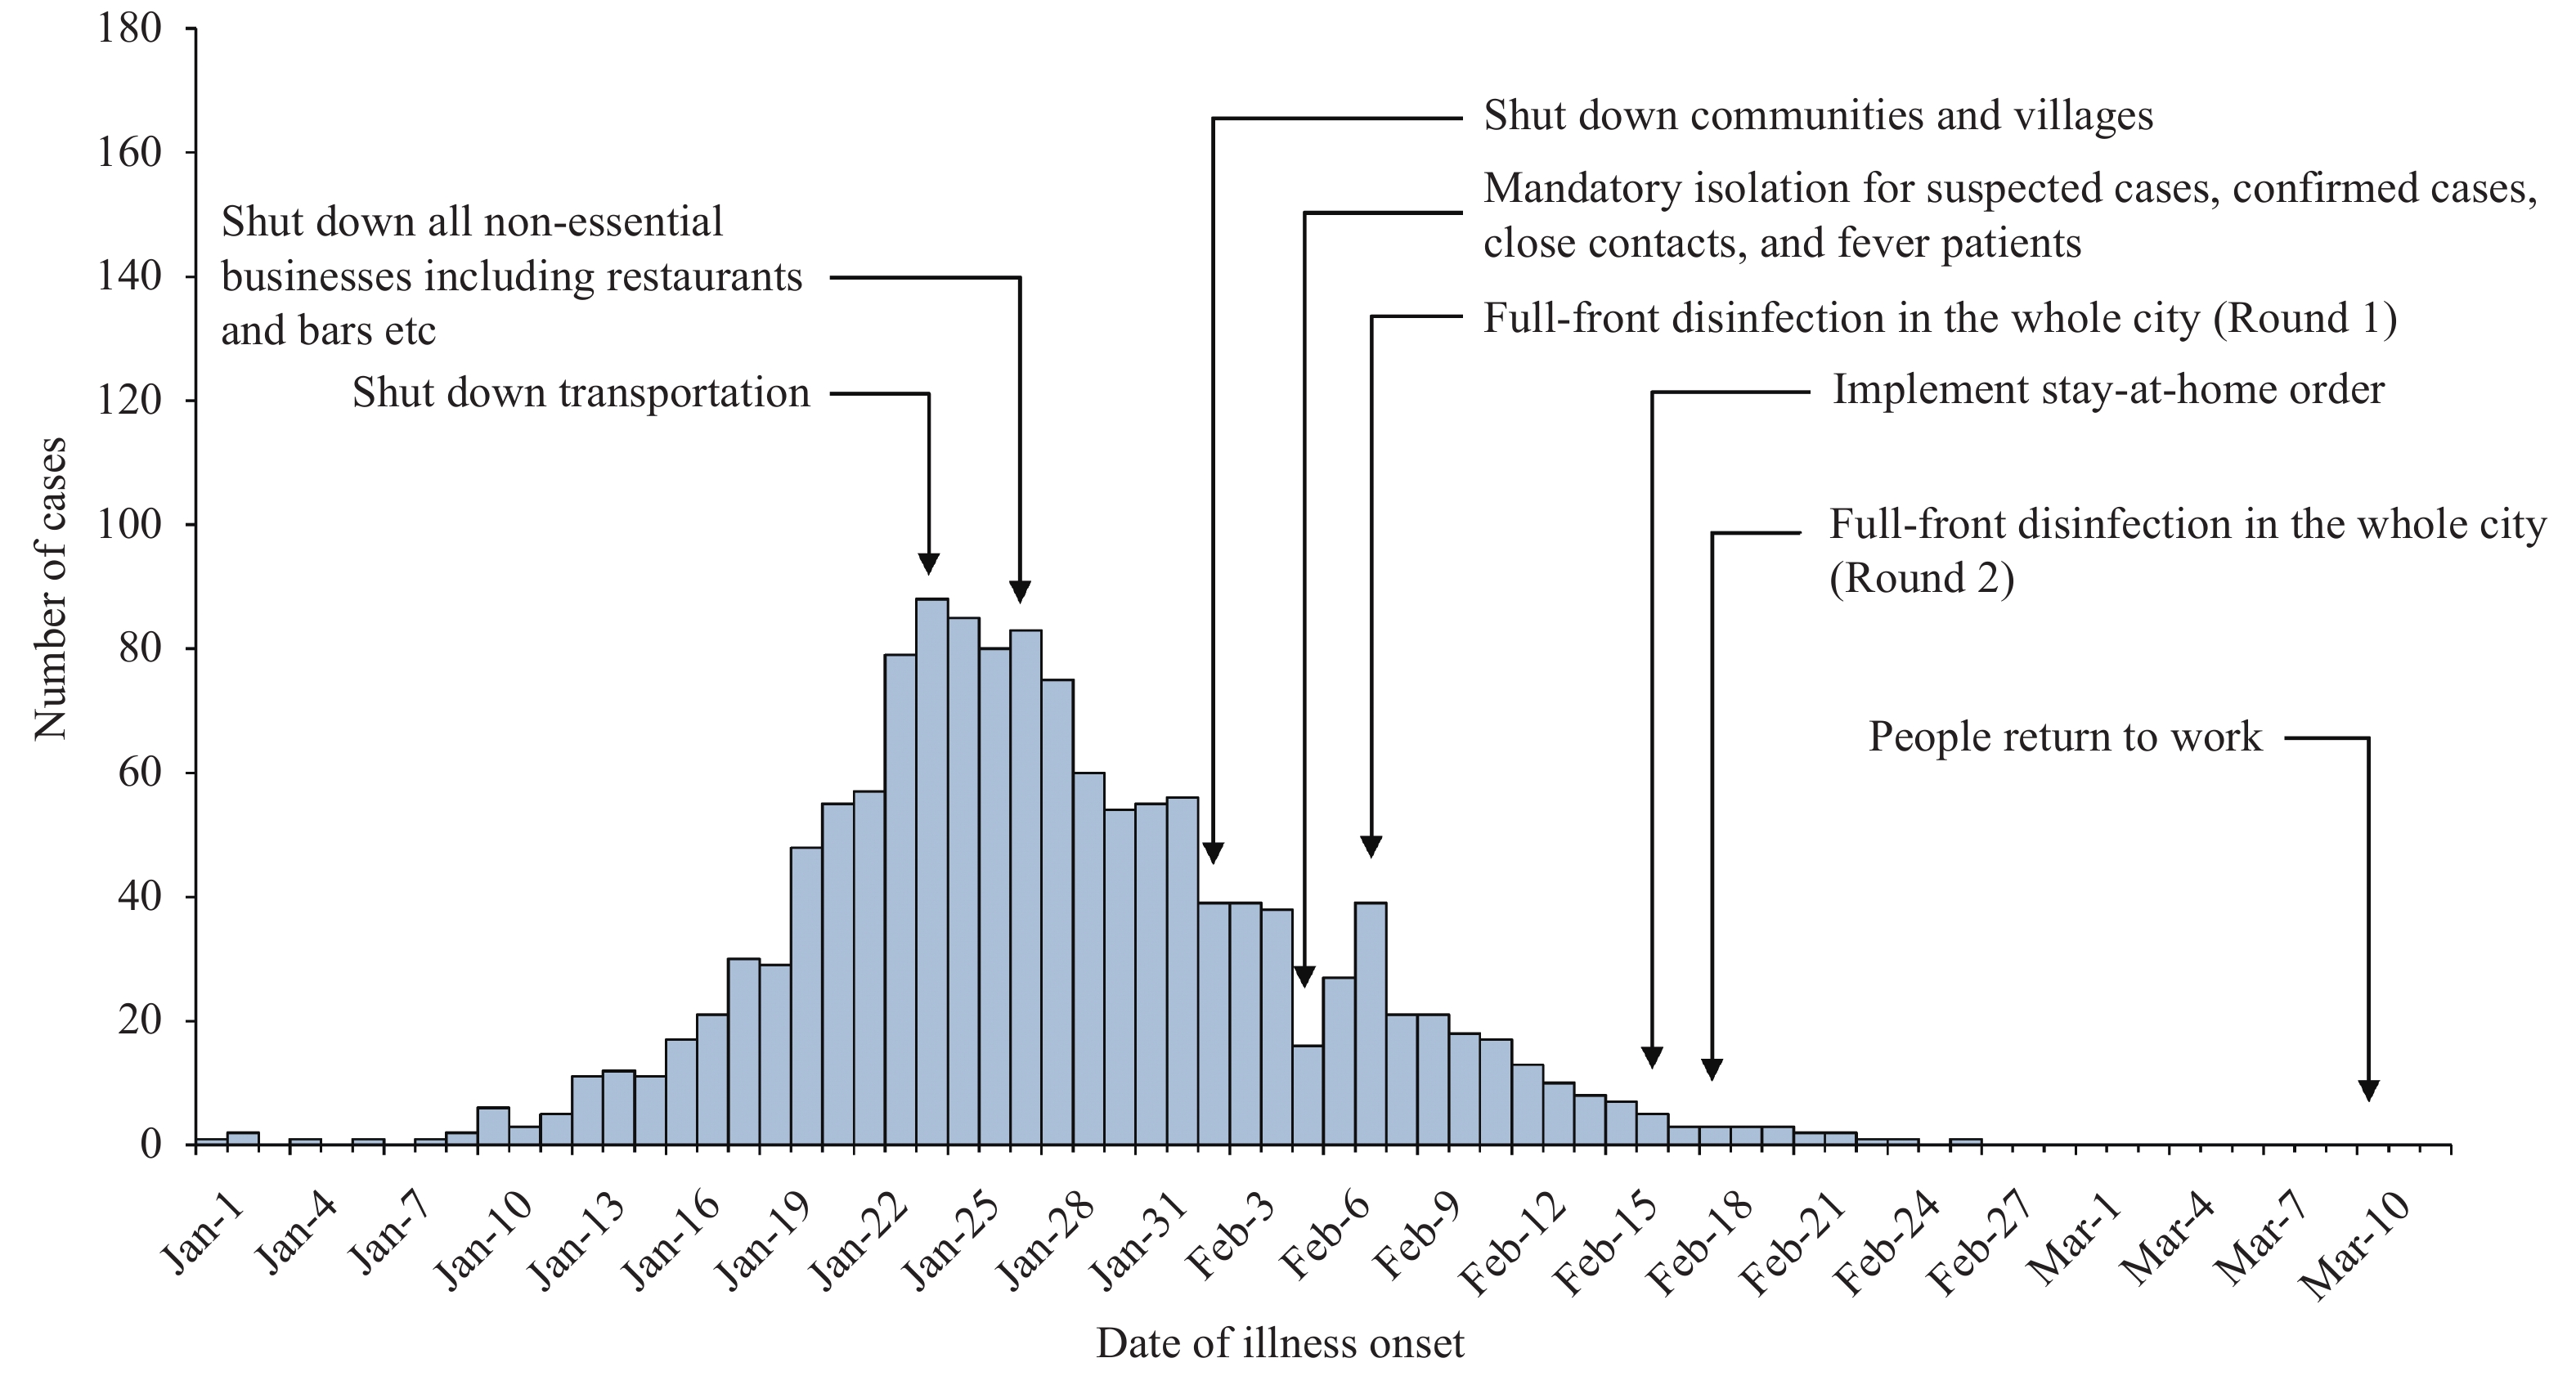
The first confirmed COVID-19 case in Jingzhou City was identified on January 1, 2020 with an average daily increase of 1–2 cases for the next 9 days. After that, the number of confirmed cases of COVID-19 started to increase rapidly to a total of 1,365 confirmed cases and 51 deaths reported as of March 12, 2020. The epidemic curve according to the illness onset date and key interventions date are shown in Figure 1.
 Figure 1.
Onset of illness among 1,365 confirmed cases of COVID-19 in Jingzhou City, Hubei Province, China.
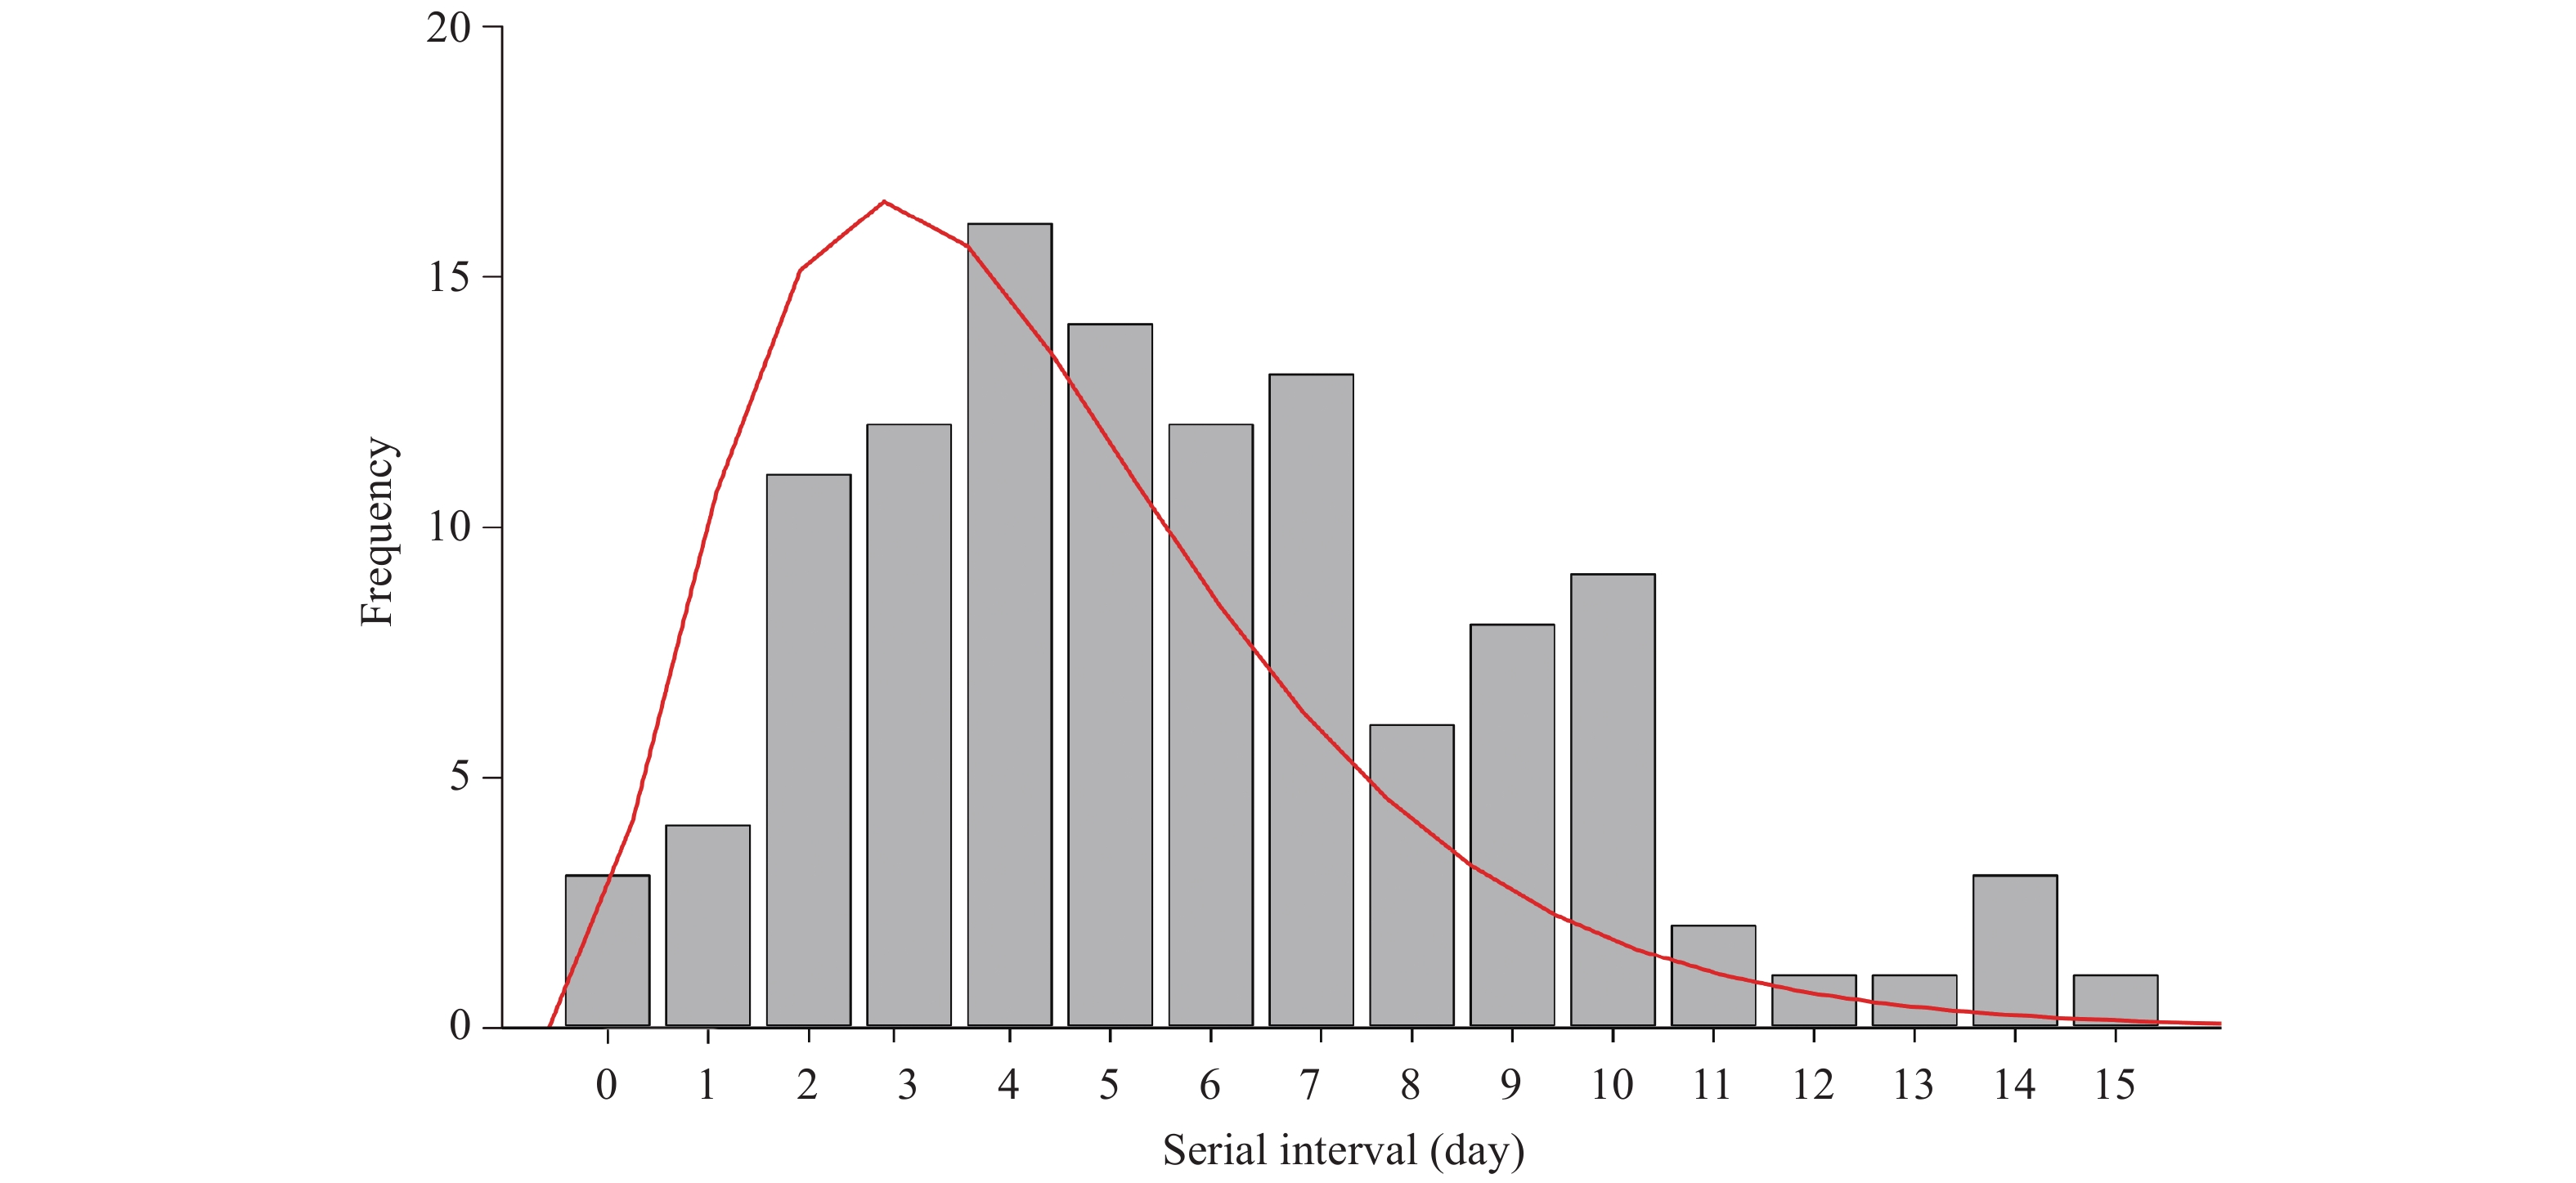
A total of 116 infector-infectee pairs that met with the inclusion criteria were included in our analysis. Gamma distribution performed better than the other two methods. The serial interval distribution of COVID-19 is shown in Figure 2. The mean serial interval of COVID-19 was estimated as 5.81 days (standard deviation: 3.24).
 Figure 2.
The distribution of serial interval of COVID-19 based on 116 infector-infectee transmission pairs in Jingzhou City, Hubei Province, January 1–March 12, 2020. The gray bars indicate the number of infector-infectee pairs with specified serial intervals, and the red line indicates the estimated serial interval distribution of COVID-19 infection.
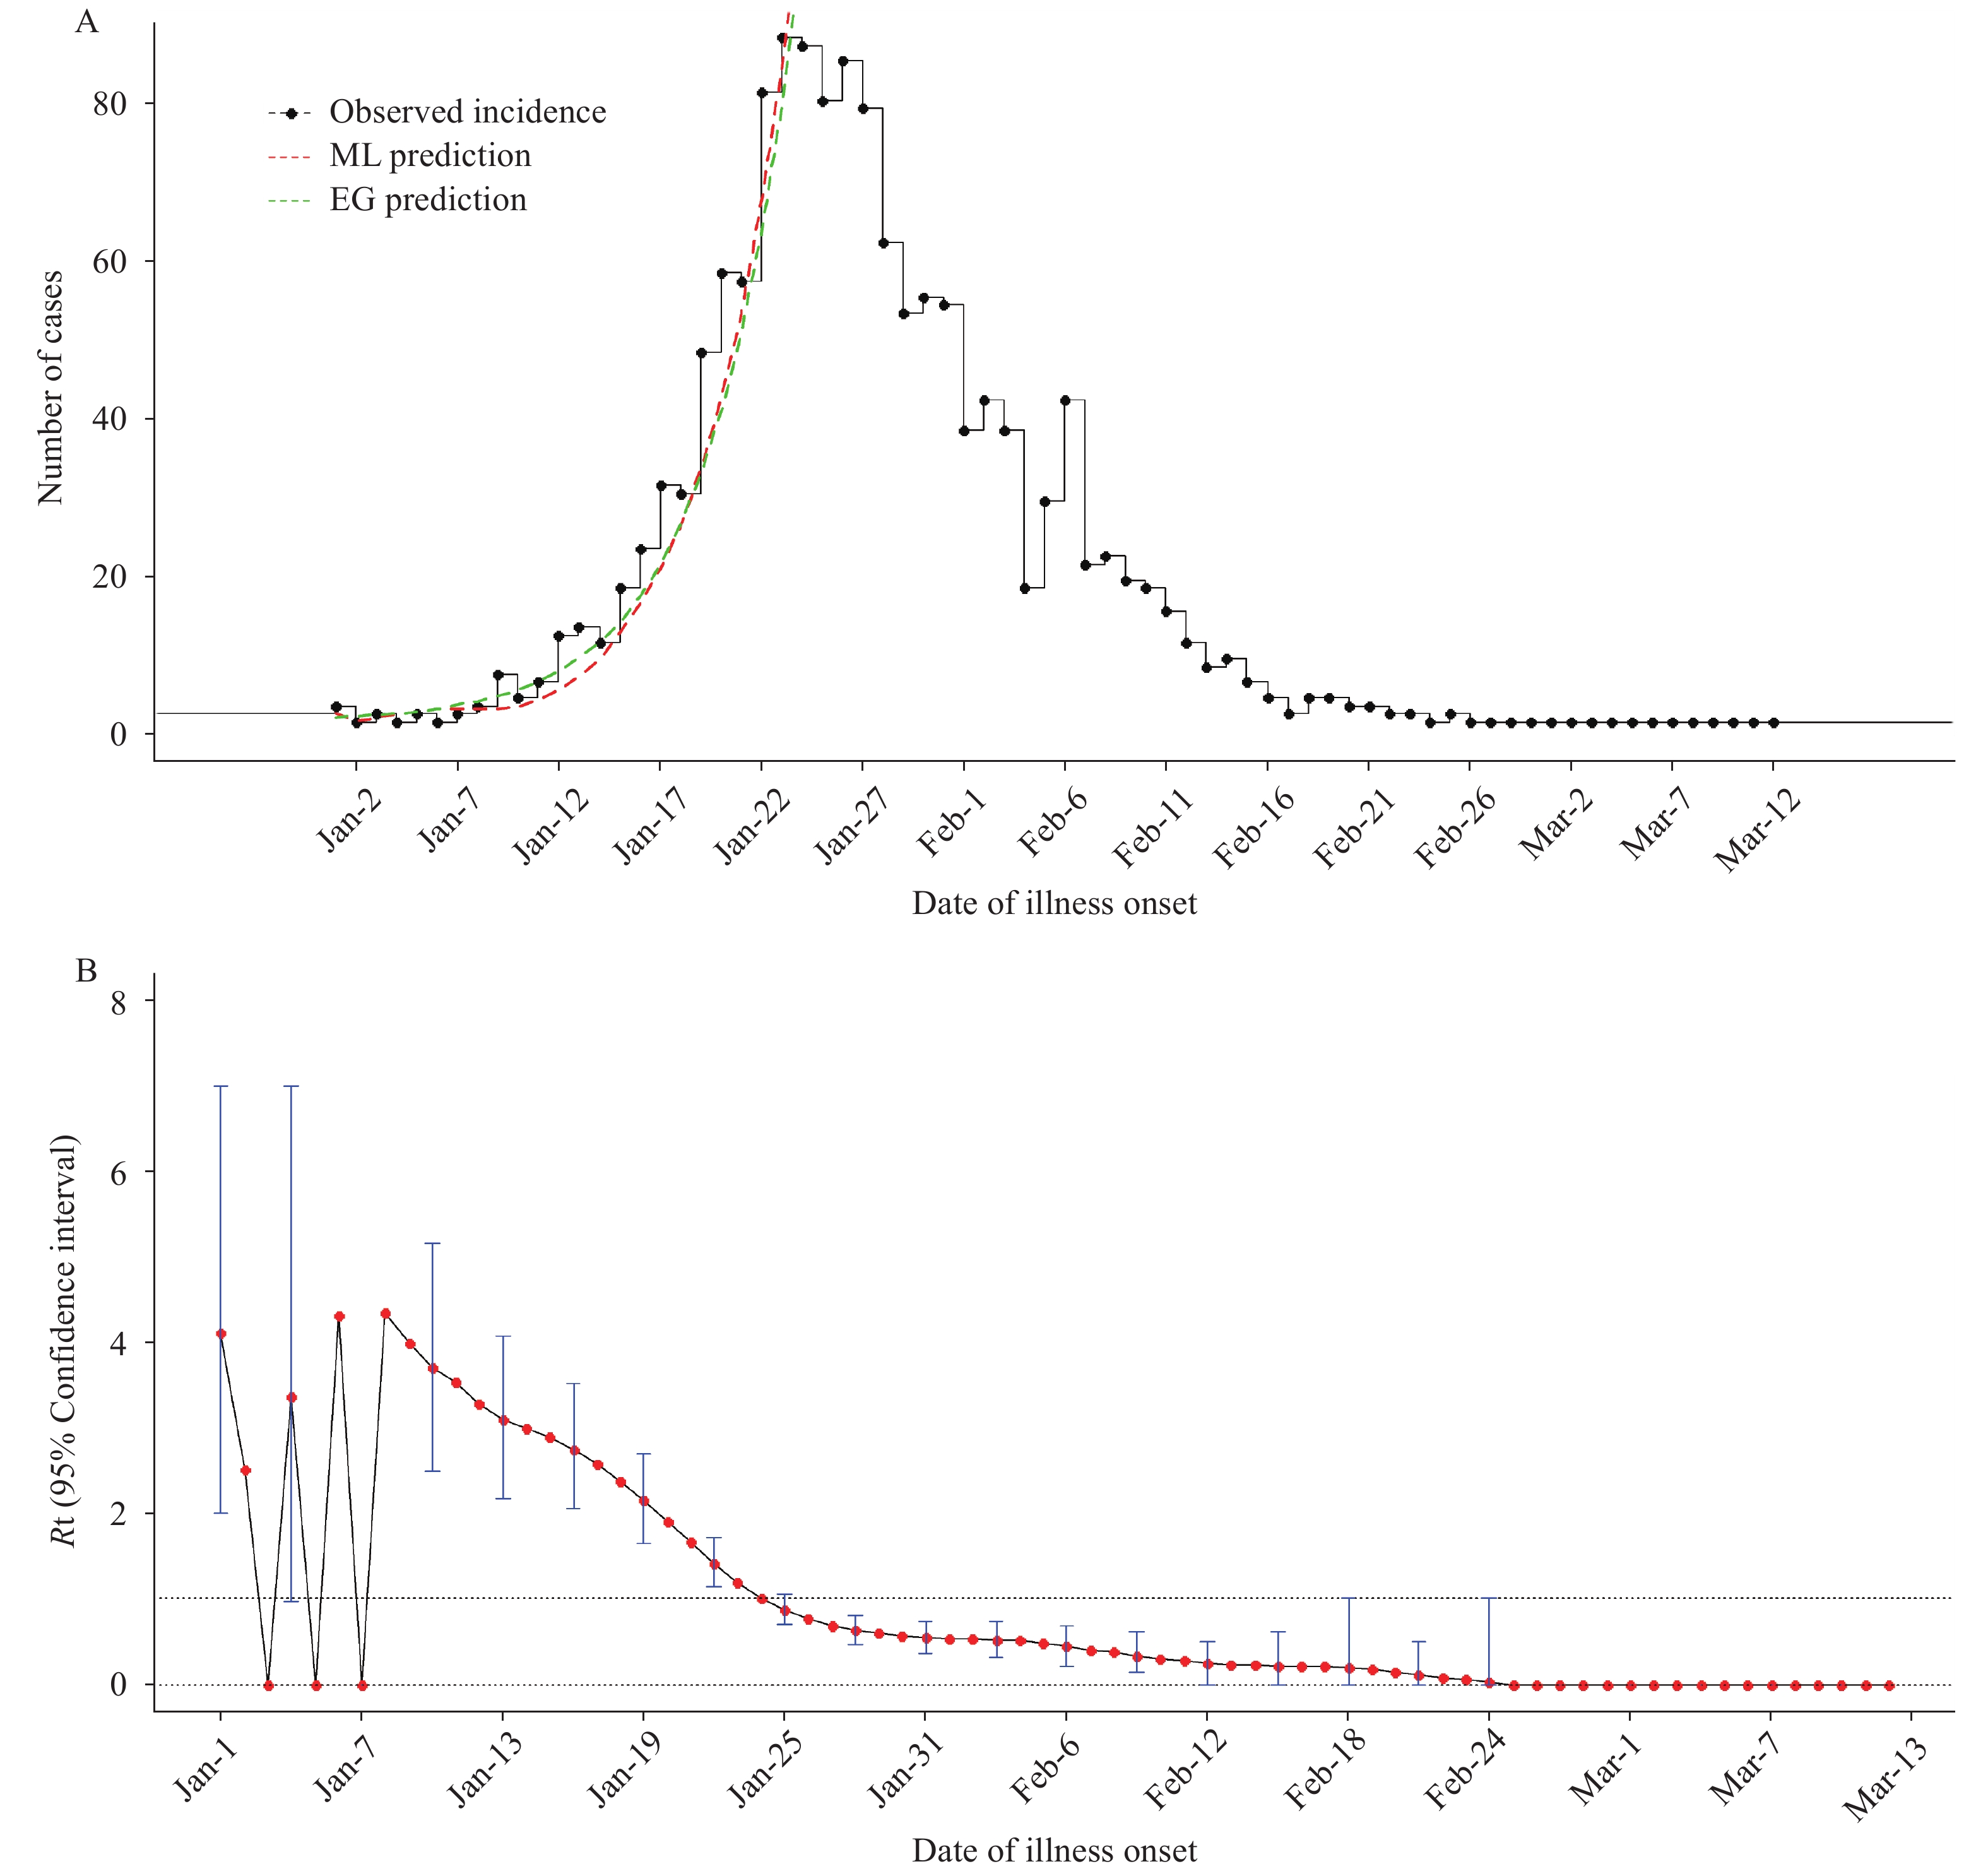
Using the serial interval distribution described above, we estimated that R0 was 2.98 (95% CI: 2.62–3.38) and 3.39 (95% CI: 3.07–3.75) by the ML and EG methods, respectively. The coefficient of determination (R2) of the EG model (0.97) was higher than that of ML (0.75), which represents smaller differences between the observed data and the fitted values (Figure 3A).
 Figure 3.
The fitted results in this study. (A) The observed incidence and fitted daily incidence by using the exponential growth model (EG) and maximum likelihood estimation (ML) methods. (B) The temporal distribution of time-dependent reproductive number (Rt) values of COVID-19 in Jingzhou City, Hubei Province. The red points represent mean Rt and the blue vertical bars represent 95% confidence intervals.
The time-dependent reproductive number (Rt) in the early phase of the epidemic was above 1, with the peak of 4.43 (95% CI: 1.00–9.00) on January 8, then showed declines and approached 1 on January 24 (Figure 3B).
The results of sensitivity analyses indicated the robustness of R0 estimation. The R0 estimated by EG method ranged between 2.12 (95% CI: 2.00–2.26) to 4.51 (95% CI: 3.97–5.13) when the mean serial interval increased from 1.5 and 5 days, all of which are significantly higher than 1. Moreover, R0 was estimated as 3.23 (95% CI: 2.88–3.64) by the EG method and R2 reached its peak when we simulated the transmission start date on January 9, 2020.
HTML
-
In this study, we estimated two important parameters of COVID-19 including serial interval and R0 using epidemiology data from Jingzhou City, Hubei Province. In order to estimate the serial interval more accurately, we set strict inclusion and exclusion criteria of infector-infectee pairs for analysis. The mean serial interval was estimated as 5.81 days (SD=3.24), which was higher than the estimate by Nishiura et al (4.6 days) (6) but lower than the early estimation in Wuhan City (7.5 days) (4). The difference in estimated serial intervals might be associated with different phases of the pandemic. The shorter serial interval of COVID-19 compared to SARS implies that contact tracing must be rapidly carried out to stop rapid replacement of case generation. Otherwise the number of cases is expected to quickly exceed capability of existing health and emergency response systems.
We estimated the R0 value of approximately 3.4 and 3.0 by using the EG and ML methods, meaning that on average, each patient had been spreading infection to more than three other people. Our estimation is comparable to several recent studies (4,7-9); the R0 value is also significantly larger than 1 and also much higher than that of SARS (10), which indicated a higher level of transmission. This discrepancy of R0 between COVID-19 and SARS may be partially explained by transmission patterns. Clinical evidence showed that asymptomatic cases or mild cases could effectively transmit COVID-19, which was different from SARS because most SARS cases were transmitted by “super spreaders”, and cases in incubation period and mild cases could not infected susceptible persons (7,11).
Furthermore, we found that the effective reproductive number was less than 1 after implementation of interventions, which indicated that tremendous joint efforts from the local government, healthcare workers, and the people in Jingzhou City had effectively reduced community spread of the disease. Therefore, containment measures should be implemented including rapid identification and isolation of cases, active contact tracing and quarantining, strict social distancing, community education, and precautions such as frequent hand sanitizing and the use of personal protection equipment (e.g. face masks), which were helpful for suppressing expansion of COVID-19 outbreak worldwide.
This was the first study to assess the serial interval of COVID-19 using more than 100 infector-infectee pairs that met strict inclusion criteria. The sample size was much greater than that of recent studies (4,6,8-9), which have less than 50 infector-infectee pairs.
This study was subject to some limitations. First, asymptomatic contacts may have been missed because RT-PCR tests were mainly provided for patients with fever in the hospital early on in the epidemic and due to the imperfect sensitivity of the RT-PCR test (12). Second, as in any active outbreak response, the data were collected by multiple teams under protocols that, by necessity, changed as the situation developed. Hence, there may be inconsistencies in the definitions. Finally, strict inclusion and exclusion criteria of the study may have affected the representativeness of the study sample.
Acknowledgments: We thank all patients, close contacts and their families involved in the study; as well as the frontline medical staff and public health workers who collected this critical data.
Conflict of interest: The authors declare that they have no conflict of interest.
Fundings: This work was supported by Chongqing Health Commission (grant number 2019GDRC014) and China Postdoctoral Science Foundation (grant number 2019M660754).
| Citation: |


 Download:


