

 Download:


-
Secondhand smoke (SHS) poses serious harms to human health. Currently, there are 316 million smokers in China, and about 740 million non-smokers are exposed to SHS (1). The number of deaths caused by SHS is more than 100,000 every year (2). The Regulation on Smoking Control in Public Places of Shanghai was implemented on March 1, 2010. To further strengthening the tobacco control, Amendment of the Regulation on Smoking Control of Shanghai was formally implemented on March 1, 2017, restricting smoking in all indoor public places. It is of great significance to understand the level and status of SHS exposure for the formulation of tobacco control policies and intervention strategies (3).
The data of this study was from the Shanghai Adult Tobacco Survey in 2018, which was conducted among the population aged 15 years and older. Multi-stage, geographically clustered sampling was used and covered 100 monitor points from 16 districts. A total of 3,250 families were sampled, and one individual was randomly selected from each family to complete the survey. The Global Adult Tobacco Survey (GATS) standard questionnaire was used and face-to-face survey was conducted, 3,112 individuals completed the survey (95.8%), and this study analyzes SHS exposure data. SHS exposure of non-smokers refers to exposure to tobacco smoke at least 1 day per week; SHS exposure at home and in public places refers to the proportion of participants, including smokers and non-smokers, who saw someone smoking, smelled smoke, or saw cigarette butts when visiting specific places in the past 30 days (1-3). The data was weighted according to the sampling method and analyzed using SAS software (version 9.3; SAS Institute, Inc. Cary, NC, USA) complex survey design.
The survey included 1,465 males and 1,647 females, and after weighted adjustment, male respondents accounted for 51.6% and female respondents 48.4%. For different age groups, the proportion of participants aged 25 to 44 years was the highest (41.4%), followed by those aged 45 to 64 years (32.3%), and the proportions of different genders and age groups in this study were similar to that of Shanghai overall (4), which indicated good representativeness of the sample data. In terms of education levels, participants with college degree or above accounted for the highest proportion at 40.8%. The highest proportion in terms of occupation was enterprise, business, and service personnel at 44.7%.
According to the survey, the SHS exposure rate of non-smokers among the age of 15 years and above in Shanghai was 46.7% (95% CI: 40.4%–53.0%) in 2018 and was higher in males (52.6%) than in females (42.8%). However, the proportion of women exposed daily was higher than men (p<0.001). Among different occupational groups, the exposure rate in enterprises, businesses, and service personnel was the highest (51.2%), followed by farmers (51.0%), and the unemployed (50.9%), all of which were above 50%; while medical personnel (38%) and teachers (16.2%) had a relatively lower exposure (p=0.026). The proportion of SHS exposure at home in the last 30 days was 23.5%, higher in males than in females (p<0.001); however, in the subgroup of non-smokers, the rate was a little higher in females than in males. Based on different age groups, the group aged 15–24 years had the highest exposure rate at 25.6%, followed by the group aged over 65 years at 21.2% (p<0.001). The differences were also significant among different educational levels with education level being inversely related to exposure rate from 24.5% to 8.8% (p<0.001) (Table 1).
Demographic characteristics Overall of non-smokers* (Rate [%] [95% CI]) Home† (Rate [%] [95% CI]) One day or above/per week Nearly everyday Overall Non-smokers Gender Male 52.6(44.8−60.4) 12.2(7.6−16.8) 28.4(23.6−33.3) 14.1(9.7, 18.6) Female 42.8(36.7−48.8) 15.1(11.7−18.6) 18.2(13.9−22.4) 17.8(13.6, 22.0) χ2 13.869 20.583 32.488 3.782 p value <0.0001 <0.0001 <0.0001 0.052 Age group 15–24 years 48.0(35.6−60.4) 13.5(5.6−21.5) 31.9(20.4−43.4) 25.6(15.4, 35.7) 25–44 years 48.5(42.1−55.0) 12.9(8.8−17.0) 17.5(13.4−21.6) 12.6(8.5, 16.6) 45–64 years 46.3(38.1−54.4) 15.7(11.4−20.0) 25.6(19.8−31.5) 14.9(9.8, 20.1) ≥65 years 40.8(34.4−47.2) 14.1(10.1−18.0) 28.3(23.5−33.2) 21.2(16.4, 26.0) χ2 3.123 0.541 18.864 18.315 p value 0.373 0.910 <0.0001 <0.0001 Educational level§ Primary school and below 42.1(35.0−49.3) 19.7(14.1−25.3) 34.3(27.0−41.7) 24.5(18.6, 30.5) Junior high school 53.2(45.7−60.7) 19.2(14.6−23.8) 29.5(24.1−34.8) 20.5(15.4, 25.5) Senior high school 47.4(37.3−57.5) 16.8(10.8−22.9) 24.8(19.1−30.5) 15.2(9.5, 20.8) College and above 43.8(36.6−51.1) 8.4(4.5−12.3) 12.6(9.5−15.7) 8.8(5.5, 12.0) χ2 7.393 18.290 117.126 50.076 p value 0.060 <0.0001 <0.0001 <0.0001 Occupation Farmer 51.0(34.5−67.6) 20.1(7.2−32.9) 36.7(22.9−50.5) 25.7(12.0, 39.5) Government/public institution personnel 49.5(36.2−62.8) 13.7(4.7−22.7) 18.2(7.3−29.1) 17.2(5.1, 29.3) Enterprise, commercial, service personnel 51.2(43.2−59.2) 12.4(7.6−17.2) 22.7(17.7−27.6) 13.1(9.1, 17.2) Teacher 16.2(3.2−29.2) − 5.6(0.0−14.1) 6.1(0.0, 15.5) Medical worker 38.0(19.5−56.5) 12.3(0.0−26.2) 13.2(2.2−24.3) 14.3(0.6, 27.9) Unemployed 50.9(34.5−67.3) 24.9(11.2−38.7) 28.9(16.1−41.8) 25.5(12.9, 38.1) Others 42.3(34.5−50.1) 14.8(10.2−19.5) 24.3(19.4−29.2) 18.4(13.0, 23.7) χ2 14.332 7.227¶ 14.425 11.739 p value 0.026 0.204 0.025 0.068 Total 46.7(40.4−53.0) 14.0(10.4−17.6) 23.5(19.2−27.7) 16.3(12.4, 20.3) * Refers to the frequency of non-smokers’ exposure to secondhand smoke per week.
† People who report that someone smokes in their home on a daily/weekly/monthly basis.
§ The educational level of respondents over 25 years old was only reported.
¶ The category that does not show results is eliminated, when doing Chi-square test.Table 1. Estimation of exposure of second-hand smoke overall and at home.
The proportion of SHS exposure in major public places were, from highest to lowest, 28.1% for restaurants, 17.3% for indoor workplaces, 12.1% for universities, 10.0% for government buildings, 7.7% for primary and secondary schools, 4.2% for medical institutions, and 1.8% for public transports. The proportions of SHS exposure of females in indoor workplaces, restaurants, public transport, and primary and secondary schools were lower than that of men (p<0.01). Different age groups, educational levels, and occupations were contributing factors that influenced the proportion of SHS exposure of indoor workplaces (Table 2).
Demographic characteristics Rate (%) (95% CI) Workplace Government buildings Healthcare facilities Restaurants Public transport Universities Primary and secondary schools† Gender Male 22.4(16.2−28.5) 10.9(5.2−16.6) 3.3(2.1−4.6) 32.7(27.1−38.2) 2.7(1.1−4.3) 17.1(5.4−28.7) 10.1(4.3−15.9) Female 11.5(8.3−14.8) 8.9(3.0−14.8) 5.0(3.0−6.9) 22.6(17.3−27.8) 0.8(0.3−1.4) 6.1(0.0−14.3) 5.2(1.8−8.5) χ2 24.067 0.345 2.272 10.997 8.387 2.285 4.214 p value <.0001 0.557 0.132 0.0009 0.004 0.131 0.040 Age group 15–24 years 16.5(6.1−27.0) − 4.5(0.0−13.4) 32.1(19.2−45.1) 1.6(0.0−3.9) 15.7(0.0−31.6) 13.8(0.0−28.0) 25–44 years 14.9(10.6−19.3) 12.5(6.0−19.1) 2.7(0.7−4.6) 27.5(21.5−33.5) 2.5(0.7−4.3) 10.1(1.5−18.6) 5.5(1.7−9.2) 45–64 years 25.5(18.3−32.8) 5.6(0.0−11.3) 4.4(2.6−6.2) 26.2(20.6−31.8) 1.1(0.4−1.9) 7.8(0.0−19.8) 7.0(2.2−11.8) ≥65 years 33.8(11.2−56.4) 7.4(0.0−16.3) 6.4(3.8−9.0) 29.6(22.9−36.3) 1.3(0.4−2.2) 16.8(0.6−33.0) 12.4(2.8−22.0) χ2 9.510 3.788 3.003 1.360 2.874 1.315 5.207 p value 0.023 0.151 0.391 0.715 0.411 0.726 0.157 Educational level§ Primary schools and below 38.7(23.4−54.1) 1.8(0.0−5.6) 6.7(3.7−9.7) 27.9(15.7−40.1) 5.0(0.0−10.8) − 3.2(0.0−7.9) Junior high
school29.8(20.6−39) 8.8(0.0−18.3) 4.8(2.4−7.2) 34.7(26.8−42.6) 0.9(0.0−1.7) 16.2(0.0−39.8) 10.0(2.5−17.6) Senior high school 20.5(12.2−28.9) 8.0(0.0−20.0) 3.0(1.3−4.7) 25.3(18.5−32.1) 1.0(0.2−1.7) 4.5(0.0−11.7) 6.3(0.3−12.2) College and above 12.7(8.6−16.7) 11.9(6.1−17.8) 3.6(1.3−5.8) 25.4(19.6−31.2) 2.2(0.4−3.9) 10.6(1.6−19.6) 5.1(1.2−9.0) χ2 35.508 1.327 4.517 6.173 7.577 1.901 3.162 p value <0.0001 0.723 0.211 0.104 0.056 0.387 0.367 Occupation Farmer 50.7(23.2−78.2) 5.1(0.0−15.0) 8.4(3.6−13.2) 29.4(8.2−50.6) 7.4(0.0−17.8) − 20.6(0.0−47.5) Government/public institution personnel 8.3(2.6−14.0) 15.2(4.4−25.9) 3.9(0.0−9.6) 21.9(10.7−33.1) 3.3(0.0−9.8) 7.9(0.0−23.8) 8.0(0.0−23.4) Enterprise, commercial, service personnel 20.1(14.7−25.5) 8.6(3.5−13.8) 2.4(0.8−4.1) 29.2(22.8−35.5) 1.7(0.4−3.0) 12.2(0.0−25.6) 5.2(1.4−9.0) Teacher 0.7(0.0−2.3) 25(0.0−72.6) 13.5(0.0−39.5) 27.2(0.0−57.8) − − − Medical worker − − 4.5(0.0−13.5) 18.0(1.9−34.0) − − − Unemployed 39.7(0.0−100.0) 24.6(0.0−69.7) 0.3(0.0−0.9) 28.8(9.7−48.0) − − 16.3(0.0−38.2) Others 14.8(8.4−21.3) 7.5(0.4−14.6) 5.0(3.1−6.9) 28.6(23.2−34.1) 1.4(0.3−2.5) 14.2(2.5−25.9) 10.5(3.1−17.9) χ2 23.246 4.951 8.620 2.569 4.736 0.226 4.030 p value 0.0003 0.422 0.196 0.861 0.192 0.893 0.402 Total 17.3(13.1−21.9) 10.0(5.4−14.7) 4.2(3.0−5.4) 28.1(23.5−32.6) 1.8(0.9−2.6) 12.1(4.4−19.8) 7.7(3.8−11.6) Note: Unweighted sample size less than 25, no results are shown. The category that does not show results is eliminated, when doing Chi-square test,
* People who have been to this kind of place in the past 30 days.
† Including primary school, middle school, high school, technical secondary school, vocational high school, etc.
§ The educational level of respondents over 25 years old was only reported.
Abbreviation: CI=confidence intervals.Table 2. Estimation of exposure to second-hand smoke in various indoor public places*.
HTML
-
This study indicated that the SHS exposure rate of non-smokers in Shanghai was 46.7% in 2018, which was significantly lower than that of 2016 (58.5%) (5) and also lower than the national average rate (68.1%) in 2018 (6). The highest rate of SHS exposure were among enterprises, businesses, and service workers and may be attributed to more opportunities for exposure due to the nature of their jobs, having more social activities and having been to more places in the last 30 days (in China, sharing cigarettes with others is often considered as a means of building social connections).
Although in Shanghai the current smoking rate in females was much lower than in males (0.8% vs. 19.9% in 2018), the rate of daily SHS exposure among non-smoking females was higher than that in males, which may be attributed to females potentially spending more time indoors where some people may smoke illegally or that women may be more sensitive to smoking behavior and tend to report it. When comparing the proportions of SHS exposure at home based on different characteristics, the exposure proportions were found to be highest in the group aged 15–24 years, or those with lower educational levels being accompanied by higher exposure proportions, which suggests that teenagers and young adults and the group with lower education were key groups affected by SHS.
The World Health Organization (WHO) suggests that achieving a completely smoke-free environment using legislation is the most effective measure to protect non-smokers from SHS (7) and can also encourage smokers to quit smoking (8). The Amendment Regulations on Smoking Control in Public Places of Shanghai had been formally implemented on March 1, 2017 and restricted smoking in all indoor places. In 2018, the law enforcement departments of tobacco control from all levels have made 235,483 inspections, and the number of cases resulting in fines increased by about 20% compared with 2017 and 40% compared with 2016. From 2016 to 2018, the incidence of smoking in the workplace also dropped significantly after the legislation, which was 34.4%, 16.3%, and 15.4%, respectively. The proportion of dissuading or enforcing laws against smoking increased year from 2016 to 2018, and were 40.8%, 46.6%, and 49.3%, respectively. The results of tobacco control has been improved remarkably (9). Similar to Beijing (10), SHS exposure in Shanghai is much lower than other domestic city without legislation (11-12).
Comparing the exposure of SHS before and after the implementation of the regulations (the year of 2007) in various places from 2016 to 2018 (Figure 1), it was found that the exposure dropped significantly after the implementation of the regulations (2017 and 2018) in public transports, medical institutions, indoor workplaces, restaurants, and primary and secondary schools. However, compared with that of 2017, the proportions of those who were exposed to tobacco smoke in the last 30 days in restaurants, government buildings, and universities resurged to a higher level, which was most likely due to weak enforcement of the regulations.
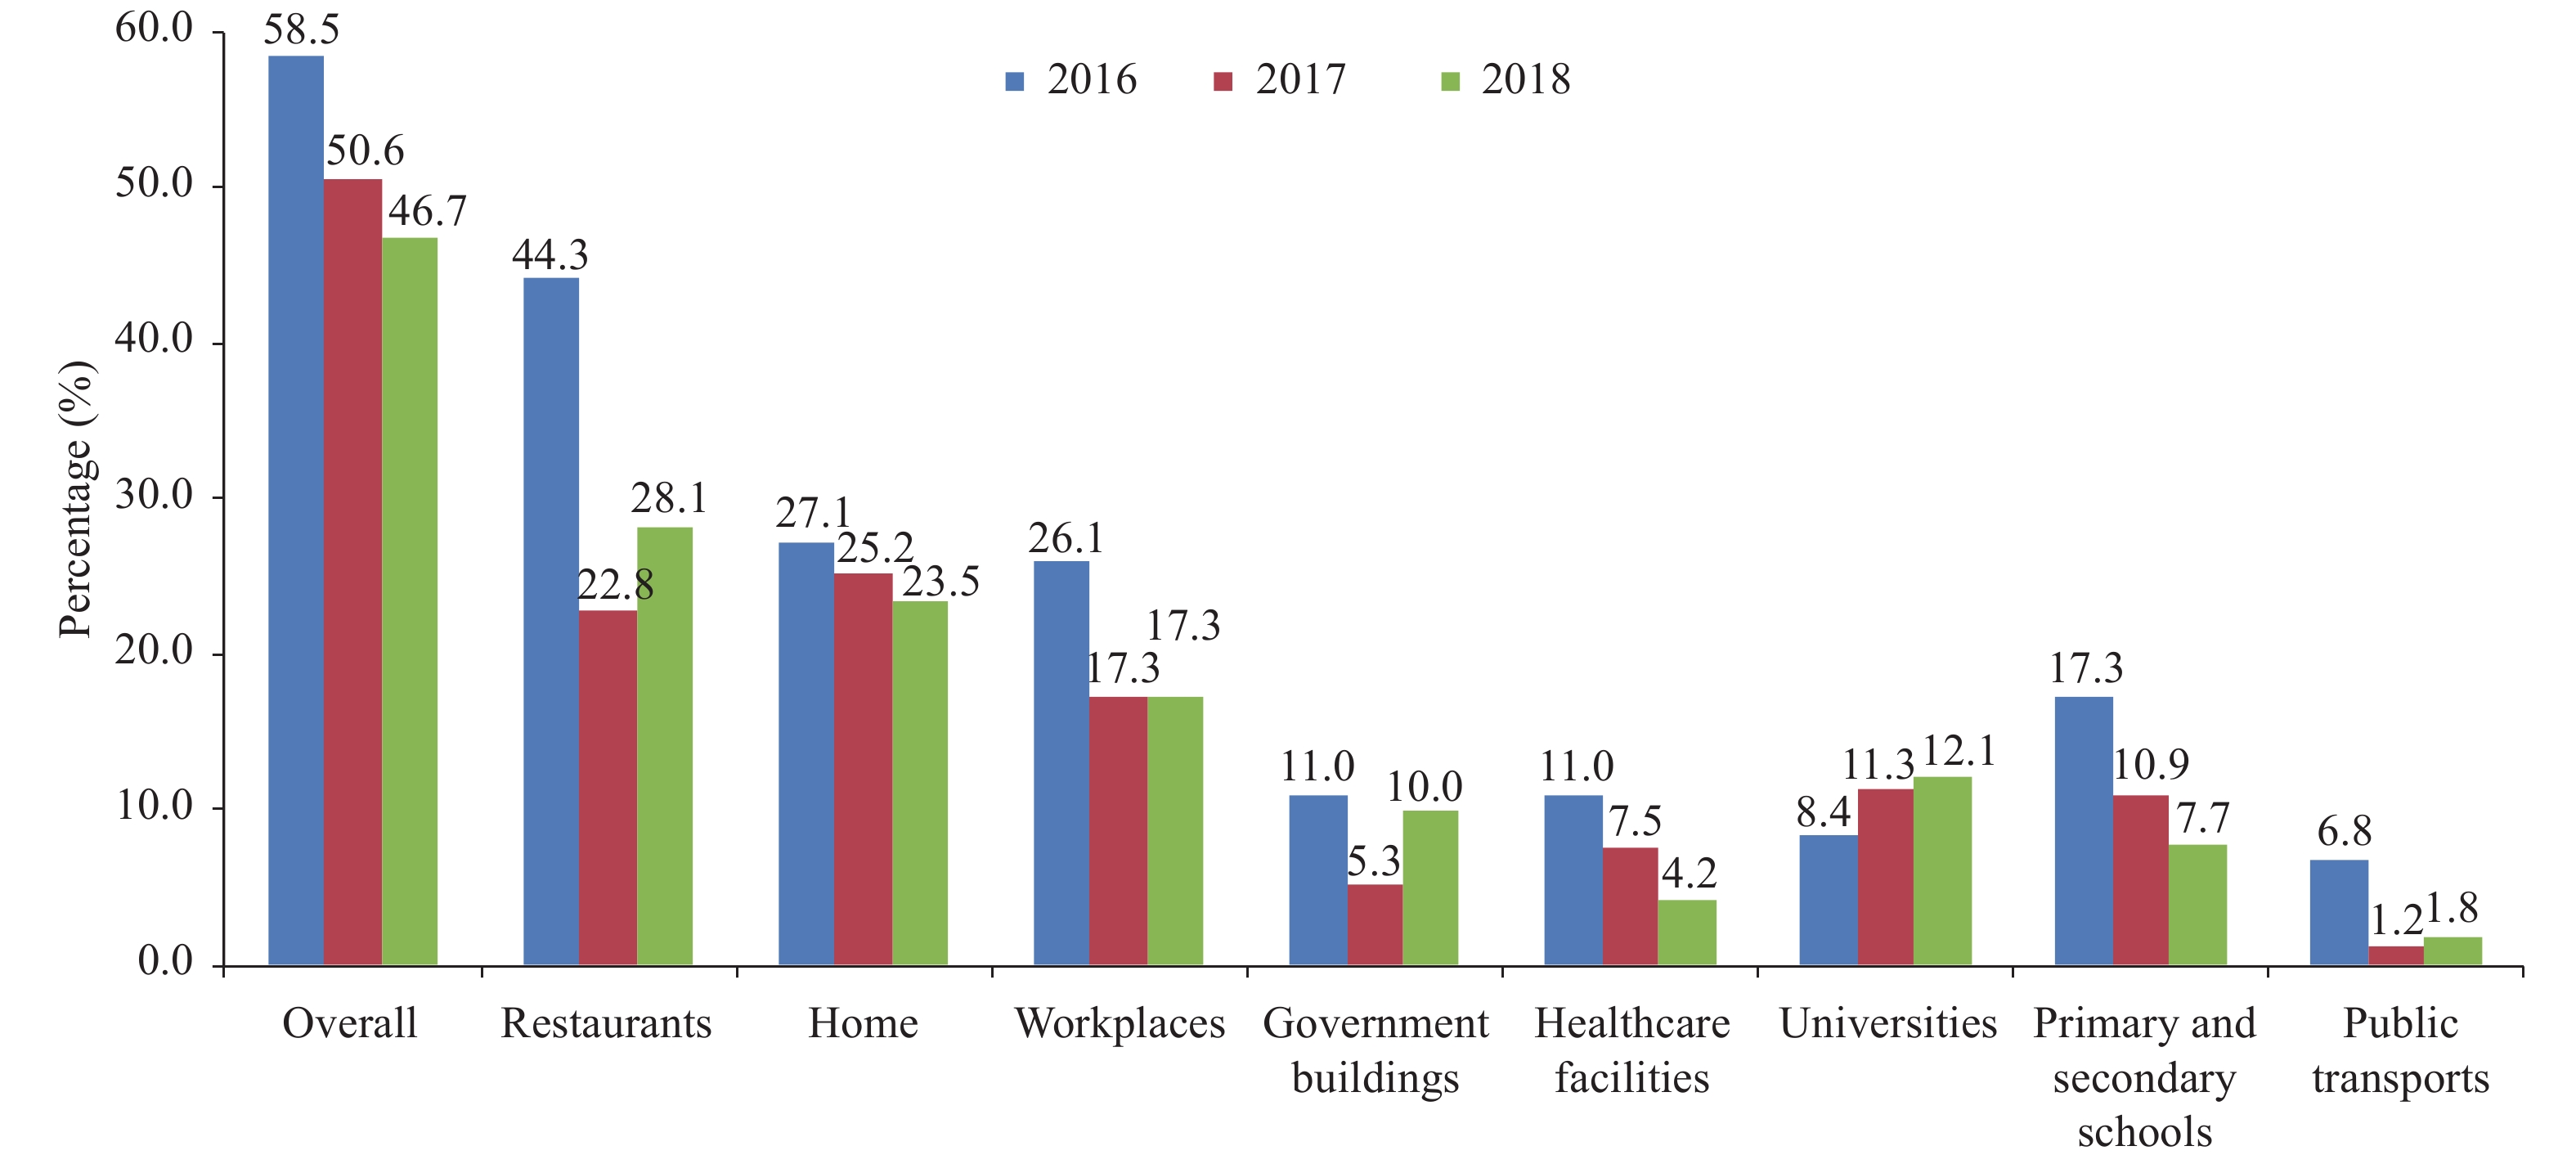 Figure 1.
Exposure to secondhand smoke inside various public places and overall, GATS Shanghai 2016–2018. Note: The studies used multi-stage, geographically clustered sampling and Global Adult Tobacco Survey (GATS) standard questionnaire, and the data was weighted according to the sampling method, which could represent Shanghai.
After one year’s implementation of the Amendment Regulation on Smoking Control in Public Places of Shanghai, the proportion of those who were exposed to tobacco smoke in last 30 days dropped overall and in most indoor places, but some indoor places, such as restaurants, which indicated that regulations enforcement and tobacco control guidance and training needed to be strengthened in addition to public self-discipline and heteronomy in tobacco control.
Acknowledgments: We thank the tobacco control office of Chinese Center for Disease Control and Prevention for their contribution to technical support. We also thank the health education department of Center for Disease Control and Prevention in all districts of Shanghai and all the staff involved in the investigation.
| Citation: |

|