

 Download:


-
Premature death among primary and secondary school students aged 6–18 years is an important public health issue in China. In this study, we used data from China’s Cause-of-Death Reporting System (CDRS) to estimate students’ mortality. In 2018, it was estimated that there were 28,519 student deaths between the ages of 6–18 years, with age-standardized mortality rate (ASMR) of 17.66 per 100,000. Substantial disparities existed among different sexes, age groups, areas, and regions. Drowning, road traffic injuries, and leukemia were three leading causes of death. Multisectoral efforts should be initiated to reduce premature death among students, especially those due to injuries.
Deaths in older children (5–9 years) and younger adolescents (10–14 years) have received little attention. The neglect of these groups are presumably associated with the fact that this is the age range during which human mortality risks reach their minimum but are not insubstantial (1). It was reported that there were approximately 1.23 million deaths among individuals aged 5–19 years worldwide in 2017 (2). Primary and secondary school students aged 6–18 years mostly consist of older children and adolescents. Estimating their mortality is of great necessity to identify health priorities for reducing premature death.
This report used deaths in 2018 as collected by CDRS. Detailed descriptions of CDRS have been reported elsewhere (3). After primary quality control, 512 out of 605 were identified as eligible disease surveillance points, with 1,822 thousand reported deaths, covering 272 million population. Individuals aged 6–18 years were extracted and stratified by sex, age group, occupation, area, and region. National data of total population and current students in primary and secondary schools were obtained from National Bureau of Statistics (4). International Classification of Disease, 10th revision (ICD-10) was used to re-classify cause-of-death.
Crude mortality rate was calculated by using deaths and the respective populations. In consideration of CDRS under-reporting, mortality rate was adjusted for under-reporting through following formula: mortality rate=crude morality rate/(1–under-reporting rate) (5). The Sixth National Population Census in 2010 was used for age-standardized mortality rate (ASMR) estimation (4). Estimated death count nationwide was generated through scaled-up aggregation data in each stratum acquired. Years of life lost (YLLs) is a measure of premature death calculated as the sum of each death multiplied by the standard life expectancy at each age (2). Software R (version 3.6.2, The R foundation for Statistical Computing) was applied for statistical analysis.
In 2018, a total of 45,385 deaths among individuals aged 6–18 years nationwide were estimated with 28,519 students and 16,867 non-students. The ASMR for those aged 6–18 years was 23.55 per 100,000 with students estimated at 17.66 and non-students at 54.13 per 100,000. Non-students showed higher ASMR compared with its counterpart in all age groups, especially for those aged 6–12 years (136.25 vs. 14.12 per 100,000). Deaths occurring in those aged 6–18 years were estimated to occupy 0.47% of total population and calculated YLLs constituted 2.19% of total YLLs in all age. (Table 1)
Age (Years) Education level* Age-standardized mortality rate
(per 100,000)Total population
(10,000)Estimated deaths Age-specific deaths/All-age deaths (%) Age-specific YLLs/All-age YLLs (%) Total Students Non-students Total Students Non-students Total Students Non-students 6−12 Primary school 19.61 14.12 136.25 10,568.86 10,093.70 475.16 20,730 14,256 6,474 0.21 1.02 13−15 Junior high school 27.03 22.46 55.51 4,386.04 3,780.05 605.99 11,855 8,491 3,364 0.12 0.54 16−18 Senior high school 28.88 25.78 32.35 4,314.39 2,279.49 2,034.91 12,458 5,876 6,583 0.14 0.63 Total 23.55 17.66 54.13 19,269.30 16,153.24 3,116.06 45,385 28,519 16,867 0.47 2.19 Abreviation: YLLs=Years of life lost.
* Education level for school students aged 6–18 years only.Table 1. Age-standardized mortality rate, estimated deaths in students and non-students aged 6–18 years in China, 2018.
Male students showed higher ASMR than female students (21.50 vs. 13.30 per 100,000). Rural areas showed a higher value than urban areas (19.72 vs. 14.28 per 100,000). Western regions showed the highest ASMR (22.07 per 100,000), followed by central regions (18.23 per 100,000) and eastern regions (14.07 per 100,000). Injury (52.87%) and non-communicable diseases (NCDs) (38.71%) contributed over 90% deaths to overall mortality in students. Drowning (2.93 per 100,000, 16.59%), road traffic injuries (2.74 per 100,000, 15.51%), and leukemia (1.37 per 100,000, 7.75%) were the three leading causes of death. (Table 2)
Item Sex Urban Rural Eastern Central Western Total Male Female Total Male Female Total Male Female Total Male Female Total Male Female Total Male Female All-cause 17.66 21.50 13.30 14.28 16.91 11.34 19.72 24.27 14.51 14.07 16.76 11.00 18.23 22.62 13.16 22.07 27.07 16.59 Injury 9.33 12.14 6.15 7.29 9.30 5.04 10.58 13.86 6.83 6.60 8.61 4.30 9.72 12.85 6.11 12.75 16.43 8.71 Drowning 2.93 4.34 1.33 1.92 2.93 0.78 3.55 5.20 1.67 1.86 2.76 0.82 3.20 4.56 1.63 4.16 6.37 1.73 Road traffic injuries 2.74 3.46 1.93 2.19 2.60 1.74 3.07 3.98 2.04 2.03 2.48 1.52 2.93 3.80 1.94 3.53 4.49 2.47 Suicide 1.10 1.31 0.86 1.11 1.24 0.96 1.09 1.35 0.79 0.86 1.23 0.43 1.05 1.21 0.86 1.49 1.54 1.44 Falls 0.91 1.10 0.69 0.83 1.07 0.56 0.95 1.12 0.76 0.62 0.73 0.50 1.08 1.43 0.67 1.13 1.28 0.96 Poisoning 0.50 0.53 0.47 0.30 0.29 0.30 0.62 0.68 0.56 0.37 0.36 0.37 0.43 0.48 0.37 0.76 0.82 0.70 Other injuries 1.15 1.40 0.88 0.95 1.18 0.69 1.28 1.53 0.99 0.87 1.05 0.67 1.03 1.36 0.65 1.68 1.94 1.40 Non-communicable diseases 6.83 7.79 5.75 5.72 6.28 5.09 7.52 8.70 6.16 6.21 6.91 5.42 7.01 8.12 5.72 7.53 8.70 6.24 Leukemia 1.37 1.61 1.11 1.17 1.31 1.00 1.50 1.78 1.17 1.39 1.60 1.14 1.47 1.73 1.16 1.25 1.48 1.01 Cardiovascular diseases 1.05 1.24 0.83 0.94 1.00 0.88 1.11 1.38 0.81 1.01 1.24 0.74 1.03 1.10 0.95 1.13 1.38 0.85 Congenital abnormality 0.82 0.90 0.74 0.81 0.77 0.86 0.83 0.98 0.66 0.57 0.63 0.50 1.03 1.19 0.84 0.97 0.98 0.96 Nervous systems diseases 0.76 0.87 0.63 0.48 0.59 0.36 0.93 1.04 0.79 0.62 0.73 0.50 0.77 0.93 0.58 0.94 1.02 0.85 Respiratory diseases 0.50 0.50 0.50 0.33 0.36 0.29 0.61 0.59 0.64 0.39 0.43 0.35 0.42 0.35 0.49 0.74 0.76 0.72 Immune system diseases 0.26 0.25 0.27 0.19 0.15 0.24 0.30 0.30 0.29 0.25 0.15 0.35 0.28 0.30 0.26 0.25 0.32 0.18 Digestive system diseases 0.17 0.15 0.19 0.10 0.09 0.10 0.22 0.19 0.25 0.13 0.08 0.19 0.10 0.15 0.04 0.30 0.26 0.35 Other malignant tumor 1.90 2.27 1.48 1.71 2.01 1.37 2.02 2.43 1.55 1.86 2.04 1.66 1.92 2.36 1.40 1.94 2.52 1.31 Communicable diseases 0.31 0.32 0.30 0.20 0.21 0.19 0.38 0.39 0.37 0.22 0.20 0.24 0.29 0.35 0.22 0.47 0.48 0.46 Infectious & parasitic diseases 0.31 0.32 0.30 0.20 0.21 0.19 0.38 0.39 0.37 0.22 0.20 0.24 0.29 0.35 0.22 0.47 0.48 0.46 Others 1.18 1.24 1.11 1.07 1.12 1.02 1.24 1.32 1.16 1.04 1.05 1.04 1.22 1.30 1.12 1.33 1.46 1.18 Table 2. The age-standardized mortality rate (per 100,000) of primary and secondary school students aged 6–18 years in China, 2018.
The ASMR of students varied as age changed. The ASMR of drowning reached its peak in primary school students with downward trends in junior high school students. Following a similar trend as age increased, suicide mortality came reached its peak in secondary school students aged 15 years and older. For other conditions, a comparatively stable trend was observed in adjacent ages such as road traffic injuries, falls, poisonings, and most NCDs. Female students showed more frequent mortality fluctuations in comparison with male students, especially for malignant tumor after 13 years. (Figure 1)
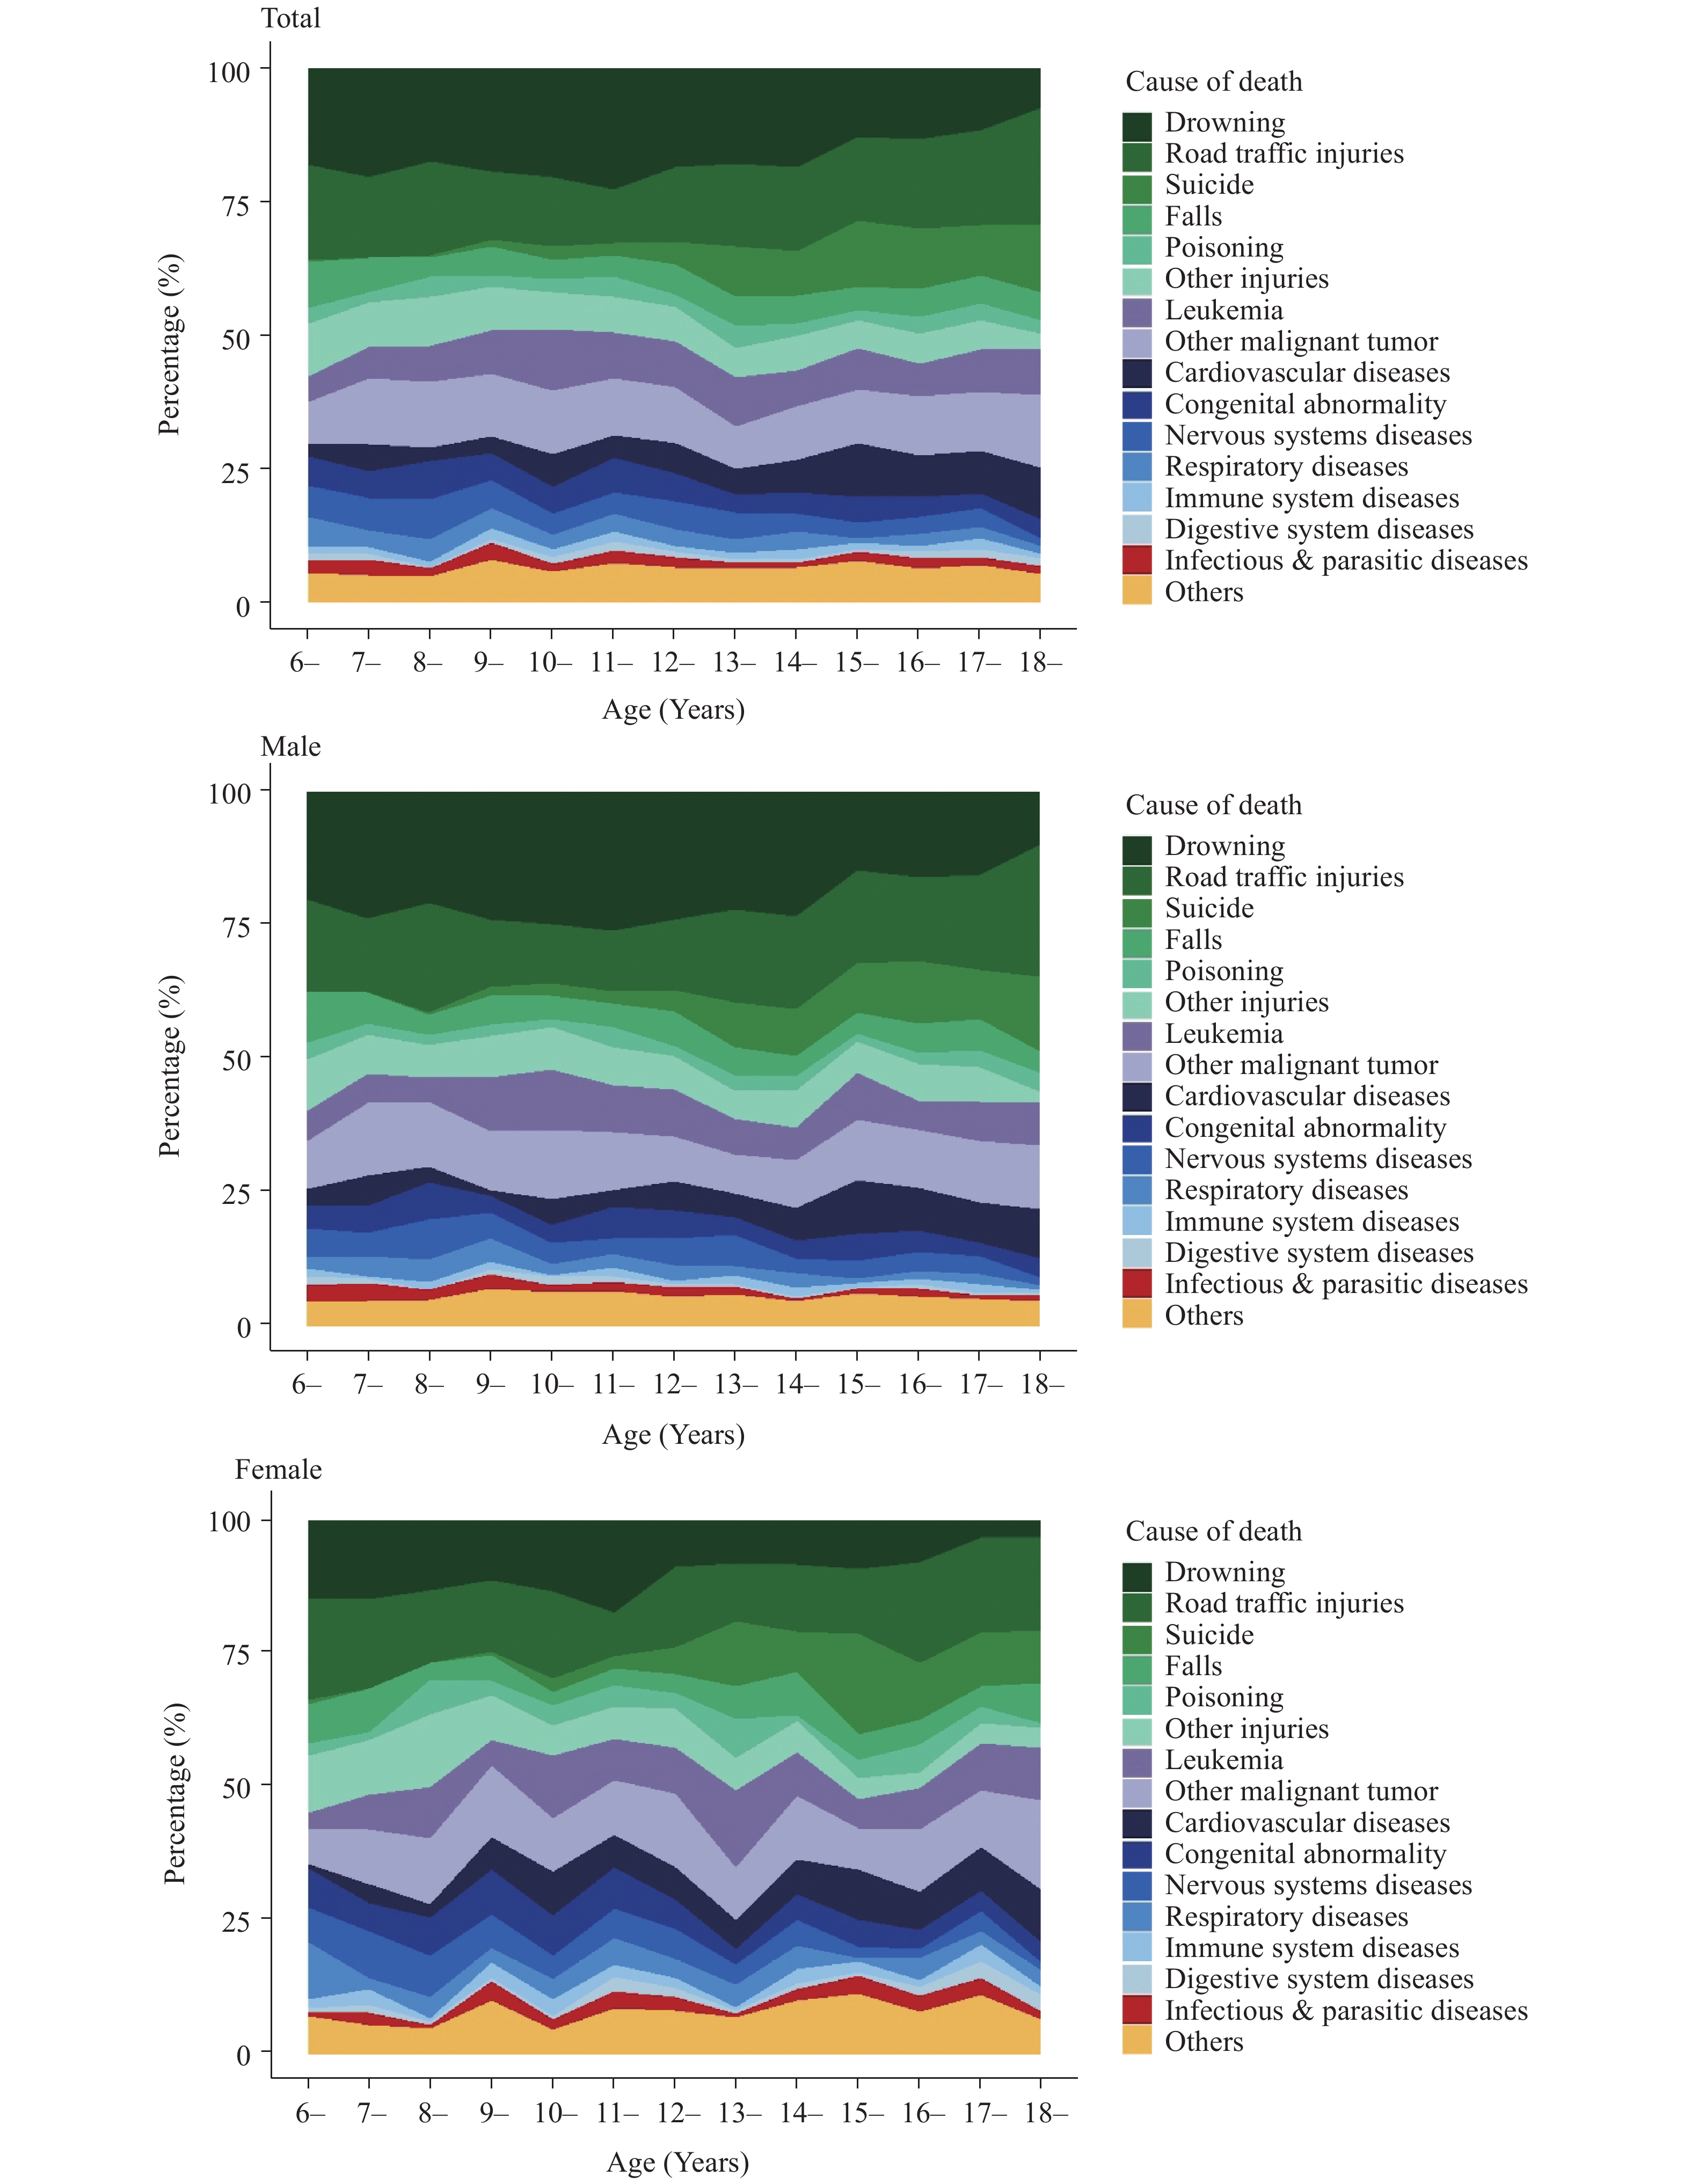 Figure 1.
Sex and age differences in mortality in primary and secondary school students aged 6–18 years in China by cause-of-death, 2018.
HTML
-
This study presents an up-to-date overview of mortality among primary and secondary school students aged 6–18 years in China in 2018. Differences in ASMR was noticed among students and non-students, especially for those aged 6–12 years for primary school. The health gap was large in relation to dropout, which was presumed to be induced by socio-economic structural transformation, household unemployment and poverty, as well as stereotype conventions. For disadvantaged groups who encountered obstacles for education and suffered from inferior health conditions such as migrant, left-behind, disabled, and impoverished children, providing economic support, promoting universal health coverage, and popularizing compulsory education could be effectively reduce premature death in non-students (6). The results concerning the age-specific percentage of deaths and YLLs were consistent with the Global Burden of Disease 2017 (GBD2017) (2). Given the five times higher age-specific YLLs percentage compared to deaths, the value of health losses occurring in the youth were inferred to be considerately higher than that of the elderly, which reminds of the urgent need to prevent premature death in order to minimize social labor force damage.
Obvious mortality disparities in population distribution and geographical patterns could be found among primary and secondary school students aged 6–18 years. Sex differences could be primarily driven by variations in exposure prevalence to cause-specific risk factors, particularly for injury (6). It was reported that intrinsic characteristics with aggressive and adventurous spirits in boys made them inclined to actively encounter hazards, and in the absence of cognition and self-control, they tended to experience more injuries than female students (7). Suicide was a typical condition that increased considerately with age, which brings attention to issues of mental health in senior high school students (6). A higher ASMR in remote areas was consistent with previous studies (8). Reasons could be partially attributed to economic involvement, healthcare coverage, infrastructure assurance, effective guardian supervision, and education popularization in developed areas and regions. For example, students in developed areas were inclined to receive multi-source health protection and security training, including courses taught by professionals from health, transportation, and fire-fighting departments (8).
Injury was the leading cause of death among students. Premature death as a result of unintentional injuries were discussed at length in most studies, with the majority deemed preventable (6). A “5E comprehensive strategy”, which covers education, environmental modification, engineering, enforcement, and evaluation, was introduced for injury control and prevention worldwide to effectively reduce injury incidence and mortality (6). NCDs also accounted for a large proportion of student mortality, most of which might be explained by biological factors, inferior living environments, and unhealthy lifestyle; for instance, leukemia was regarded as being related to indoor environment pollution caused by household decorations (7). Although premature death caused by communicable diseases seemed to not be so substantial, guardians should still take precautions as existing risk factors continued to rise and potential new risk factors emerge. Planned immunizations would be an effective approaches in preventing many communicable diseases (9).
During past years, several programs for protecting and promoting children’s health have been launched and yielded profound benefits. Related clauses were embodied in legislations and regulations, like “The Law of Education”, “The Law of Protection of Juveniles”, “The Law of Road Traffic Safety”, “China Children’s Development Outlines”. With multi-sectional cooperation at its burgeoning phase, measures such as health literature advocacy, regular lifestyle development, and mental health establishment were provided for students in some regions (6). Nevertheless, enforcement was a demanding bottleneck. Due to the complexity of multi-sector enabler management, such as health, education, security, transportation, and urban construction, no specific department or agency was assigned to centralize and coordinate the efforts of societal partners to work together (10). Therefore, the government should maintain a leading role to present strategies that aim to eliminate modifiable risk factors for early intervention, such as providing financial and technical support, implementing enforcement for legislation and promoting community engagement, especially to narrow the gaps between developed and remote areas and considerable differences between subgroups at different ages. These initiatives could, in return, inform individual-level change, decrease the demand on tertiary services, and operate effectively to reduce premature death among students (9).
The findings of this study were subject to some limitations. Ascertainment bias in cause-of-death diagnosis remained the greatest concern, which required correction for redistribution algorithms for implausible diagnostic codes (2).
Understanding mortality in primary and secondary school students remained as an essential concern in effectively reducing premature death. This study helped to identify heterogeneity in mortality patterns and is of great value for tailoring priorities to promote students’ health in China.
| Citation: |

|