-
The rates of new diagnosis of HIV/AIDS have rapidly increased and HIV/AIDS has become a major public health concern in China (1). In most countries, the morbidity and mortality of HIV/AIDS were higher in males than in females and were higher in the younger population than in the older population. While prevention of HIV/AIDS in younger populations have been prioritized in the past (2-3). The prevalence of HIV/AIDS among older adults (≥60 years) has grown faster than that of younger groups and received less attention. Using data from the Chinese Notifiable Infectious Disease Reporting System (CNIDRS), China CDC analyzed rates of annually diagnosed infections during 2007–2018. Across the 12-year period, the rate of new diagnosis of HIV/AIDS increased 3.26 times (from 4.95 to 16.15 per 100,000) among males and increased 2.18 times (from 2.30 to 5.01) among females. Among older adults aged ≥60 years, the new diagnosis rate increased 10.31 times (from 2.17 to 22.37) among males and 10.81 times (from 0.57 to 6.16) among females. Because surveillance data can help develop prevention efforts, understanding the magnitude and trends in HIV among different sex and age groups is important for improving HIV prevention strategies.
Data from CNIDRS were analyzed to assess HIV/AIDS trends. CNIDRS is a passive notifiable infectious disease case reporting system with nearly 170,000 system users distributed across the country. Medical doctors at all levels of hospitals were obligated to report all newly diagnosed HIV/AIDS cases to this system. We issued a Standard Guide of Case Reporting and carried out regular supervision and annual training at the county level for data quality control. The CNIDRS has set certain logic restrictions for data entry and conducts checks for case duplication across the whole country every month. Therefore, even though some underreporting or duplication of reported HIV/AIDS cases is inevitable, such cases should not significantly alter the data.
Data were stratified by sex and 10-year age groups (0–9, 10–19, 20–29, 30–39, 40–49, 50–59, 60–69, 70–79, and ≥80 years). Crude annual rates of newly diagnosed HIV/AIDS per 100,000 population and the observed annual rates of newly diagnosed HIV/AIDS, including rates categorized by sex and age group, were calculated. The Joinpoint Regression Program (version 4.6.0; National Cancer Institute) was used to model rates and test time trends. Annual percentage change was calculated to estimate the magnitude and direction of trends across the study period. Data processing and other analyses were conducted using R version 3.5.1 (The R Foundation for Statistical Computing).
From 2007–2018, a total of 1,103,668 HIV/AIDS cases were reported in CNIDRS (Table 1). Compared with females, males experienced higher rates of newly diagnosed HIV/AIDS (10.01 vs. 3.45 per 100,000). On average, the highest rates of newly diagnosed HIV/AIDS (16.63, 95% CI①: 16.39–16.88) were found in males aged 30–39 years. The lowest rates were found among females aged 80 years and above (0.37, 95% CI: 0.27–0.50).
Sex/Age group (years) No. of HIV/AIDS case (%) Average annual rate* (95% CI) No. of joinpoints Joinpoint year range APC Modeled rate range Overall % change in modeled rate range Total, ALL 1,103,668(100.0) 6.81(6.77−6.86) 0 2007−2018 10.1† 3.8−10.9 189.4 Male, ALL 831,057(75.3) 10.01(9.93−10.08) 0 2007−2010 10.1† 5.1−6.8 33.5 1 2010−2015 13.9† 6.8−13.0 91.7 2 2015−2018 7.4† 13.0−16.1 24 Female, ALL 272,611(24.7) 3.45(3.41−3.50) 0 2007−2009 10.6† 2.4−2.9 22.6 1 2009−2016 4.4† 2.9−3.9 35.4 2 2016−2018 13.2† 3.9−5.0 27.9 Total, 0−9 9,367(0.8) 0.49(0.46−0.53) 0 2007−2016 -2.8 0.5−0.4 -23.1 1 2016−2018 42.1 0.4−0.8 102.5 Total, 10−19 32,204(2.9) 1.55(1.49−1.61) 0 2007−2010 11.0 0.6−0.9 35.9 1 2010−2015 25.0† 0.9−2.7 206.9 2 2015−2018 -0.1 2.7−2.6 -0.7 Total, 20−29 280,789(25.4) 10.35(10.22−10.49) 0 2007−2012 1.2 8.4−8.9 6.1 1 2012−2015 12.1† 8.9−12.6 41 2 2015−2018 -0.7 12.6−12.3 -2.2 Total, 30−39 275,260(24.9) 11.13(10.99−11.28) 0 2007−2018 4.9† 8.5−14.4 70 Total, 40−49 211,865(19.2) 7.62(7.51−7.73) 0 2007−2011 15.7† 3.6−6.4 79.1 1 2011−2018 9.0† 6.4−11.8 83.5 Total, 50−59 136,826(12.4) 6.71(6.59−6.84) 0 2007−2012 28.3† 1.6−5.5 246.9 1 2012−2018 18.0† 5.5−15.0 169.7 Total, 60−69 102,416(9.3) 8.21(8.03−8.38) 0 2007−2011 35.4† 1.6−5.5 236.6 1 2011−2018 17.1† 5.5−16.6 201.6 Total, 70−79 46,068(4.2) 6.47(6.27−6.68) 0 2007−2011 41.1† 1.2−4.9 296.8 1 2011−2018 13.7† 4.9−12.1 145.1 Total, 80+ 8,873(0.8) 3.56(3.30−3.82) 0 2007−2018 17.6† 1.1−6.6 497.3 Male, 0−9 4,950(0.6) 0.49(0.44−0.54) 0 2007−2016 -3.2 0.5−0.4 -26.4 1 2016−2018 39.8 0.4−0.8 97.4 Male, 10−19 23,713(2.9) 2.13(2.04−2.23) 0 2007−2010 12.8 0.7−1.0 44.1 1 2010−2015 33.5† 1.0−4.2 323.5 2 2015−2018 -2.1 4.2−3.9 -6.3 Male, 20−29 214,681(25.8) 15.50(15.27−15.72) 0 2007−2011 2.8 10.1−11.3 11.9 1 2011−2015 16.5† 11.3−20.9 84.4 2 2015−2018 -0.2 20.9−20.7 -0.7 Male, 30−39 209,984(25.3) 16.63(16.39−16.88) 0 2007−2018 6.0† 12.0−22.7 89.1 Male, 40−49 159,878(19.2) 11.31(11.12−11.51) 0 2007−2011 16.2† 5.2−9.4 82.5 1 2011−2018 9.5† 9.4−17.8 89.4 Male, 50−59 94,568(11.4) 9.10(8.90−9.31) 0 2007−2013 27.5† 2.2−9.3 330.1 1 2013−2018 16.5† 9.3−20.0 114.9 Male, 60−69 75,076(9.0) 11.89(11.59−12.19) 0 2007−2011 35.3† 2.4−8.1 234.3 1 2011−2018 16.8† 8.1−24.0 196.3 Male, 70−79 39,877(4.8) 11.57(11.18−11.98) 0 2007−2011 40.3† 2.3−8.8 287.7 Male, 80+ 8,330(1.0) 7.96(7.38−8.58) 1 2011−2018 13.4† 8.8−21.3 141 0 2007−2018 17.1† 2.5−14.4 466.9 Female, 0−9 4,417(1.6) 0.50(0.45−0.55) 0 2007−2012 6.1 0.4−0.6 33.3 1 2012−2016 -12.3 0.6−0.3 -41.1 2 2016−2018 61.7† 0.3−0.9 163.6 Female, 10−19 8,491(3.1) 0.88(0.81−0.94) 0 2007−2018 6.5† 0.6−1.2 98.4 Female, 20−29 66,108(24.2) 4.98(4.85−5.12) 0 2007−2009 3.5 6.4−6.8 7.2 1 2009−2013 -9.9† 6.8−4.5 -34.2 2 2013−2018 -4.0† 4.5−3.7 -18.5 Female, 30−39 65,276(23.9) 5.39(5.25−5.54) 0 2007−2009 10.8 4.5−5.5 22.8 1 2009−2015 -0.8 5.5−5.3 -4.7 2 2015−2018 5.1 5.3−6.1 15.9 Female, 40−49 51,987(19.1) 3.80(3.69−3.92) 0 2007−2009 23.8† 1.8−2.8 53.3 1 2009−2018 8.2† 2.8−5.6 104 Female, 50−59 42,258(15.5) 4.23(4.09−4.37) 0 2007−2012 25.4† 1.1−3.4 211.1 1 2012−2018 19.1† 3.4−9.6 185.7 Female, 60−69 27,340(10.0) 4.44(4.26−4.62) 0 2007−2011 36.2† 0.8−2.9 242.9 1 2011−2018 18.1† 2.9−9.2 220.1 Female, 70−79 6191(2.3) 1.68(1.54−1.84) 0 2007−2011 42.2† 0.3−1.3 306.5 1 2011−2018 14.4† 1.3−3.2 155.6 Female, 80+ 543(0.2) 0.37(0.27−0.50) 0 2007−2018 17.1† 0.1−0.7 483.3 Abbreviations: APC=annual percentage change; CI=confidence interval.
* Rate per 100,000 population.
† Statistically significant regression results (p<0.05).Table 1. Number and rate of newly diagnosed HIV/AIDS infections among the overall population and by sex and age group — China, 2007–2018.
For the entire 12-year period, the rate of newly diagnosed HIV/AIDS increased 2.92 times (from 3.66 to 10.70) in the overall population, 3.26 times (from 4.95 to 16.15) among males, and 2.18 times (from 2.30 to 5.01) among females. Among adults aged 20–39 years, the rate of newly diagnosed HIV/AIDS increased 1.61 times (8.28 to 13.35), 1.94 times (11.12 to 21.58), and 0.92 times (5.28 to 4.84) from 2007 to 2018 among the overall population, males, and females, respectively. Among adults aged ≥60 years, the rate of newly diagnosed HIV/AIDS increased 10.41 times (1.35 to 14.06), 10.31 times (from 2.17 to 22.37), and 10.81 times (from 0.57 to 6.16) from 2007 to 2018 among the overall population, males, and females, respectively.
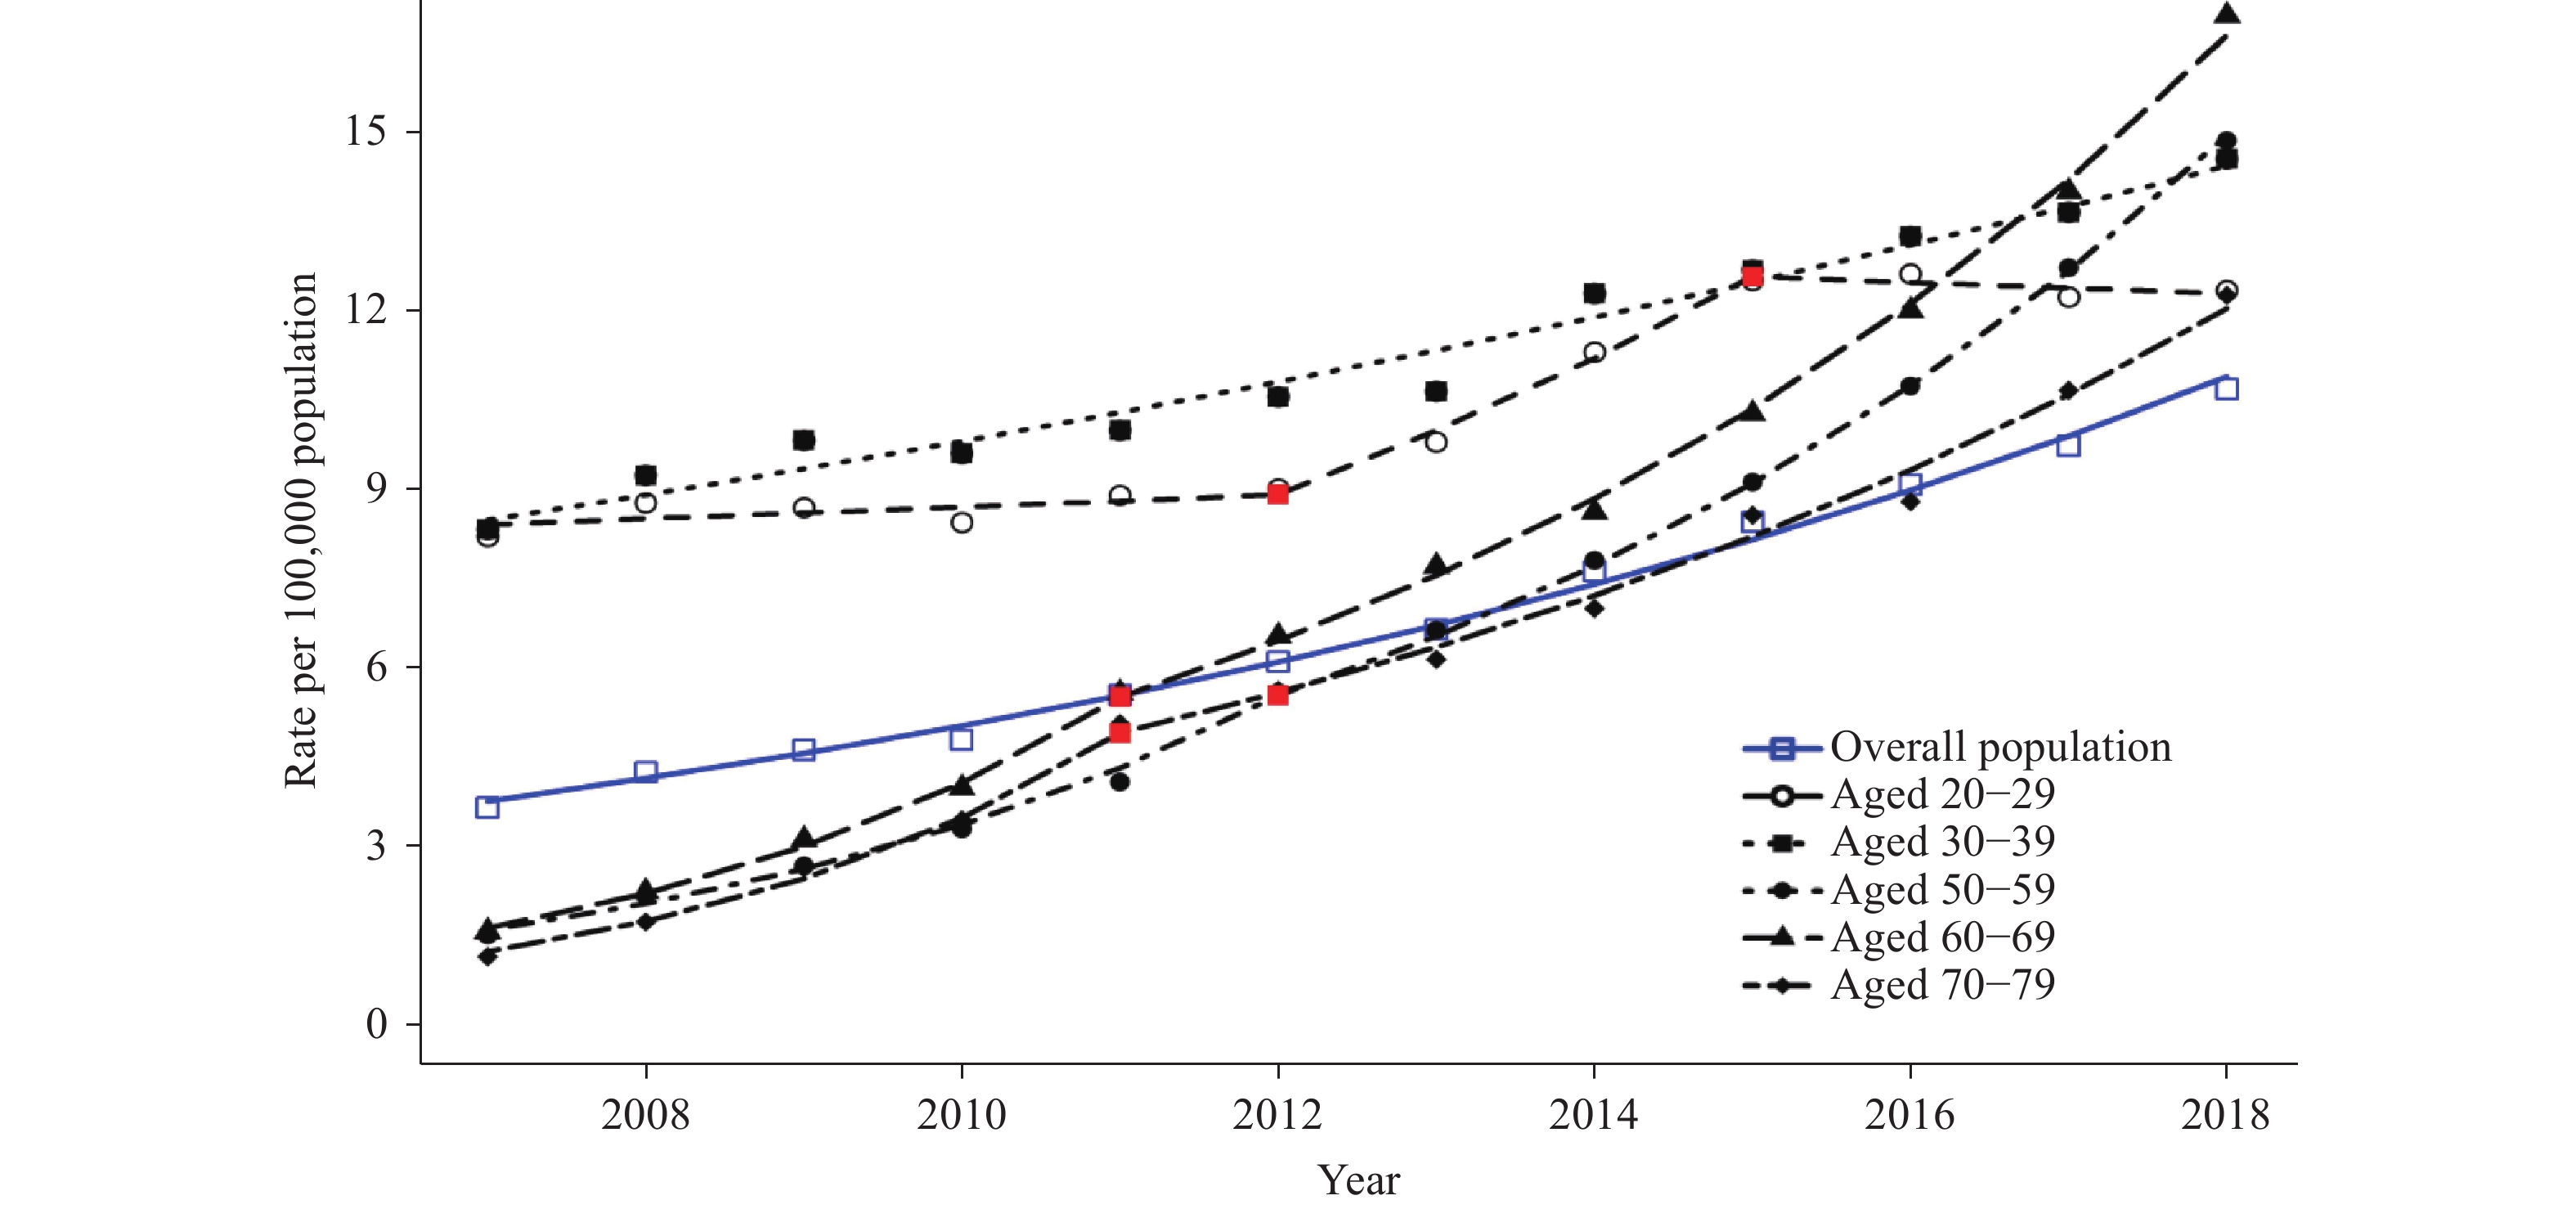
The overall crude rate of HIV/AIDS was highest in 2018 and the five age groups with the highest crude rate of HIV/AIDS per 100,000 population were aged 60–69 years (16.98), 50–59 years (14.88), 30–39 years (14.57), 20–29 years (12.36), and 70–79 years (12.28) in 2018 (Figure 1).
 Figure 1.
Observed and modeled rates of newly diagnosed HIV/AIDS among all population by specific age groups — China, 2007–2018.
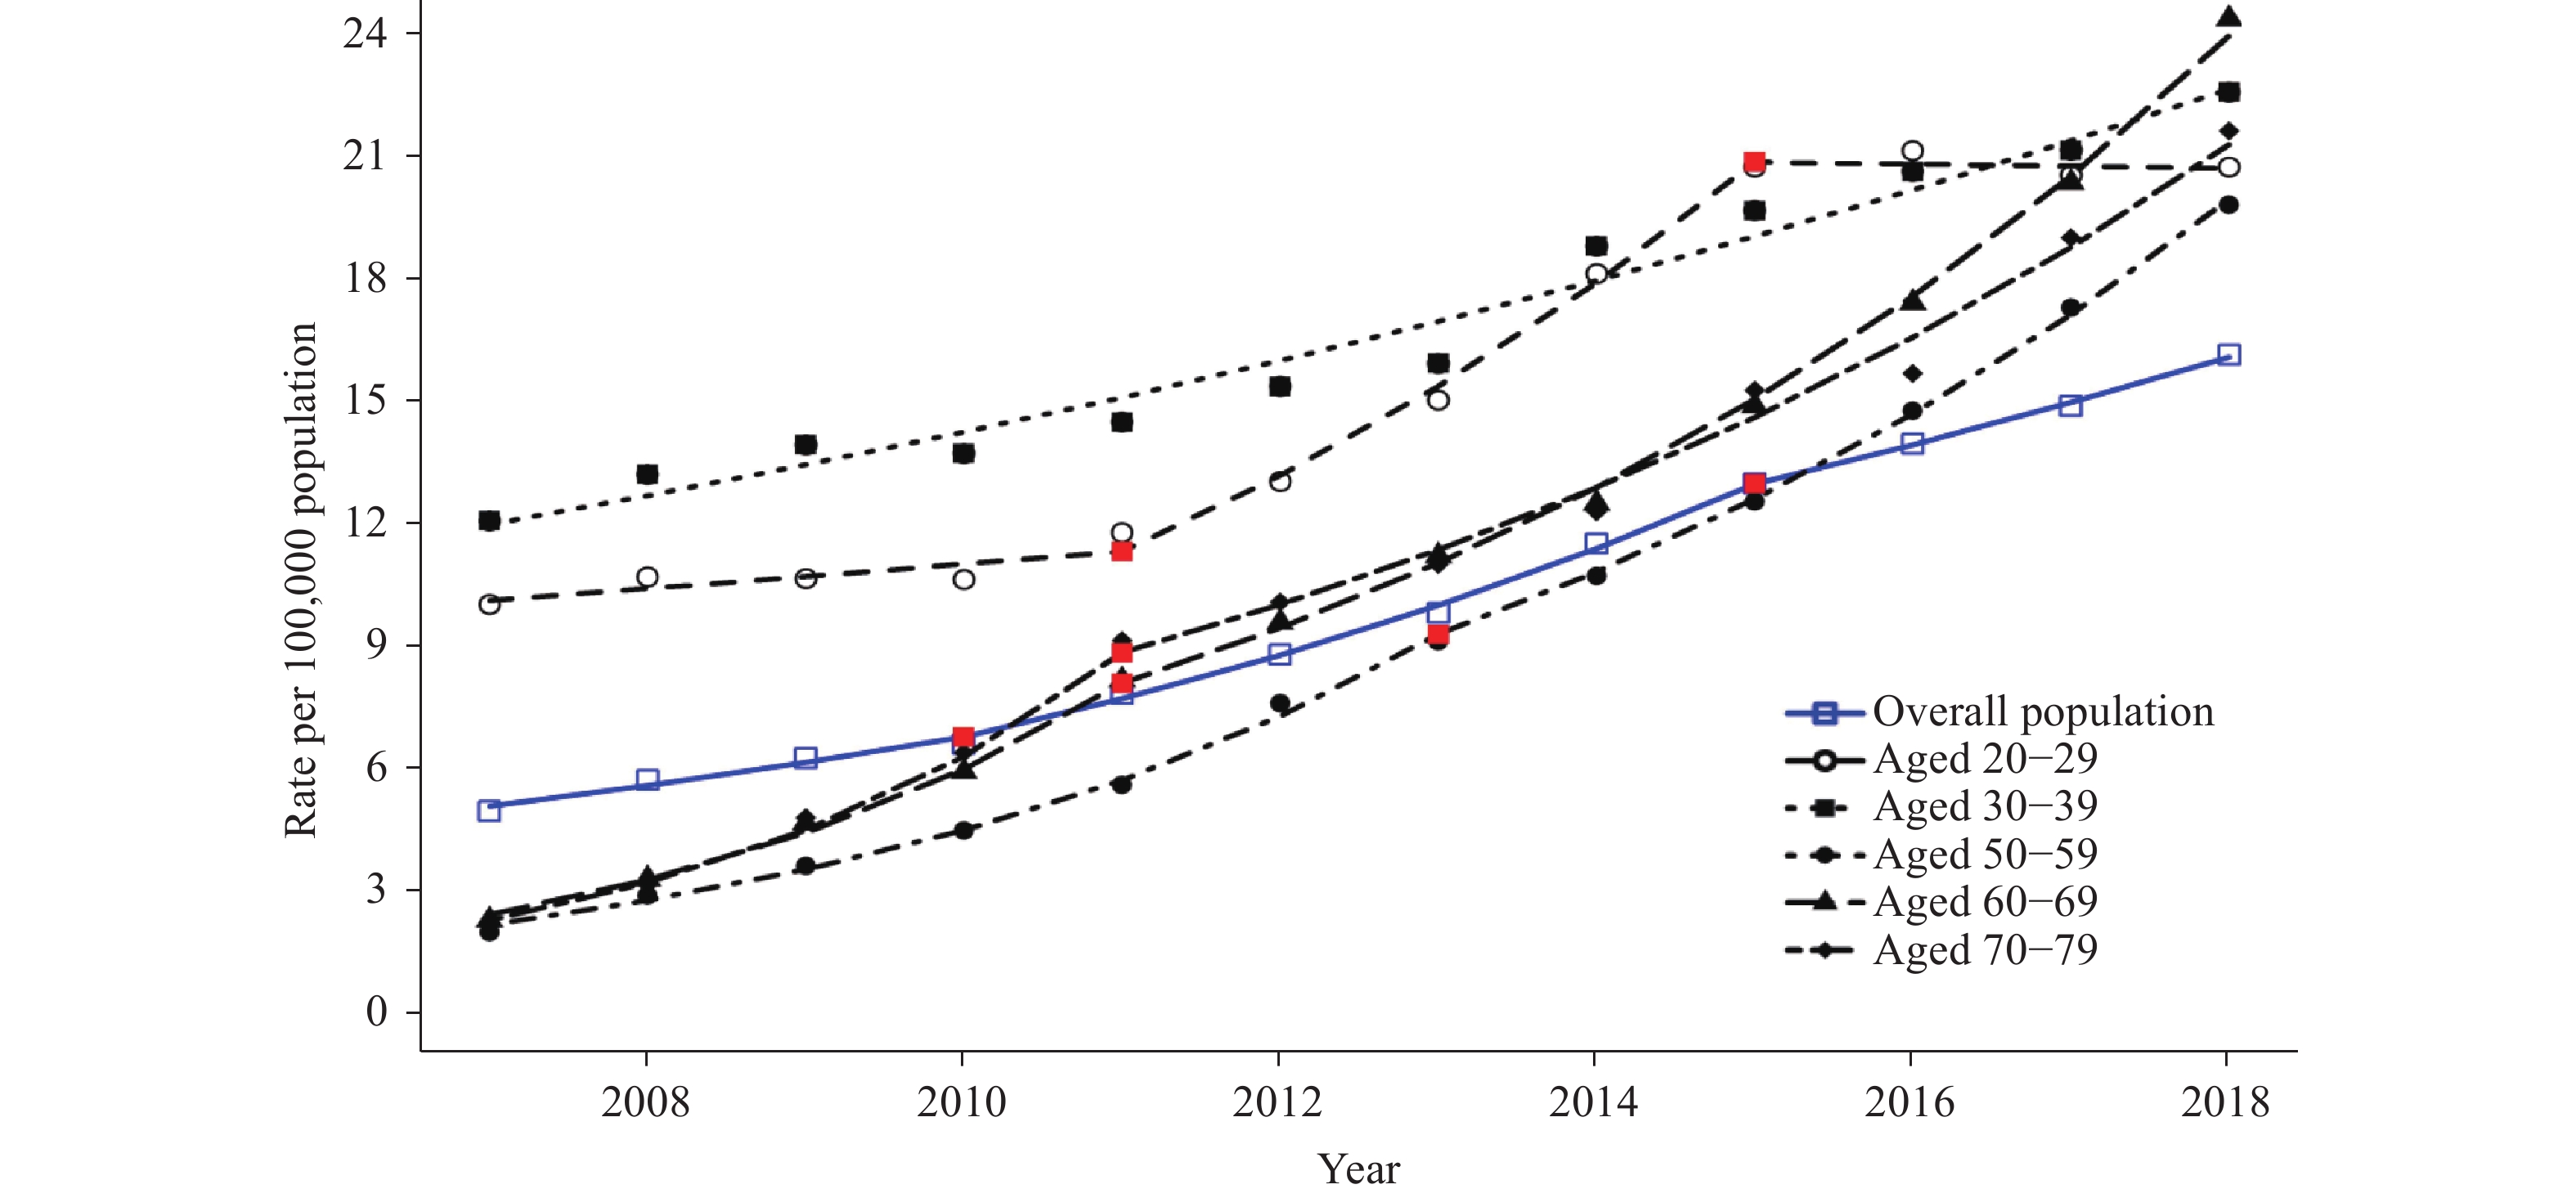
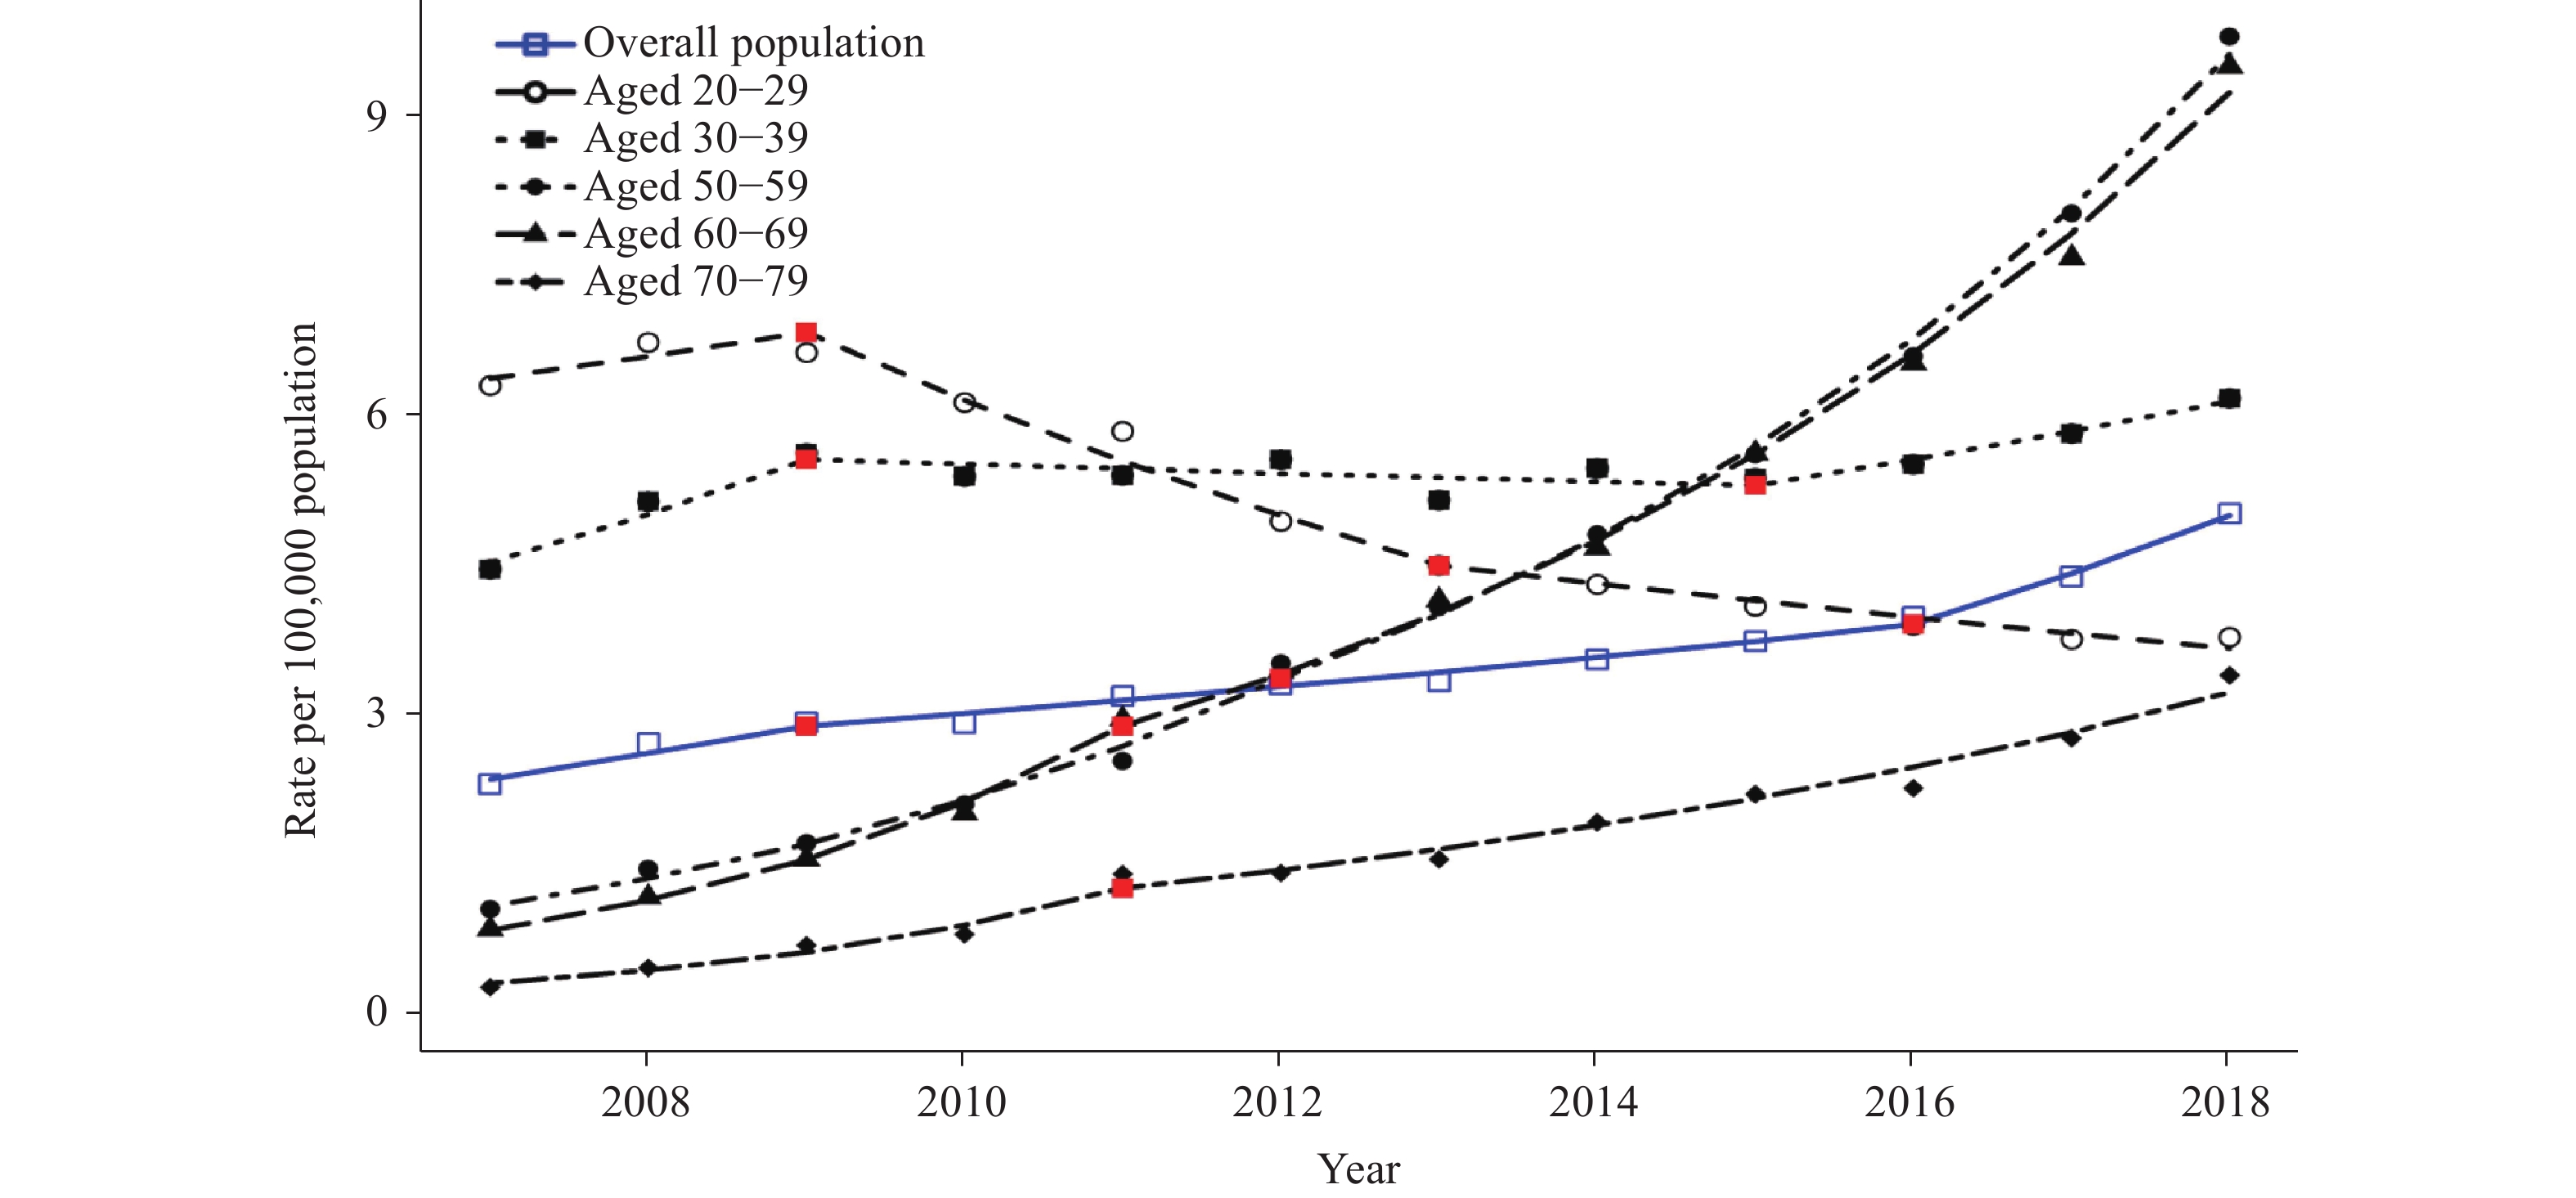
Note: Joinpoint regression analysis was used to determine annual percentage change (APC) with statistically significant trends and significant joinpoints. The red points in the figure show the positions of jointpoints for each age group. Rates are single-year rates per 100,000 population.The modeled rate among male aged 20–29 years increased 11.9% from 2007 to 2011 and 84.4% from 2011 to 2015 but decreased 0.7% from 2015 to 2018. The modeled rate among female aged 20–29 years increased 7.2% from 2007 to 2009 but decreased 34.2% from 2009 to 2013 and 18% from 2013 to 2018, respectively (Table 1, Figures 2, 3).
 Figure 2.
Observed and modeled rates of newly diagnosed HIV/AIDS among male by specific age groups — China, 2007–2018.
Note: Joinpoint regression analysis was used to determine annual percentage change (APC) with statistically significant trend and significant joinpoints. The red points in the figure show the positions of jointpoints for each age group. Rates are single-year rates per 100,000 population. Figure 3.
Observed and modeled rates of newly diagnosed HIV/AIDS among female by specific age groups — China, 2007–2018.
Note: Joinpoint regression analysis was used to determine annual percentage change (APC) with statistically significant trend and significant joinpoints. The red points in the figure show the positions of jointpoints for each age group. Rates are single-year rates per 100,000 population.The modeled rate among male aged 30–39 years increased 89.1% from 2007–2018. The modeled rate among female aged 30–39 years increased 22.8% from 2007 to 2018, then decreased 4.7% from 2009 to 2015, and then increased 15.9% from 2015 to 2018 (Table 1, Figures 2, 3).
Sharp increases in modeled rate of HIV were observed among female aged 50–59 years and 60–69 years, as well as male aged 60–69 years and 70–79 years (Table 1, Figures 2, 3).
The modeled rate among female aged 50–59 years increased 211.1% from 2007 to 2012 and increased 185.7% from 2012 to 2018. The modeled rate among female aged 60–69 years increased 242.9% from 2007 to 2011 and 220.1% from 2011 to 2018, respectively (Table 1, Figures 2, 3).
The modeled rate among male aged 60–69 years increased 234.3% from 2007 to 2011 and 196.3% from 2011 to 2018. The modeled rate among male aged 70–79 years increased 287.7% from 2007 to 2018 (Table 1, Figures 2, 3).
HTML
-
From 2007–2018, a total of 1,103,668 HIV/AIDS cases were reported in China. In all study years, the total number and rate of HIV/AIDS in males were higher than those among females, and the rate found in males was approximately three times that of females, which is consistent with other studies suggesting that males are at higher risk (2). From 2007 to 2018, the rate of newly diagnosed HIV/AIDS in males increased faster than females. The ratio of modeled rate of newly diagnosed HIV/AIDS in males to females is 2.15∶1 in 2007, which increased to 3.23∶1 in 2018.
Significant differences in changing trends and patterns of rates of newly diagnosed HIV/AIDS were found among different age groups, especially between young adults and old adults. Although the annual average rates of newly diagnosed HIV/AIDS in young adults aged 20–29 years and 30–39 years remained the highest among all age groups, the annual percentage changes (APC) of HIV/AIDS among young adults aged 20–29 years and 30–39 years were less than that of the overall population. The rate of newly diagnosed HIV/AIDS in female aged 20–29 years declined significantly for ten years with APC equal to -9.9 from 2009 to 2013 and -4.0 from 2013 to 2018, and similar trends were also found among female aged 30–39 years.
A sharp increase in rates of newly diagnosed HIV/AIDS was observed among older adults aged 60–69 and 70–79 years. In males, the fastest increasing trends of HIV/AIDS were found in groups aged 60–69 and 70–79 years. In females, the fastest increasing trends of HIV/AIDS were found in groups aged 50–59 and 60–69 years from 2017 to 2018, the crude rates of newly diagnosed HIV/AIDS among these two groups reached the highest among all female groups. Our results were consistent with other studies about the higher risk of HIV/AIDS among older adults at the national, provincial, and local levels in China (4-7).
Older adults are often less educated and have not been the target populations for long-term HIV/AIDS control and prevention efforts in China. Females aged 50–69 years and males aged 60–79 years in the period before and after retirement often remain sexually active but lack adequate knowledge on protection and safety measures.
The findings in this report are subject to a couple of limitations. First, the scaling up of HIV/AIDS testing, such as implementation of mandatory testing for HIV/AIDS for certain medical treatments in most hospitals, might lead to a rapid increase of HIV/AIDS diagnoses among some groups of population from 2007 to 2018. However, the HIV/AIDS rates in younger females did not increase significantly, which indicates that the impact of expanded testing on the report was not as big as expected. Second, as health education is improved and more widely available, more people will receive HIV/AIDS testing which will increase diagnosis rates.
In summary, findings in this study highlight the need to strengthen HIV/AIDS prevention among older adults. Field surveys need to be conducted to understand the increase in the number of HIV/AIDS cases resulting from true changes in incidence, care-seeking behaviors, or other reasons. Health workers should also try to identify older adults at risk for HIV, to carry out targeted health education and preventative measures, and to treat and support those already affected.
FootNote
| ① | CI=Confidence Interval |
| Citation: |


 Download:


