
 Download:


-
Introduction: Seasonal influenza is a prevalent and highly contagious acute respiratory disease that causes a major global disease burden. New strains of influenza viruses also have the potential to cause an influenza pandemic. Due to the high variability and the consequent uncertainty about virus strains, the prevention and control of influenza are faced with many challenges. Surveillance is considered a key strategy to lead to the prevention and control of influenza, and influenza is one of first infectious diseases to be monitored globally.
Methods: The Chinese National Influenza Surveillance Network conducts routine influenza surveillance and includes 410 network laboratories and 554 sentinel hospitals based on the requirements of National Influenza Surveillance Guidelines. China and other countries submit epidemiological and virological data to the WHO FluMart database, which can be viewed online.
Results: Seasonal influenza H3N2 virus was the dominant subtype in China when entering the 2019–2020 winter influenza season, while neighboring countries such as Japan and Republic of Korea reported the dominance of H1N1pdm09 and Mongolia and Russia reported a higher proportion of type B virus than type A virus.
Conclusions and Implications for Public Health Practice: Asian countries entered the 2019–2020 winter influenza season with different type/subtypes of influenza virus dominant in different areas. Influenza surveillance needs to be strengthened to closely monitor changes in the antigenicity and genetic characteristics of emerging viruses.
-
The high variability and the consequent uncertainty about influenza virus lead to the establishment of influenza surveillance network globally. The Chinese National Influenza Surveillance Network is an early detection system for influenza and for a few other emerging global infectious diseases. The construction of the influenza surveillance network has prepared technical and expert teams at the provincial and city level to respond to emerging infectious diseases, especially those resulting from respiratory viruses. Countries submit epidemiological and virological data to the World Health Organization (WHO) FluMart database, which can be viewed through FluNet of the WHO. In this study, the influenza activity in China and Asian countries in the 2019–2020 winter season was analyzed, and the results showed that seasonal influenza H3N2 virus was the dominant subtype in China, H1N1pdm09 dominated in Japan and Republic of Korea, and more type B virus were detected than type A virus in Mongolia and Russia. This suggests that different countries and areas may face very different disease burdens. Surveillance as well as information exchange among countries and regions are essential to closely monitor changes of the emerging viruses.
-
All 554 sentinel hospitals in the Chinese National Influenza Surveillance Network report information on influenza-like illness (ILI) cases to Chinese National Influenza Surveillance Information System (CNISIS) and collect respiratory samples within three days of onset, including throat swabs, nasal swabs, etc. of ILI cases (those whose body temperature is ≥38 ℃ with sore throat or cough). These samples are then transported to the 410 National Influenza Surveillance Network Laboratories. Network laboratories determine whether the sample is influenza virus positive as well as its type and subtype using real-time reverse transcription polymerase chain reaction (RT-PCR) test. Laboratory test results were summitted to CNISIS and WHO FluMart. Virological surveillance data of neighboring countries were downloaded from WHO FluNet (
https://www.who.int/influenza/gisrs_laboratory/flunet/en/ ). -
The positive rate of influenza virus in samples collected from ILI cases in China increased in the southern provinces since Week 40 and increased in northern provinces beginning around Week 42. As of Week 52 (from December 23 to 29, 2019), influenza activity is still increasing. During Week 52, influenza network laboratories tested 10,493 specimens, of which 4,707 (44.9%) were positive for influenza, and the total identified influenza A and influenza B viruses were 3,628 (77.1%) and 1,079 (22.9%), respectively. During Week 52, the percentage of specimens that tested positive for influenza in Southern China was 46.3% (2,299/4,965), which was higher than that of the previous week 40.2% (2,025/5,034), and the percentage of specimens that tested positive for influenza in Northern China was 43.6% (2,408/5,528), which was also higher than that of the previous week 38.5% (2,030/5,266) (Figure 1A and B).
 Figure 1.
Influenza positive tests reported by network laboratories in north (A) and south (B) China.
Since Week 40 of 2019, H3N2 has been the dominant virus in China (Figure 2) with the proportion of H3N2 virus among all influenza viruses tested increasing from 48.5% to as high as 75.0% in Week 50. The H3N2 virus accounted for 94.5% of all type A influenza viruses in Week 52, the highest proportion since Week 40. H3N2 has not been the dominant subtype in China since mid-2017 (Figure 1A and B). However, in countries neighboring China, influenza types and subtypes have been highly variable since the beginning of the winter influenza season in late 2019 in the northern hemisphere. Among the neighboring countries that have detected more than 150 influenza viruses and reported to WHO FluNet from Week 40 to Week 52, H1N1pdm09 virus was dominant in Japan and Republic of Korea, H3N2 was dominant in India and Laos, and influenza B in Mongolia and Russia was more frequently detected than influenza A with the proportion of type B influenza estimated at 80.7% (71/88) in Mongolia and 77.2% in Russia in Week 52. Figure 3 illustrates the variable proportion of different types and subtypes of influenza virus since October 2019.
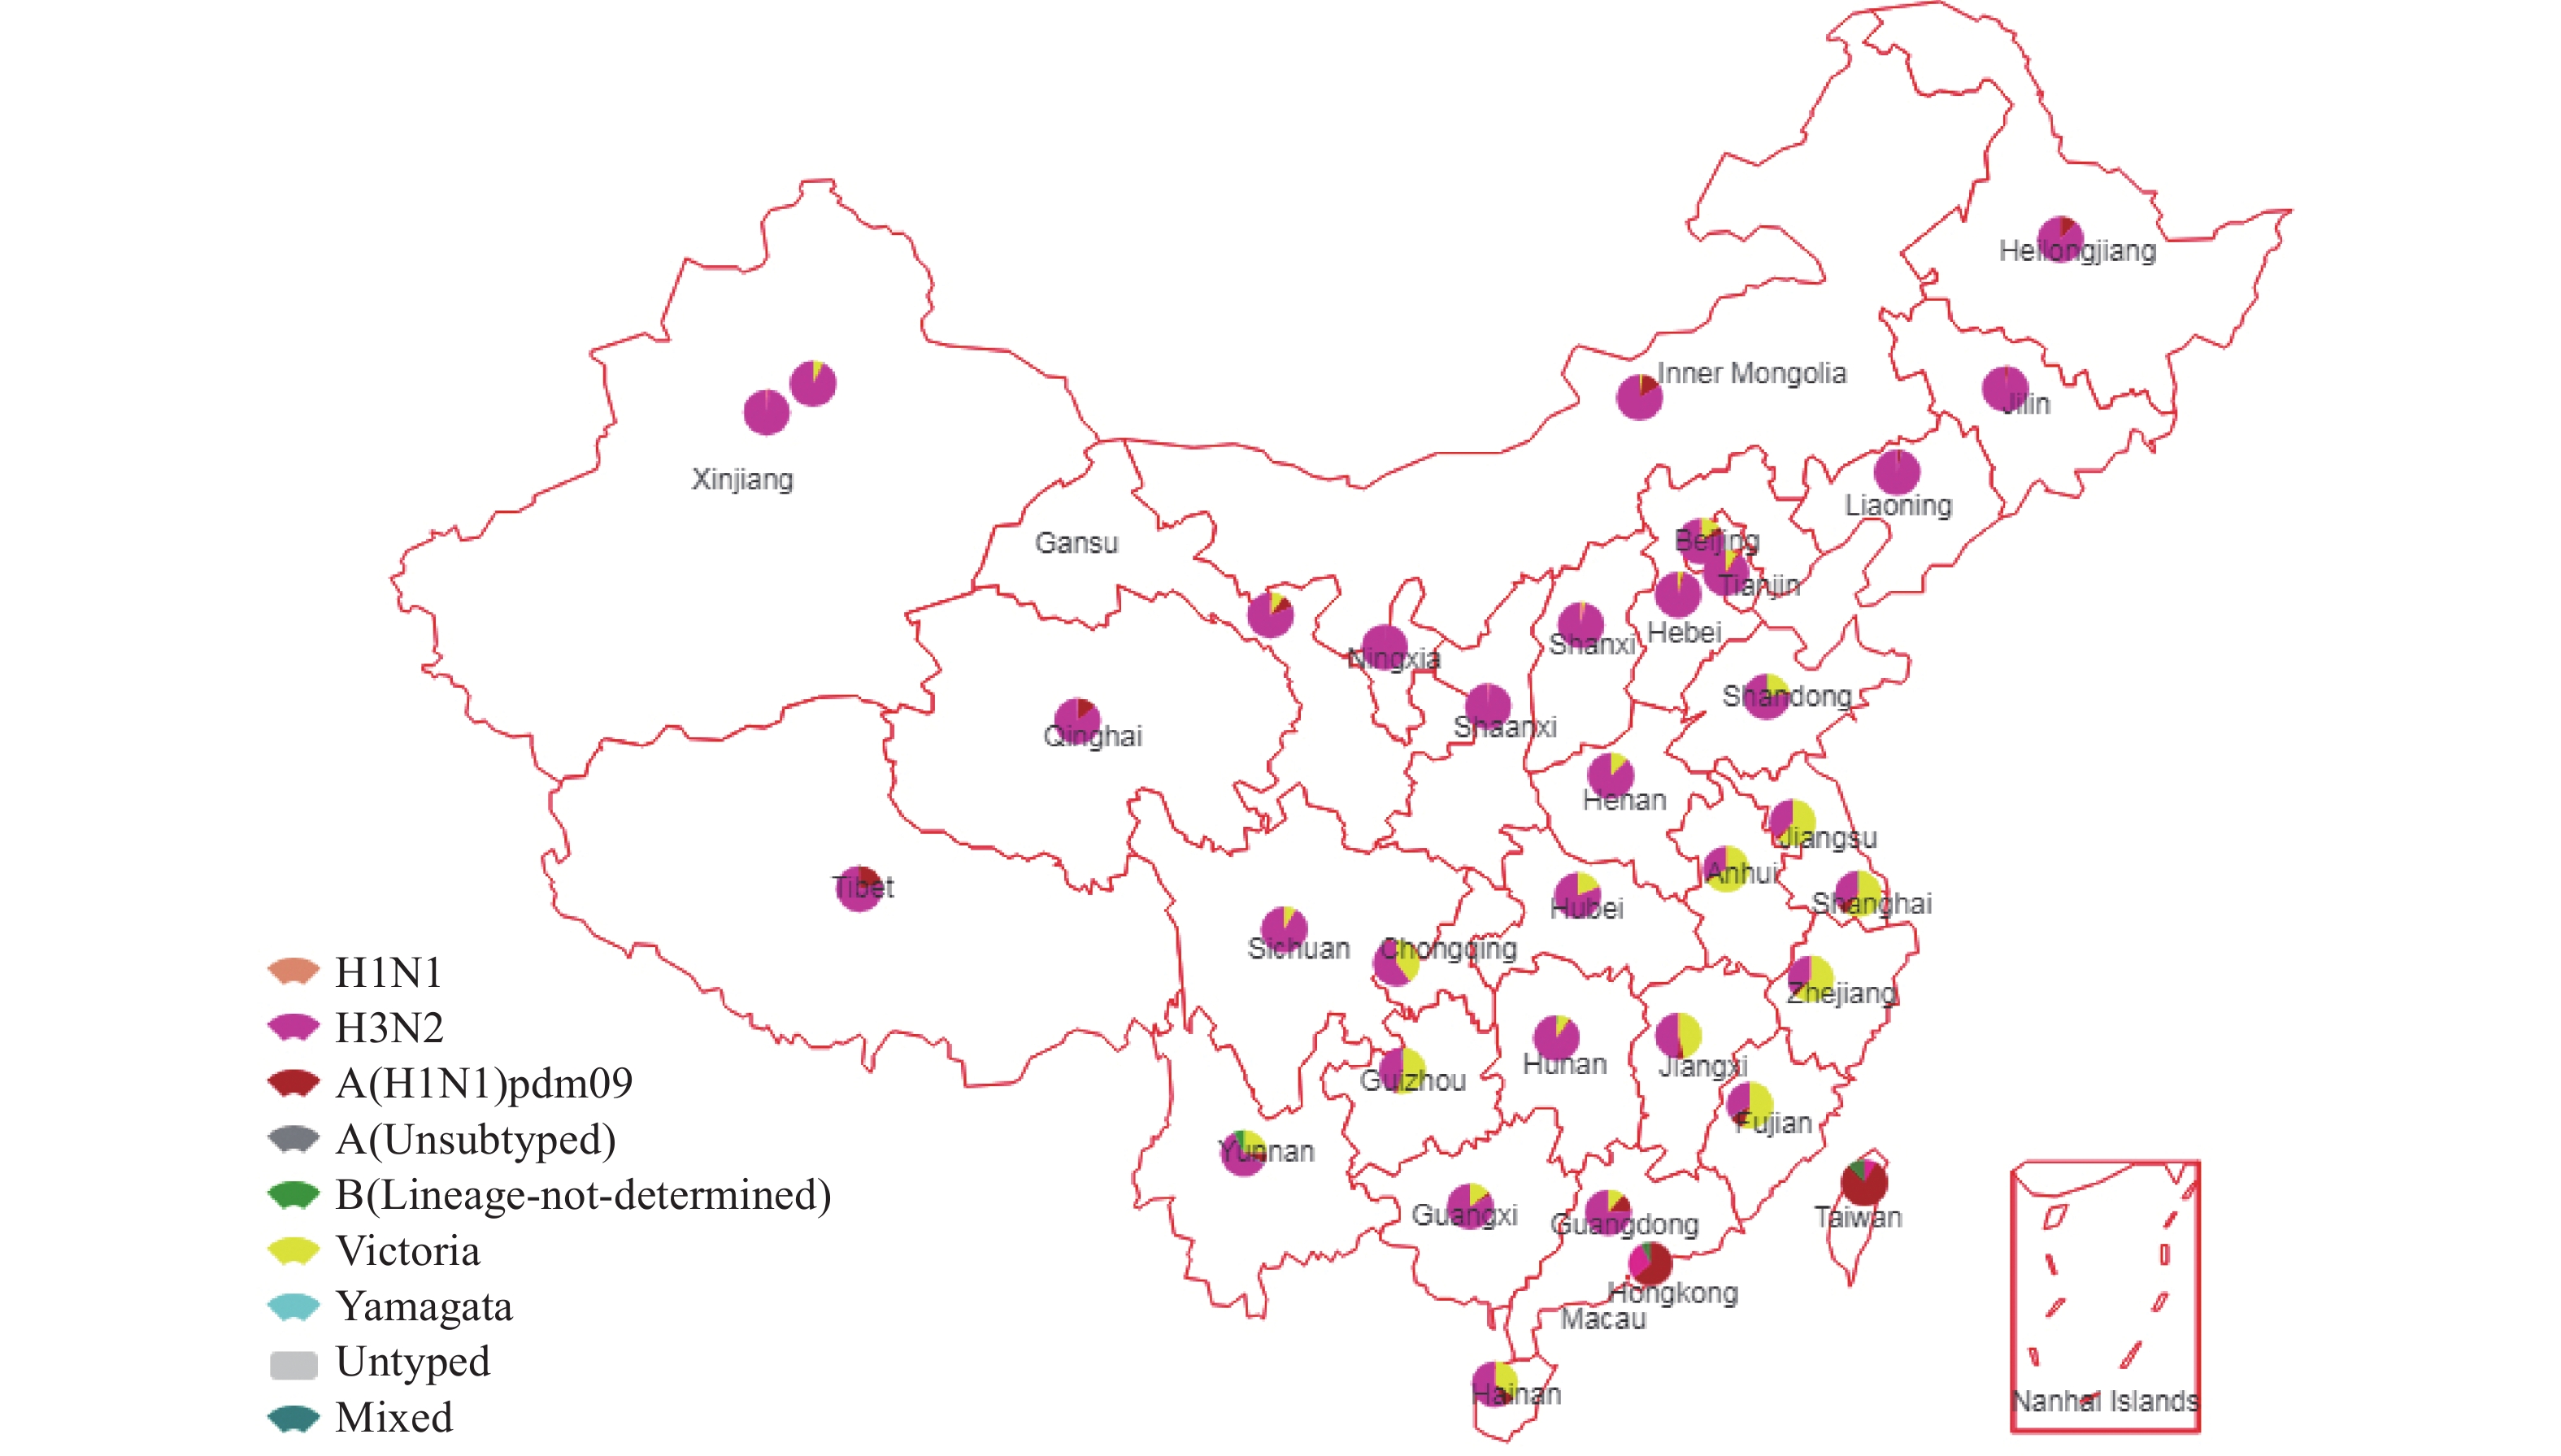 Figure 2.
The proportion of different types and subtypes of influenza virus in China.
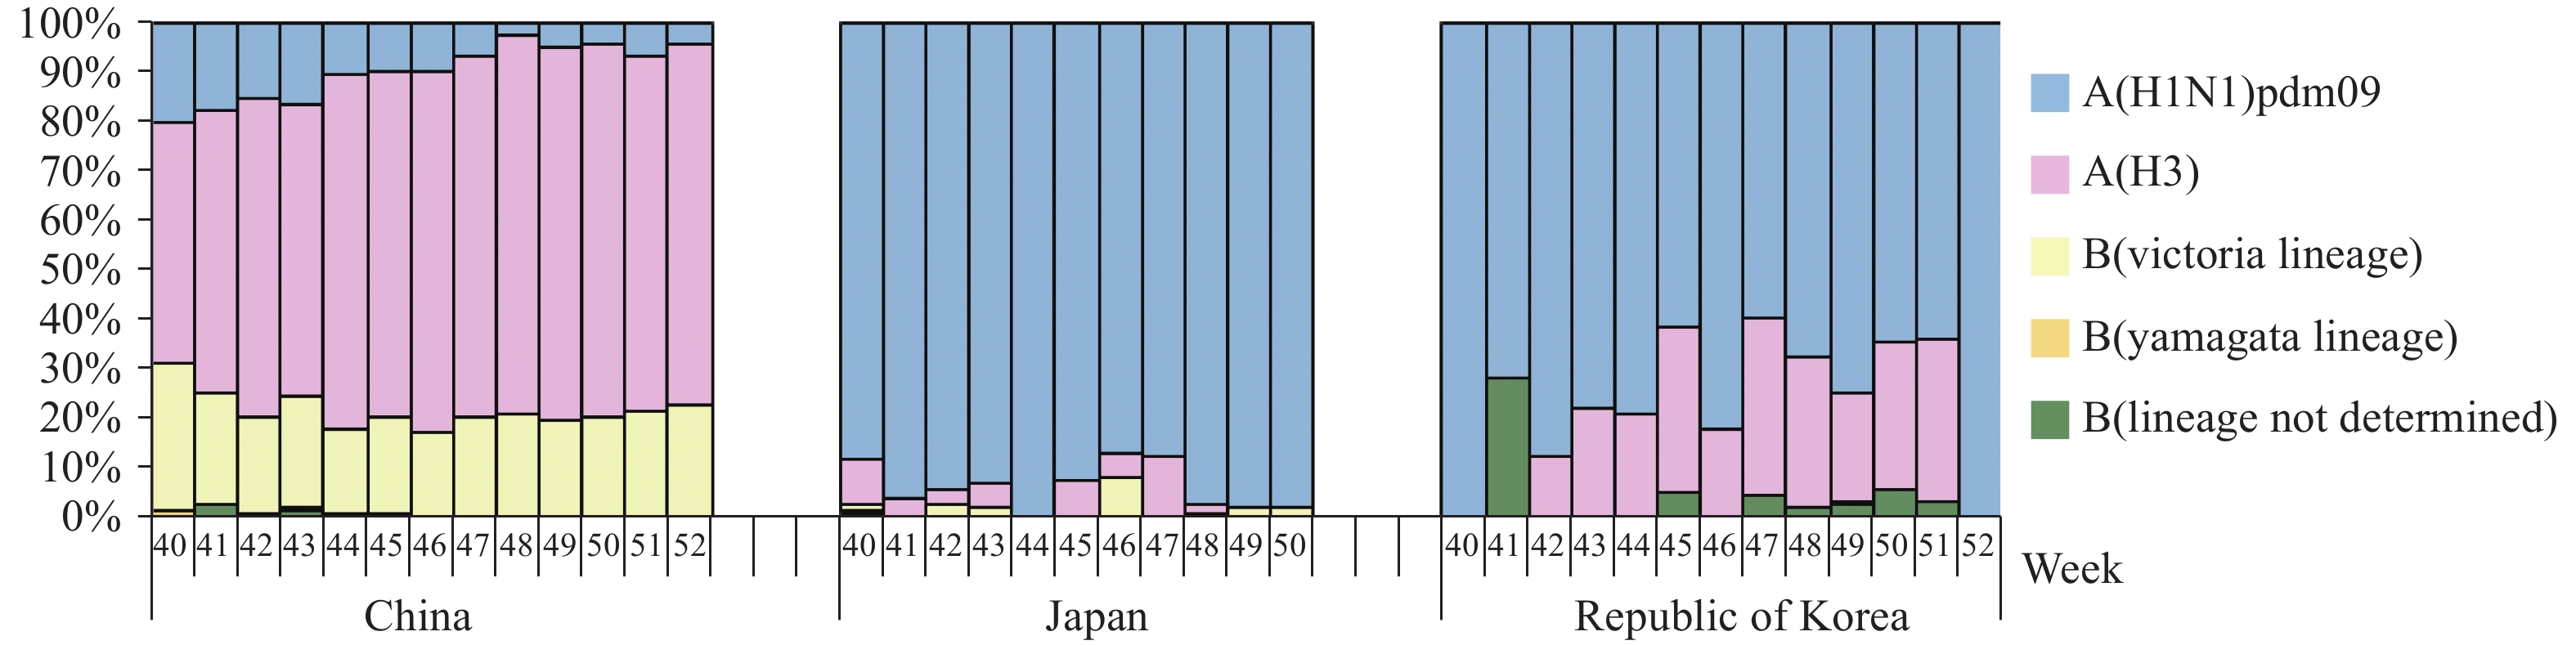 Figure 3.
The proportion of different types and subtypes of influenza virus in China, Japan and Republic of Korea since October 2019.
The Chinese National Influenza Center further tested the antigenicity of circulating influenza viruses in China. Twenty-four A(H1N1)pdm09 viruses collected since September 1, 2019 were antigenically analyzed with haemagglutinin inhibition (HI) tests, and 87.5% (21/24) viruses (21/24) were well inhibited by ferret antisera raised against the vaccine virus egg-propagated A/Brisbane/02/2018(H1N1), which was the vaccine virus. All tested viruses (24/24) were well inhibited by ferret antisera raised against MDCK-propagated A/Brisbane/02/2018(H1N1). A total of 111 A(H3N2) viruses collected since September 1, 2019 were antigenically analyzed with HI tests using guinea pig red blood cells (RBCs) in the presence of oseltamivir, 9% of the viruses (10/111) were well inhibited by ferret antisera raised against egg-propagated vaccine virus A/Kansas/14/2017(H3N2), and 18.0% viruses (20/111) were well inhibited by ferret antisera raised against MDCK-SIAT1 cell propagated A/Kansas/14/2017(H3N2). Fifty-seven B-Victoria lineage viruses collected since September 1, 2019 were antigenically analyzed, 19.3% viruses (11/57) were well inhibited by ferret antisera raised against egg-propagated B/Colorado/06/2017, the vaccine strain virus, and all tested viruses (57/57) were well inhibited by ferret antisera raised against MDCK grown B/Colorado/06/2017. No B-Yamagata lineage viruses have been isolated since September 2019.
-
Although great progress has been made since the discover of influenza virus in 1933, technical bottlenecks in the prevention and control of influenza in the world remain, as influenza viruses are highly variable (1). Influenza still causes regular epidemics involving 290,000 to 650,000 deaths each year (2), and has great repercussions for human health. When a new influenza virus appears, the general lack of immunity in the population can lead to an influenza pandemic (3-4). Both preventing the occurrence of an influenza pandemic and predicting which virus will cause the pandemic are still not possible (5). Therefore, an effective strategy that can be adopted is to establish a powerful influenza surveillance network to track variations observed in influenza viruses in real time, which can lead to an earlier warnings for influenza epidemics or pandemics.
The Chinese National Influenza Surveillance Network is one of the earliest detection systems for emerging infectious diseases worldwide. It helps improve the capacity of public health systems for the prevention, control, and early warning of emerging influenza-associated infectious diseases. Currently, the influenza surveillance network includes 410 network laboratories and 554 sentinel hospitals, which follow the requirements of National Influenza Surveillance Guideline. As of 2019, 99.6% of the sentinel hospitals are able to report surveillance data every week, and 96.6% of the network laboratories have the capacity to perform real-time PCR testing and virus isolation. With this surveillance network, data can be obtained promptly for risk assessment and earlier warnings of coming influenza epidemics.
With the increasing movement of people around the world, the influenza virus will rapidly spread to various countries and regions. WHO FluNet is a global web-based tool for influenza virological surveillance first launched in 1997 by the WHO, and the virological data entered into WHO FluNet are critical for tracking the movement of viruses globally and interpreting epidemiological data (
https://www.who.int/influenza/gisrs_laboratory/flunet/en/ ). Country-level data are publicly available and updated weekly.In this study, we compared the surveillance data of China with data of neighboring countries available on WHO FluNet. Countries and regions were shown not to have the same dominant influenza strains, even for countries at the same latitude or in close proximity. Because vaccines show different levels of effectiveness against different influenza strains (6-8), the results of this study suggest that different countries and areas may face widely varying disease burdens. Many factors may explain the differing predominant epidemic strains in the countries such as varying immunity levels for different influenza type/subtype in each population, previous dominant epidemic strains, and even climate and environmental factors. The limitation of this study is that it is not yet clear which one is the determining factor. The proportions of different types and subtypes of influenza viruses as well as its genetic and antigenic characterization are constantly changing and continuing to improve the timeliness of surveillance is essential for detecting unusual epidemics promptly.
HTML
| Citation: |

|