
 Download:


-
Fine particulate matter (particles with aerodynamic diameter ≤2.5 µm; PM2.5), a non-threshold pollutant, has been associated with excess death at low levels of short-term exposure in a several epidemiological studies in developed countries (1–3). However, few studies on national PM2.5 exposure and population death have been done in China because pertinent data started becoming available in January 2013, and existing studies performed on three-year time series data from 2013–2015 might fail to capture health impacts under recent initiatives for air quality improvement (4-5). Ambient PM2.5 might exhibit similar risk patterns in China, and the excess death toll could be larger and more immediate given higher population densities and pollution levels. To assess the association between PM2.5 and cause-specific death nationwide, National Institute of Environmental Health (NIEH) of China CDC analyzed daily mortality cases during a six-year study period from January 1, 2013 to December 31, 2018 provided by China CDC’s Disease Surveillance Point System (DSPS). A 0.14% (95% CI①: 0.06-0.21) increase in non-accidental mortality and a 0.12% (95% CI: 0.02-0.21) increase in cardio-cerebrovascular mortality were associated with 10 μg/m3 increases in a three-day moving average of PM2.5. Males and individuals over 75 years old were found to be more susceptible to increases in PM2.5, and China’s northern and southern regions were found to have differing cause-specific mortalities associated with PM2.5. National plans for regulating PM2.5 need to be prioritized with consideration for variability across regions, for susceptible populations, and for highly associated diseases.
This study used daily mortality cases from January 1, 2013 to December 31, 2018 provided by the DSPS of China CDC and involved a study population of 81.02 million from 130 Chinese counties, 88 of which are in the northern region and 42 in the southern region. Twelve specific causes of deaths were classified according to the International Statistical Classification of Disease, 10th Revision (ICD-10; World Health Organization 2007), by sex (male and female), and by age (<65 years, 65–74 years, and >74 years)(Figure 1). Daily PM2.5 24-hour mean concentrations were obtained from the National Urban Air Quality Real-Time Release Platform, and to adjust for the confounding effects of meteorological factors, data on 24-hour mean temperature and relative humidity of study sites were obtained from the National Meteorological Information Center.
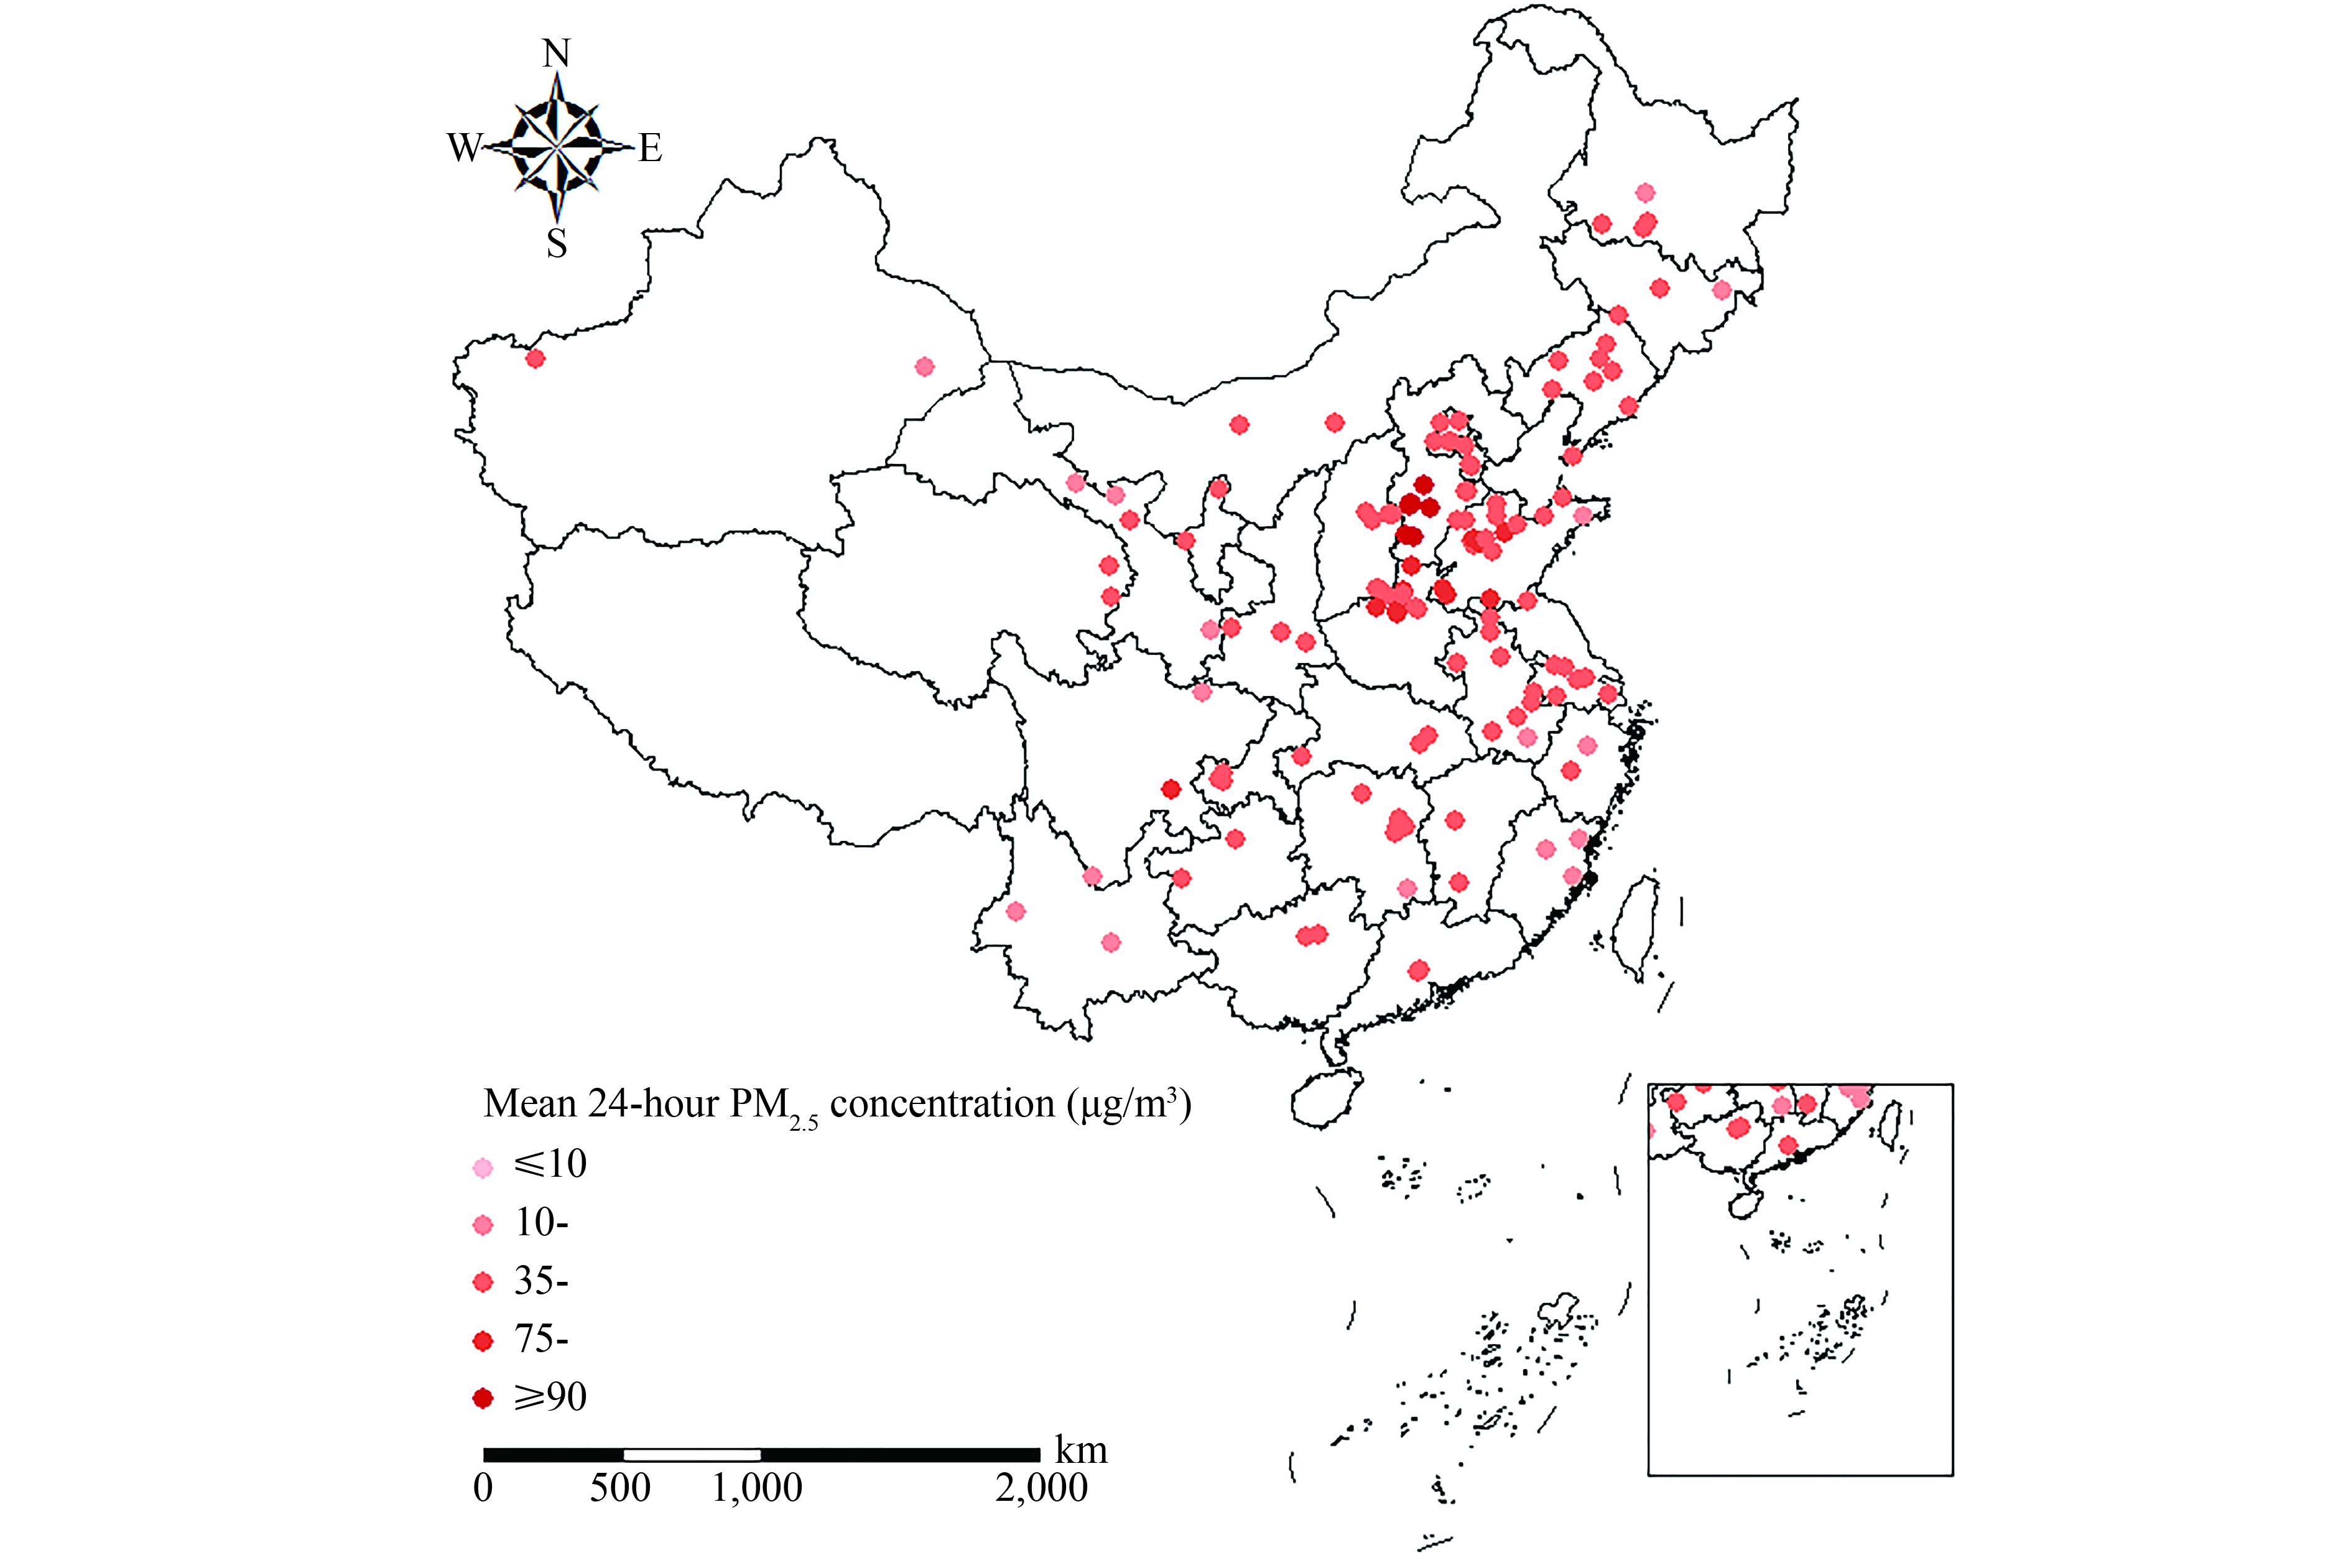 Figure 1.
Map of 130 Chinese counties included in the study (color represents mean PM2.5 concentration at county-scale).
This study applied a two-stage statistical analysis of a multi-county time series design. In the first stage, a generalized additive model (GAM) with quasi-Poisson regression was used to estimate the county-specific associations of daily mortality and PM2.5 for each cause.② In the second stage, a random effects meta-analysis was conducted to calculate effect estimates for both nationwide and north-south regional associations between cause-specific mortality and short-term PM2.5 exposure. Stratified analyses of sub-populations by sex and age were also conducted to explore the potential vulnerable groups to PM2.5. Given relatively strong associations between mortality and PM2.5 with lagged cumulative exposure over several days (2–4), a 3-day moving average of the current and previous 2 days (lag 02) exposure to PM2.5 was used for the core model.③ Data analyses were conducted with the statistical software R(version 3.6.0) using the mgcv and meta for packages. Excess risks (ER) were expressed as the percentage increase in daily mortality associated with a per 10 μg/m3 increase in PM2.5 in the study.
From 2013 to 2018, the population residing in study site areas was exposed to an mean daily PM2.5 concentration of 58 μg/m3 (range from 3 to 807 μg/m3)(Table 1). A total of 2,411,410 deaths occurred from non-accidental causes, of which 1,181,292 were related to cerebrocardiovascular disease (CCVD) and 266,623 to respiratory diseases. On average, approximately 10 non-accidental deaths per day per county were recorded.
Items No. of counties Mean ± SD Median (P25, P75) Fine Particulate (24-h average, μg/m3) Nationwide 130 58±51 44 (26, 73) Northern 88 64±55 48 (28, 80) Southern 42 46±35 37 (23, 58) Meteorological Parameters Temperature (℃) 130 15±11 16 (6, 23) Humidity (%) 130 64±19 66 (50, 79) Cause of Mortality (daily counts per county) Non-Accidental Causes (A00-R99) 130 10±7 8 (5, 13) Cardio-Cerebrovascular Diseases (I00-I99) 130 5±4 4 (2, 7) Ischemic Heart Disease (I20-I25) 130 2±2 2 (1, 3) Acute Ischemic Heart Disease (I20-I22, I24) 130 1±2 1 (0, 2) Acute Myocardial Infarction (I21-I23) 130 1±1 1 (0, 2) Cerebrovascular Disease (I60-I69) 130 2±2 2 (1, 3) Stroke (I60-I64) 130 2±2 1 (0, 2) Hemorrhagic Stroke (I60-I61) 130 1±1 1 (0, 1) Intracranial Hemorrhagic Stroke (I61) 130 1±1 0 (0, 1) Respiratory Diseases (J00-J99) 130 1±1 1 (0, 2) Chronic Obstructive Pulmonary Disease (J41-J44) 130 1±1 0 (0, 1) Chronic Lower Respiratory Disease (J40-J47) 130 1±1 0 (0, 1) Table 1. Summary of daily fine particulate, meteorological data and mortality counts across 130 counties in China (2013-2018).
Positive associations (Figure 2A) with all analyzed causes of death and PM2.5 were found in pooled estimates nationwide. Strongly significant effects were found for acute myocardial infarction (ER=0.21%, 95% CI: 0.05-0.37) and acute ischemic heart disease (ER=0.19%, 95% CI: 0.04-0.35), followed by non-accidental mortality (ER=0.14%, 95% CI: 0.06-0.21) and CCVD (ER=0.192%, 95% CI: 0.02-0.21).④
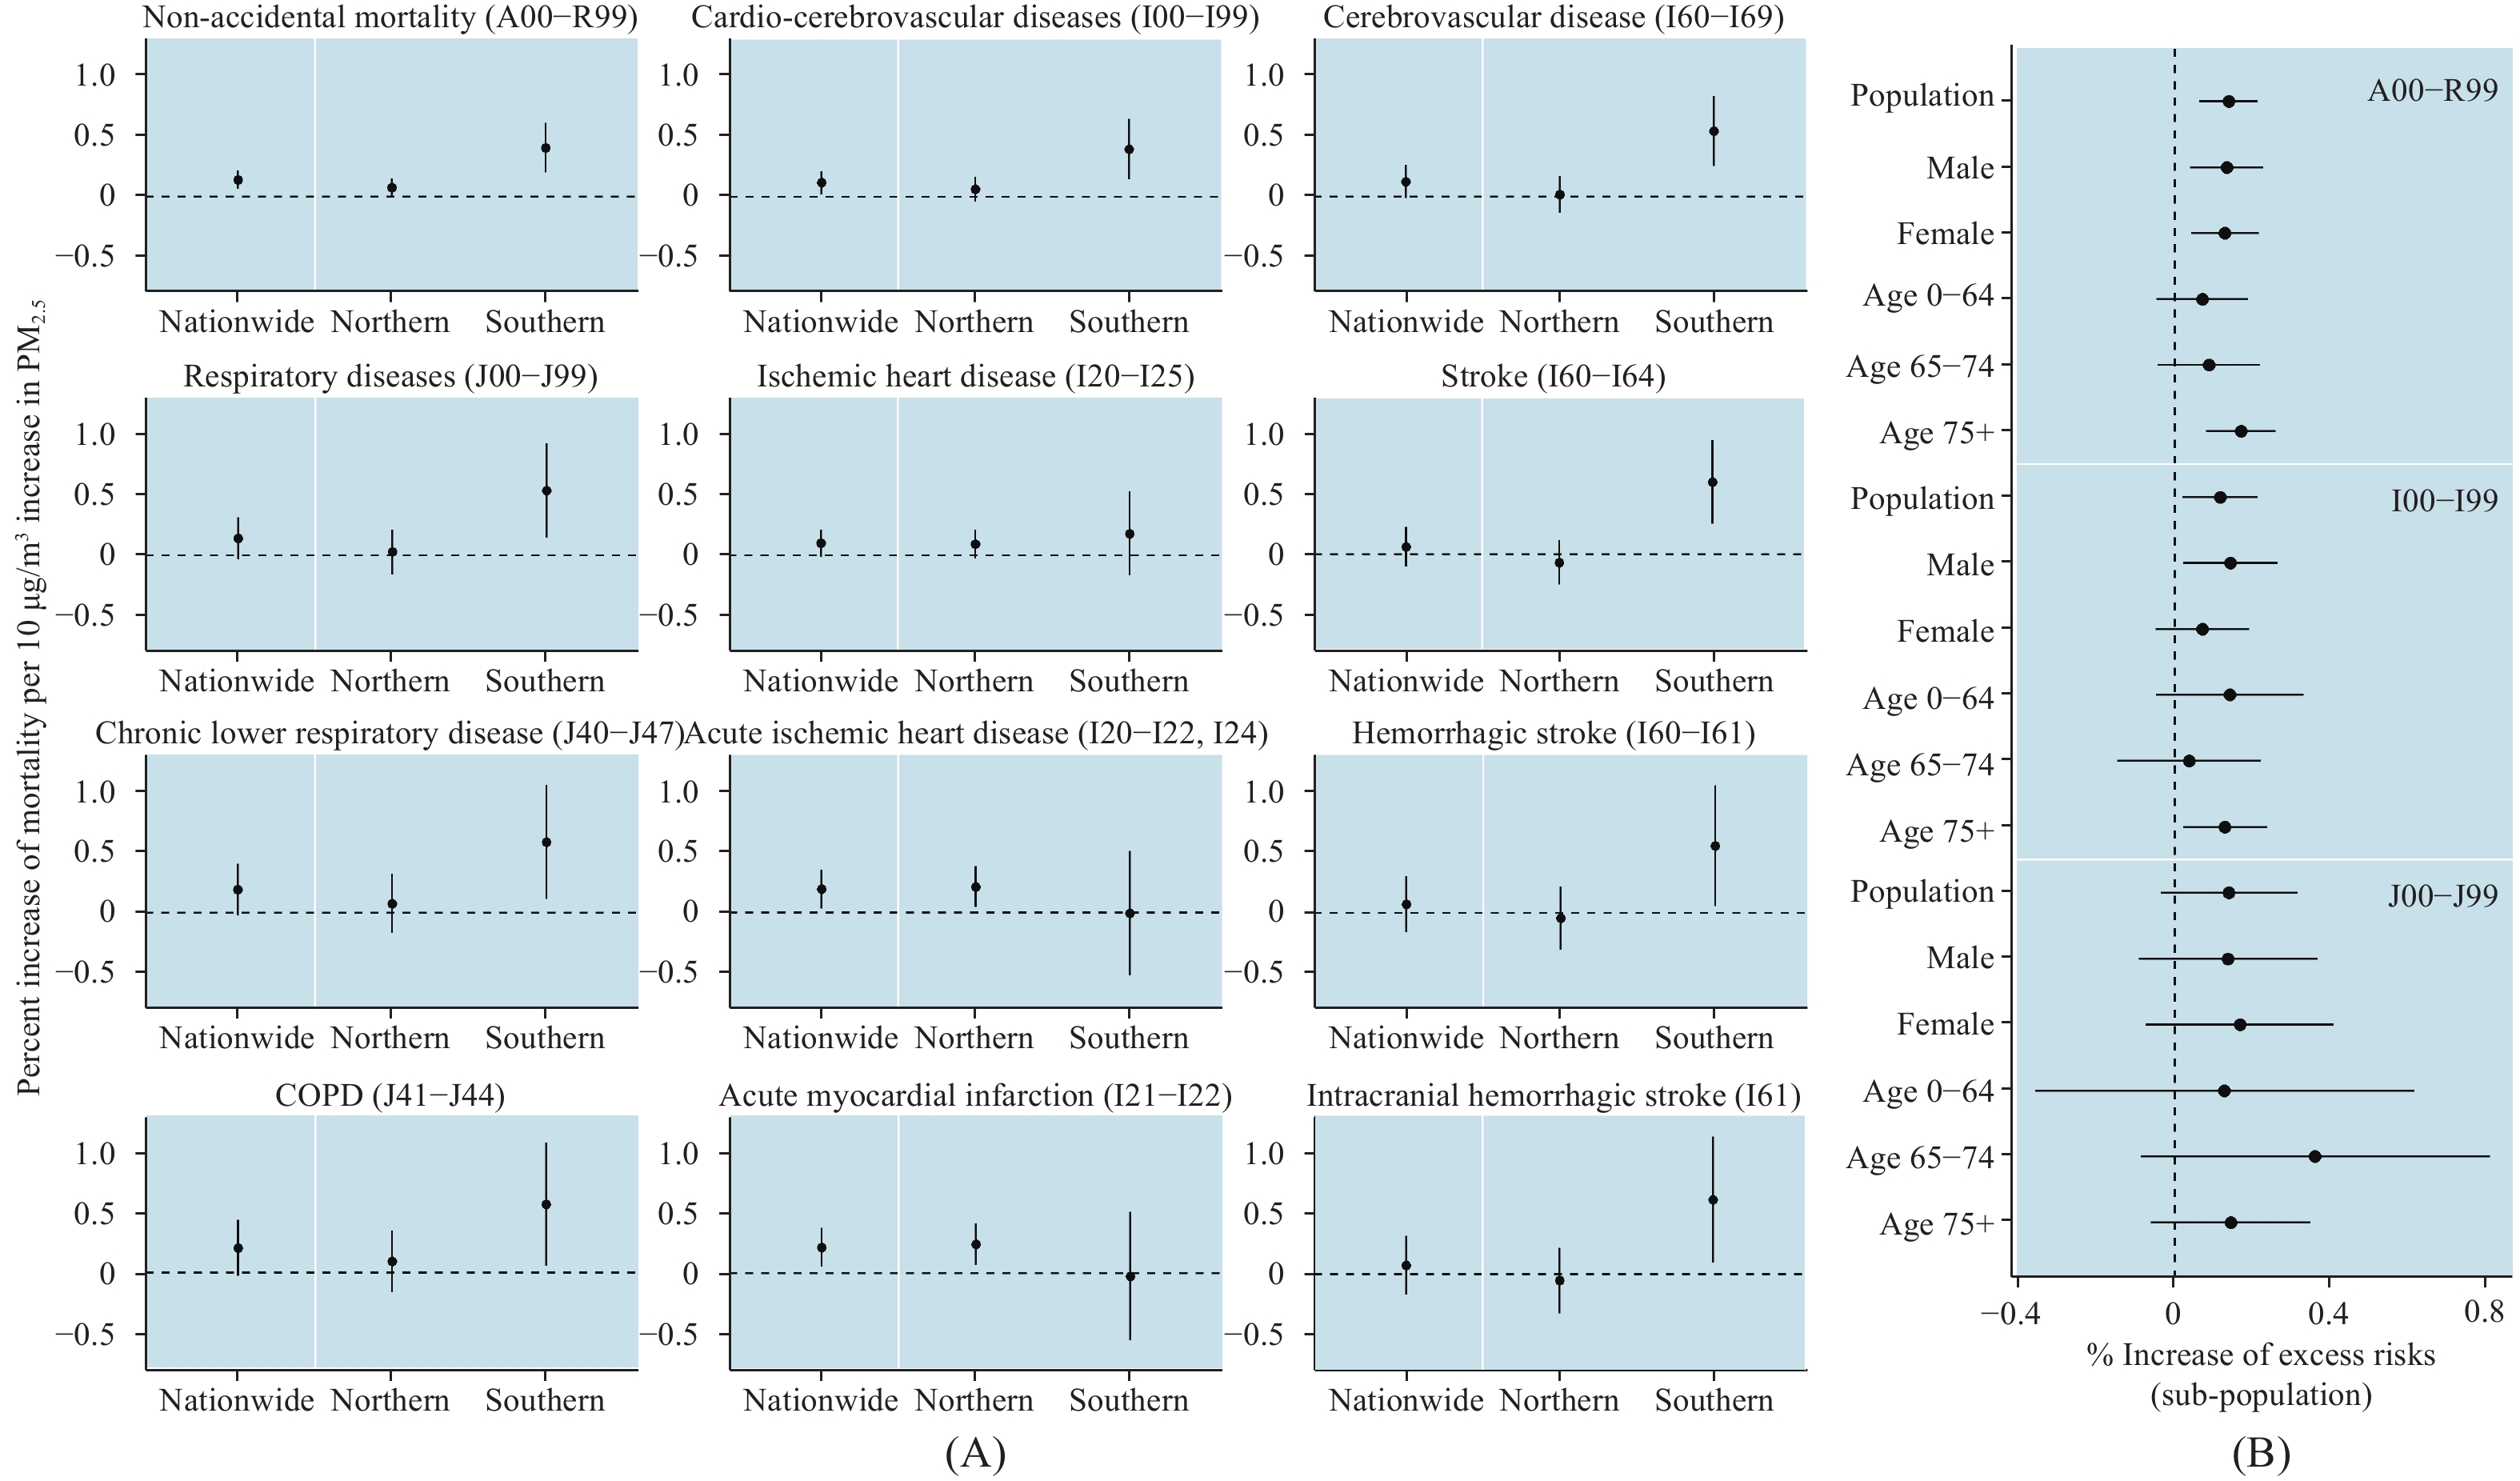 Figure 2.
Percent increase of cause-specific mortality per 10 μg/m3 increase in PM2.5. Nationwide, north-south region-specific and subpopulation estimates for lag 02 exposure are presented (error bars represent 95% CIs of the estimates; ICD-10 codes of causes are shown in brackets).
(Error bars represent 95% CIs of the estimates. ICD-10 codes of causes are shown in brackets.)Estimated CCVD values (Figure 2B) for males (ER=0.14%, 95% CI: 0.02-0.26) were slightly stronger than those of females (ER = 0.07%, 95% CI: −0.05-0.19). Individuals over 75 years old also showed significantly higher susceptibility to PM2.5 in two categories (non-accidental: ER=0.17%, 95% CI: 0.08-0.26; cardio-cerebrovascular: ER=0.13%, 95% CI: 0.02-0.24).
Cause-specific estimates of PM2.5-mortality associations at lag 02 also varied from northern regions to southern regions (Figure 2A). Northern China had relatively weak associations with non-accidental and respiratory mortality, but stronger associations with acute myocardial infarction (ER=0.23%, 95% CI: 0.07-0.40) and acute ischemic heart disease (ER=0.21%, 95% CI: 0.05-0.38). For Southern China, risk estimates for non-accidental (ER=0.40%, 95% CI: 0.20-0.60), cerebrovascular (ER=0.54%, 95% CI: 0.25-0.82) and respiratory mortality (ER=0.53%, 95% CI: 0.15-0.93) tended to be much larger, especially stroke (ER=0.60%, 95% CI: 0.25-0.95) and intracranial hemorrhagic-stroke (ER=0.61%, 95% CI: 0.09-1.12).
HTML
-
Stratified analyses by sex and age were used to reveal which populations were more vulnerable to PM2.5, and the results reflected that males and people aged 75 years and older had higher ERs. Varying sex-specific acute effects of PM2.5 could be attributed to smoking status (6-7), of which the rate of daily smoking among males is generally higher than that of females in China. Higher ER for individuals over 75 are consistent with previous epidemiological studies on acute effects of PM2.5 and may be due to age-related deterioration of cardio-cerebrovascular and respiratory function in older adults and a much higher prevalence of age-related diseases than that of younger age groups (1,8).
The effect sizes of short-term PM2.5 exposure nationwide reported here are smaller than that of comparable studies in Europe, the United States, and other WHO regions (2-3). A national time series study in the United States (2) with an average concentration of PM2.5 less than 25 μg/m3 from 1999–2005, estimated 0.98% (95% CI: 0.75, 1.22%), 0.85% (95% CI: 0.46, 1.24%) and 1.68% (95% CI: 1.04, 2.33%) increases per PM2.5 10 μg/m3 increases in non-accidental, cardiovascular, and respiratory mortality, respectively. Moreover, a meta-analysis of related studies in other WHO regions⑤ indicated that the association for cardio-cerebrovascular mortality (0.84%) was smaller than for respiratory mortality (1.51%) (3), while cardio-cerebrovascular mortality was more sensitive than respiratory mortality to acute PM2.5 exposure in our study.
Variability in effect sizes across nations or regions, including differences between China’s northern and southern regions, may be due to a combination of differences in population vulnerability, socioeconomic development, differing chemical composition of PM2.5 and resulting toxicity to humans, and the nonlinear exposure-response relationship between PM2.5 and mortality, i.e. the slope of this exposure-response curve might decline as exposure increases (4,5).
Although mean daily PM2.5 concentrations have dropped in the 130 counties from 2013 (roughly 81.6 μg/m3) to 2018 (roughly 44.0 μg/m3), they still exceed the Interim Target-1 (35.0 μg/m3) of WHO Air Quality guidelines. The estimates reported here consistently show that short-term PM2.5 exposure has had a significant impact on population health in China, specifically increasing the risk of acute cardiovascular causes of death, such as acute ischemic heart disease and acute myocardial infarction.
These findings are subject to at least three limitations. First, as in most time-series studies, exposure misclassification was inevitable as related-PM2.5 health effects were likely underestimated due to ambient concentrations from fixed-monitoring sites being used as proxies for true exposure levels (9). Secondly, study sites included in the study were limited by data accessibility, both on PM2.5 monitoring data and death records. Some included study sites did not have complete data, which may reduce the statistical power of the analysis. Finally, this study only focused on PM2.5 and did not involve PM10 and gaseous pollutants, which should be estimated in future research.
These findings suggest that policymakers should push forward the National Plan for Air Pollution Prevention and Control in China and suggest that additional consideration for susceptible populations and emission reduction measures be tailored towards local pollution circumstances.
-
The study is funded by National Key Research and Development Program of China (No. 2016YFC0206500) and National research program for key issues in air pollution control (No. DQGG0401).
Items No. of counties % increase (95%CI) The Main Analysis dftime=6, dftemperature=3, dfhumidity=3 130 0.14 (0.06, 0.21) Alternative Degrees of Freedom dftime=7, dftemperature=3, dfhumidity=3 130 0.14 (0.06, 0.21) dftime=8, dftemperature=3, dfhumidity=3 130 0.17 (0.09, 0.25) dftime=6, dftemperature=5, dfhumidity=5 130 0.15 (0.07, 0.22) dftime=7, dftemperature=3, dfhumidity=5 130 0.15 (0.07, 0.22) dftime=8, dftemperature=3, dfhumidity=5 130 0.18 (0.11, 0.26) Different Period Subsets only 6-year dataset 42 0.09 (-0.02, 0.19) 6- and 5-year dataset 89 0.10 (0.02, 0.18) 6-, 5- and 4-year dataset 128 0.13 (0.06, 0.21) Table S1. Summary estimates (95%CIs) of sensitivity analysis
FootNote
| ① | CI=Confidence Interval. |
| ② | Time trend and meteorological factors (temperature and relative humidity) were controlled with a natural cubic regression spline with the degrees of freedom (df) that minimize the QAIC value of GAM. This analysis chose 6 df per year for time trend, with 3 df for meteorological factors. A dummy variable for the day of the week was also included for potential confounding. |
| ③ | This study also summarizes the association between mortality and PM2.5 current day (lag 0), a single-day lag of 1 (lag 1), 2 (lag 2), and 3 days (lag 3), and 2-day moving average of the current- and previous- day (lag 01) exposures (Figure S1). When examining the patterns of lag effects for short-term PM2.5 exposure on non-accidental, cardio-cerebrovascular and respiratory death, associations at the single-lag exposures were estimated to be significant on lag 1 and 2 days, and insignificant on lag 3 days. Significance peaked at lag 02. Sensitivity analysis methods and results are presented in the supplementary materials. |
| ④ | Although non-significant effects for respiratory and cerebrovascular causes were found, the lower limits of the confidence interval for respiratory causes were very close to zero. |
| ⑤ | China was excluded due to limited evidence. |
| Citation: |

|