

 Download:


-
Disparities in coronavirus disease 2019 (COVID-19) vaccination coverage among countries have been observed following the introduction of COVID-19 vaccines, which has hindered global efforts to control the pandemic. The 80% of the world’s population only had access to approximately 5% of the total COVID-19 vaccines available (1), and vaccination rate per capita in high-income countries is approximately 7.8 times higher than that in low-income countries (2), leading to prolonged impacts of the pandemic (1,3). In addition to the financial status of individuals or countries, there could be additional factors that influence people’s willingness to receive the vaccine, which public health agencies might consider or address. Gaining insights into the underlying reasons behind COVID-19 vaccine uptake would enhance global preparedness for the potential pandemics in the future.
There is a need to better understand the factors contributing to disparities in COVID-19 vaccination rates across countries. This goes beyond the economic reasons that have been previously studied (4–5). Therefore, our study aims to identify the country-level predictors that contribute to global disparities in COVID-19 vaccine coverage.
-
Complete COVID-19 vaccination coverage data were collected for each country/territory as of July 2022 from a public database (
https://ourworldindata.org/ ). COVID-19 vaccination coverage is measured by total number of people who received all doses prescribed by the initial vaccination protocol, divided by the total population of the country. Additionally, we gathered various country-level indicators including demographics, social development status, pandemic preparedness, governance, trust, COVID-19 Vaccines Global Access (COVAX) participation, and COVID-19 vaccine acceptance and delivery. COVAX is a global risk-sharing mechanism for pooled procurement and equitable distribution of COVID-19 vaccines, including two participating mechanisms — advance market commitment and self-financing. The role of advance market commitment is to leverage the scale assured by the participation of higher-income economies to ensure that lower-income ones are also able to participate. Countries with sufficient supply could opt out of getting COVAX doses, leaving more doses for others. For detailed information on each variable and its sources, please refer toSupplementary Table S1 .To illustrate the global disparity in the percentage of people fully vaccinated against COVID-19, we utilized R (version 4.2.1, R Core Team, Murray Hill, NJ, USA) to create a scatter plots, along with linear regression lines, visualized the association between COVID-19 vaccination coverage and vaccine delivery or acceptance.
Univariate linear regressions were conducted to assess the relationship between various country-level indicators and COVID-19 vaccination coverage at the country level. Considering the possible multicollinearity among country-level indicators, we employed the Least Absolute Shrinkage and Selection Operator (LASSO) regression for variable selection. The selected country-level indicators were then included in a multifactorial regression to identify predictors of COVID-19 vaccination coverage. Note that the categorical variable (COVAX participation) was not part of the LASSO regression but included in the multifactorial regression. All statistical analyses were performed using Stata (version 16; Stata Corp., TX, USA) with a significance level of 0.05.
-
As of July 2022, COVID-19 vaccination coverage varied widely among the 219 countries and territories, ranging from 0.13% to 126.79% (Figure 1). COVID-19 vaccination coverage was positively correlated with delivered doses per capita and vaccine acceptance (Figure 2). Note that despite some countries having high vaccine delivery per capita (e.g., Austria, Liechtenstein, Hungary, Dominica, Saint Vincent and the Grenadines, and Djibouti) or high vaccine acceptance rates (e.g., Somalia, Bosnia and Herzegovina, Paraguay, Iran, Nepal, Indonesia, and Brazil), they still experienced low COVID-19 vaccination coverage.
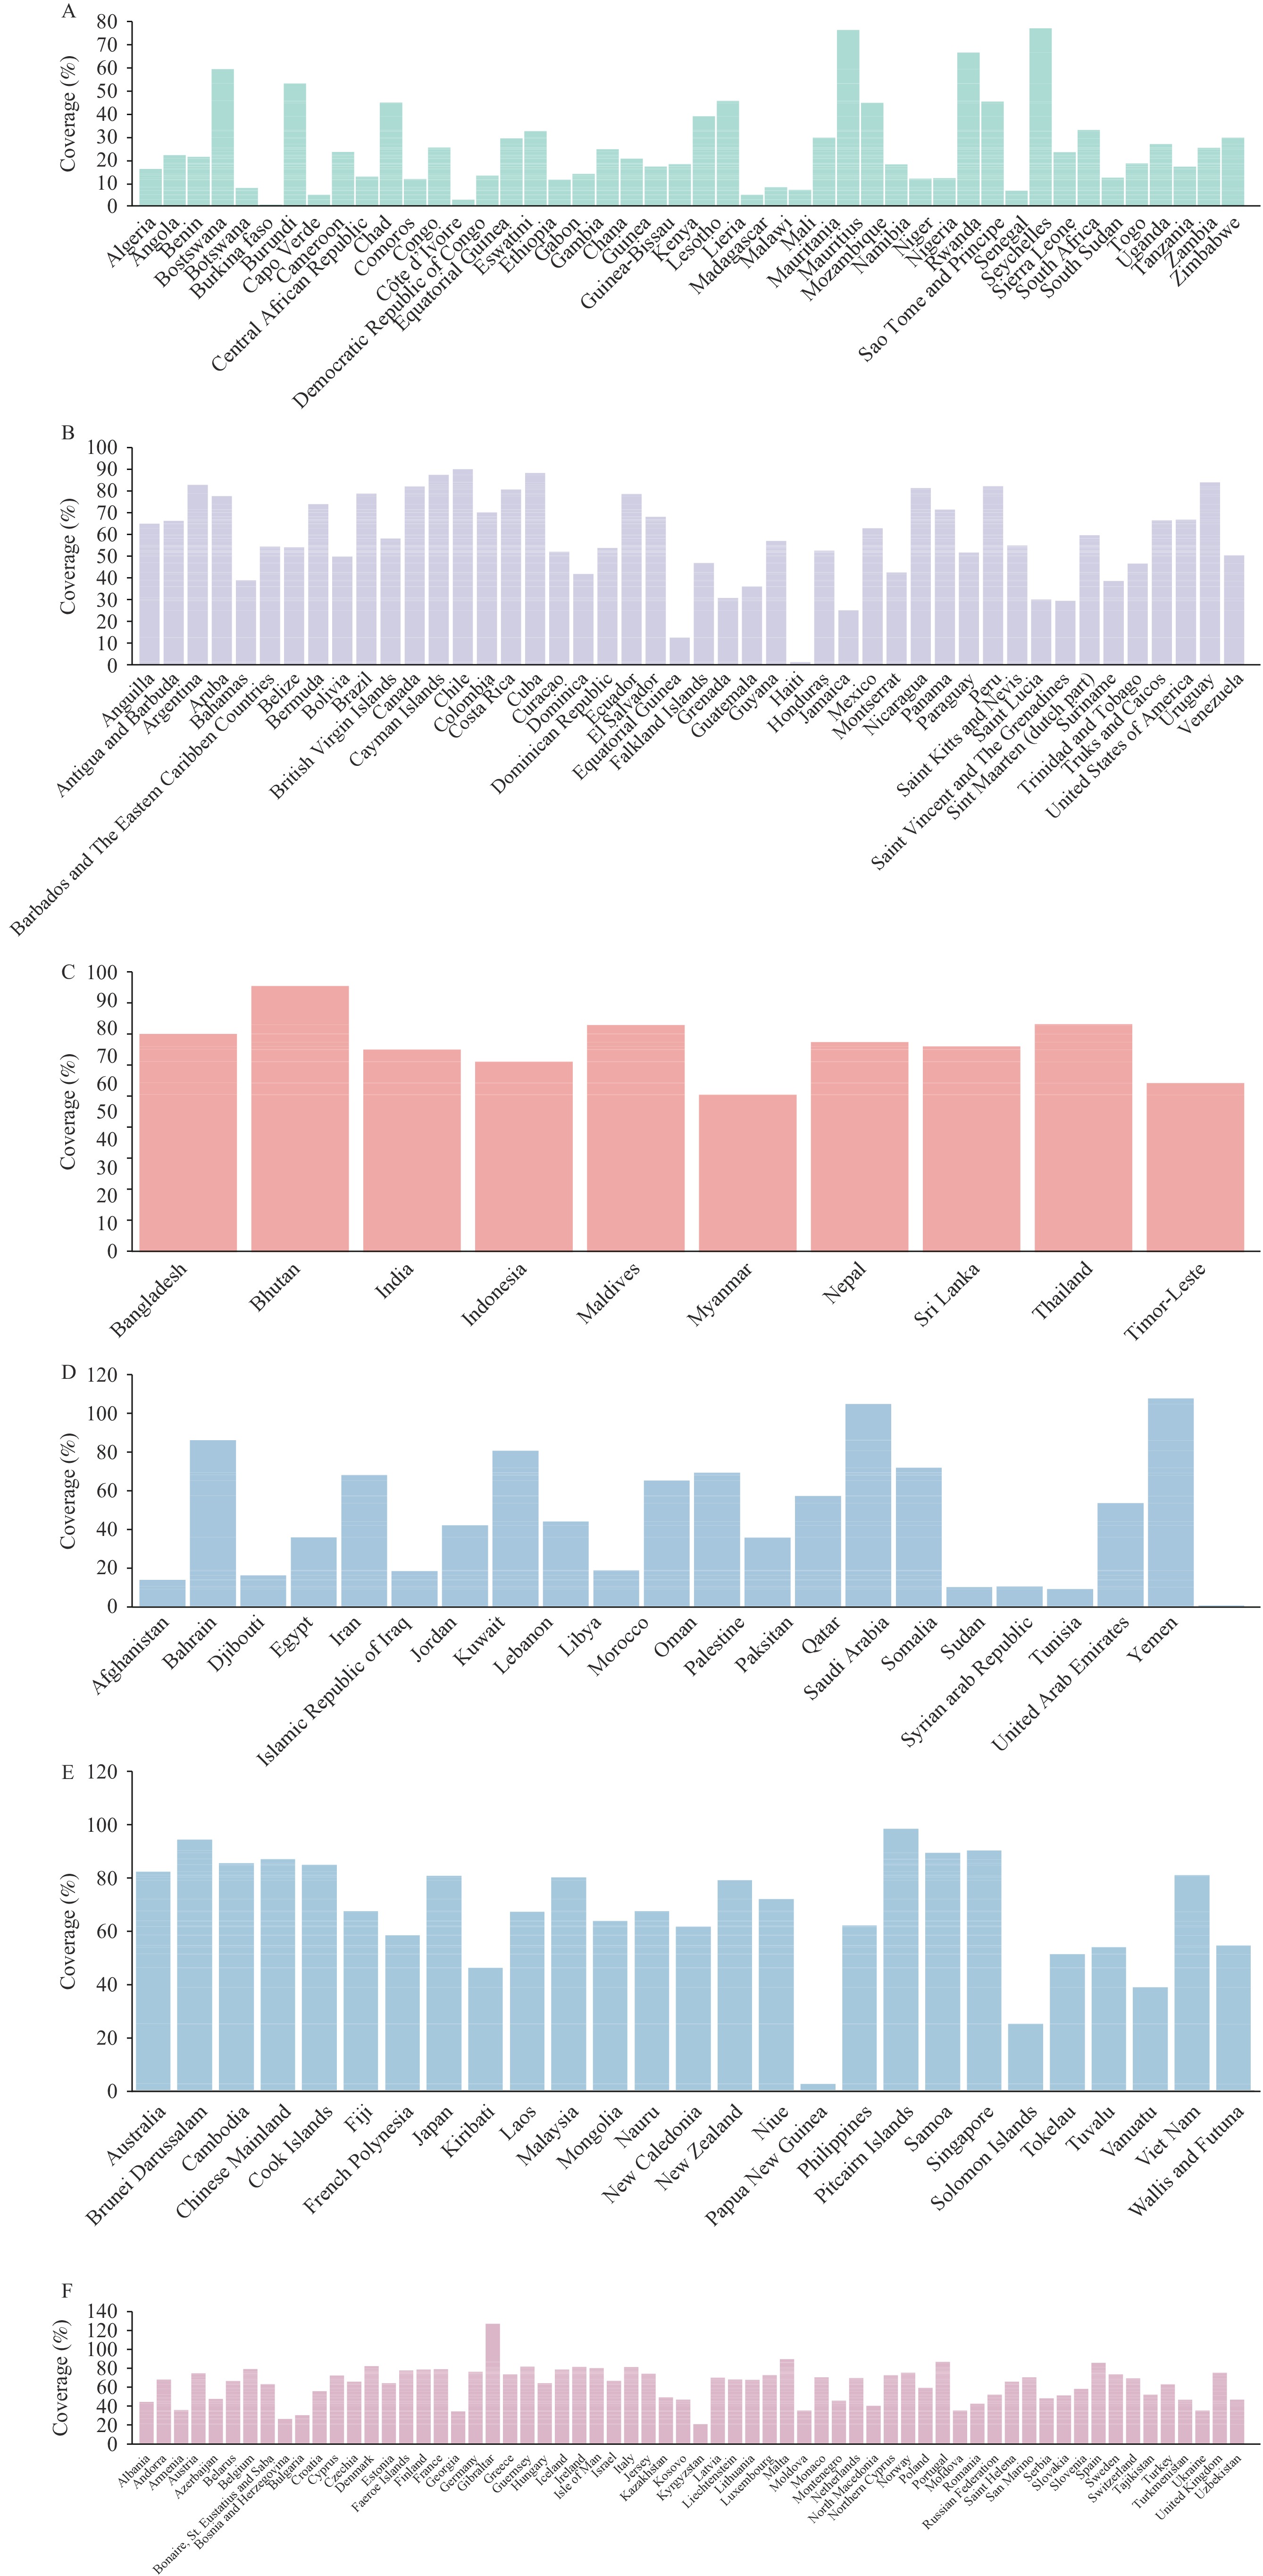 Figure 1.
Full COVID-19 vaccination coverage in six WHO regions as of July 19, 2022. (A) Africa; (B) Americas; (C) South-east Asia; (D) Eastern mediterranean; (E) Western Pacific; (F) Europe.
Note: Since vaccination is available to both residents and non-residents such as tourists and foreign workers, vaccination coverage in some countries or territories may exceed 100%. Tonga (vaccine coverage rate of 91.64%) is not shown separately due to its location in Oceania. Full COVID-19 vaccination coverage rates in the regions of Hong Kong SAR, Macau SAR, and Taiwan, China are 86.61%, 85.51%, and 83.16%, respectively
Abbreviation: WHO=World Health Organization; COVID-19=coronavirus disease 2019; SAR=Special Administrative Region.
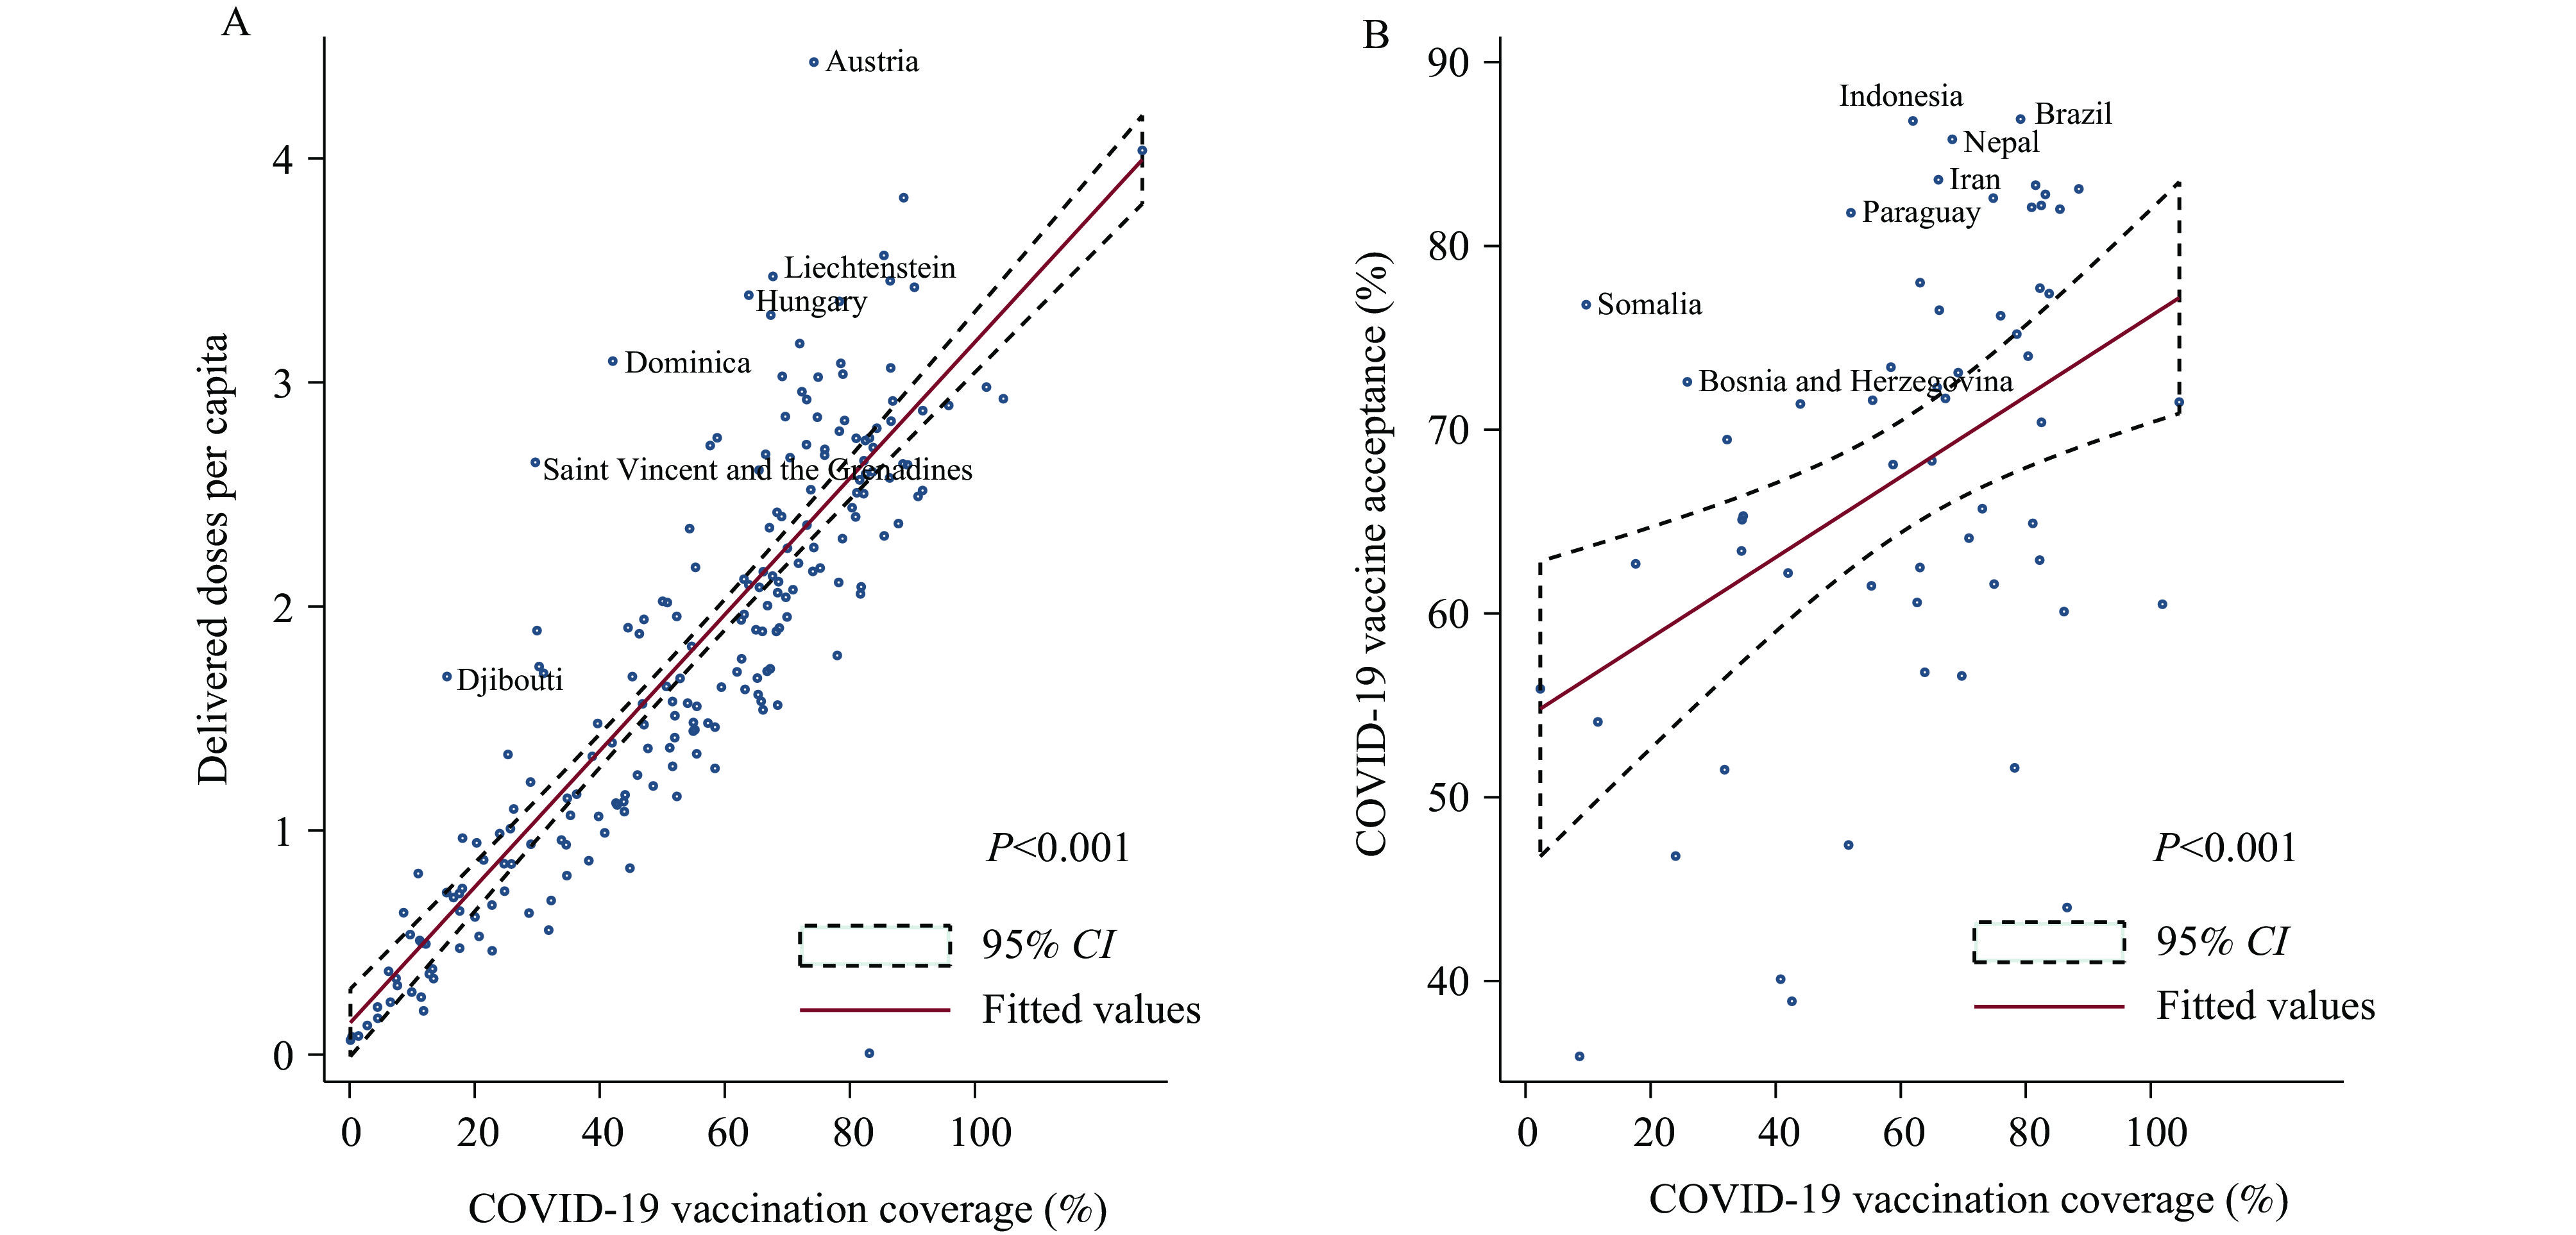 Figure 2.
Correlations between COVID-19 vaccination coverage and vaccine delivery/acceptance as of July 19, 2022. (A) vaccine delivery; (B) vaccine acceptance.
Abbreviation: COVID-19=coronavirus disease 2019; CI=confidence interval.Univariate linear regressions showed that significant correlations (P<0.05) were found between COVID-19 vaccination coverage and all country-level indicators analyzed (Table 1). When examining demographic characteristics, a positive association was observed between vaccination coverage and the proportion of urban population (R2=24.3%), and the proportion of population aged 65 and above (R2=27.2%). In contrast, a negative association was observed with the proportion of population aged 0−14 (R2=51.4%). In terms of social development indicators, vaccination coverage showed positive associations with the socio-demographic index (R2=44.2%) and GDP per capita (R2=49.9%). Positive associations were also found with indicators measuring preparedness for pandemics, including the epidemic ready score (R2=55.8%), global health security index (R2=33.3%), number of medical doctors per 1,000 people (R2=30.2%), and vaccine manufacturing capability (R2=4.8%). Among indicators related to governance and trust, vaccination coverage displayed positive correlations with government effectiveness (R2=52.4%), control of corruption (R2=39.6%), trust in government (R2=10.4%), trust in science (R2=35.1%), and interpersonal trust (R2=22.6%). Conversely, state fragility (R2=53.8%) showed a negative correlation. Regarding COVAX, vaccination coverage was negatively associated with participation in COVAX through advance market commitment (R2=28.9%), but not significantly associated with self-financing participation in COVAX.
Variables N Univariate linear regressions Multifactorial regressions Coefficient, 95% CI P-value R2 Coefficient, 95% CI P−value Demographics Urban population, % 196 0.57 (0.43, 0.71) <0.001 24.3% Population aged 65 and above, % 181 2.12 (1.61, 2.63) <0.001 27.2% −0.88 (−2.30, 0.53) 0.214 Population aged 0–14, % 181 −1.89 (−2.16, −1.62) <0.001 51.4% −2.22 (−3.10, −1.34) <0.001 Social development status Socio-Demographic Index 188 99.01 (82.91, 115.10) <0.001 44.2% Ln (GDP per capita) 175 12.90 (10.96, 14.83) <0.001 49.9% Pandemic preparedness Epidemic Ready Score 94 1.09 (0.89, 1.29) <0.001 55.8% 0.50 (0.12, 0.88) 0.011 Global Health Security Index 181 1.12 (0.88, 1.35) <0.001 33.3% Doctors per 1,000 people 189 0.83 (0.65, 1.01) <0.001 30.2% −0.04 (−0.46, 0.37) 0.831 Vaccine manufacturing capability 219 14.46 (5.86, 23.07) 0.001 4.8% −1.39 (−10.74, 7.95) 0.765 Governance Government effectiveness 196 19.16 (16.57, 21.74) <0.001 52.4% Control of corruption 196 16.60 (13.70, 19.50) <0.001 39.6% State fragility 176 −7.79 (−8.87, -6.71) <0.001 53.8% Trust Trust in government, % 106 0.41 (0.18, 0.65) 0.001 10.4% 0.25 (0.03, 0.46) 0.024 Trust in science, % 112 1.22 (0.91, 1.54) <0.001 35.1% Interpersonal trust, % 56 0.72 (0.36, 1.08) <0.001 22.6% COVAX participation Participation in COVAX through advance
market commitment219 −28.09 (−35.95, −20.23) <0.001 28.9% 10.03 (−4.36, 24.41) 0.167 Self-financing participation in COVAX 219 1.20 (−0.66, 9.06) 0.764 28.9% −1.69 (−17.60, 14.22) 0.831 Abbreviation: COVID-19=coronavirus disease 2019; CI=confidence interval; GDP=gross domestic product; COVAX=COVID-19 vaccines global access. Table 1. Associations between country-level characteristics and COVID-19 vaccination coverage by univariate and multifactorial regression.
Following variable selection through LASSO regression, the final variables retained for the multifactorial regression analysis were population aged 65 and above, population aged 0–14, epidemic readiness score, doctors per 1,000 people, vaccine manufacturing capability, trust in government, participation in COVAX through advance market commitment, and self-financing participation in COVAX. In the multifactorial regression, population aged 0–14 [coefficient −2.22, 95% confidence interval (CI): −3.10, −1.34], epidemic readiness score (coefficient 0.50, 95% CI: 0.12, 0.88), and trust in government (coefficient 0.25, 95% CI: 0.03, 0.46) were found to be significant predictors of vaccination coverage when accounting for other factors. However, population aged 65 and above, doctors per 1,000 people, vaccine manufacturing capability, and COVAX index were not found to be significant predictors (Table 1).
-
This study examined the factors influencing the differences in COVID-19 vaccination coverage across countries. Our findings indicated that a lower proportion of the population aged 0–14, improved pandemic preparedness, and increased levels of trust were strongly associated with higher COVID-19 vaccination coverage.
Policy responses implemented globally in response to the COVID-19 pandemic have the potential to disrupt the plans and routines of populations, highlighting the importance of high trust and compliance (6). Past research has demonstrated that confidence in both the government and healthcare systems leads to increased vaccination rates and sustained support for pandemic control measures (7). The findings of this study underscore the critical role of establishing trust in the government, not only in terms of its ability to detect, contain, and prevent epidemics, but also in terms of ensuring transparency, openness, and reliability. These factors are essential in safeguarding individuals from the spread of misinformation and conspiracy theories, particularly in the era of the internet and the prevailing sense of uncertainty surrounding emerging pandemics.
The demographic characteristics of a country are important factors in determining its vaccine requirements. A higher proportion of urban population may be associated with a greater perceived risk of COVID-19 infection, leading to higher promotion of COVID-19 vaccination. This perception of higher risk may also explain why countries with more older adults or a lower proportion of children have higher vaccination coverage. Also, older adults are given priority in global vaccination campaigns. However, it is also crucial to focus on improving vaccine coverage among children and adolescents aged 0–14 years.
Differences in COVID-19 vaccination coverage among countries can be partly attributed to their social development status, indicating unequal distribution and uptake of vaccines. The high cost and monopolization of vaccine technology have resulted in limited supply and access for low-income countries. It is recommended that vaccine-producing countries, particularly low-income nations, enhance their emergency vaccine production and ultracold storage capacity. Additionally, cross-country vaccine distribution mechanisms such as the Global Alliance for Vaccines and Immunizations (GAVI) should play a more active role in addressing inequality issues in COVID-19 and future pandemics (8). As an example, GAVI has launched the African Manufacturing Vaccine Accelerator (AMVA) program to promote self-sufficiency in the future supply of essential immunization and life-saving vaccines for African countries (9).
Sufficient preparedness for pandemics is crucial for enhancing vaccine coverage in countries. It has been proposed by researchers that essential elements of pandemic preparedness should cover robust surge capacities in health systems, including an adequate personnel, medical supplies, and intensive care beds. Additionally, global cooperation should not be underestimated. Participation in international collaborative initiatives like COVAX can strengthen global response systems and vaccine supply chains (10).
We also identified countries that deviate from the expected relationship between vaccine acceptance/delivery rates and COVID-19 vaccination coverage. In countries where vaccine delivery is high but coverage is low, there may be a lack of willingness to receive vaccines, indicating the need for improved health communication to enhance vaccine acceptance. Building trust is a crucial step in addressing this issue, with a focus on engaging healthcare systems to provide accurate vaccine safety information to the public through local authorities and religious leaders (11–12). On the other hand, countries with high vaccine acceptance but low coverage require efforts to improve COVID-19 vaccine supplies and ensure equity, both at the national and global levels.
-
No conflicts of interest.
HTML
| Citation: |

|