

 Download:


-
Human parainfluenza viruses (HPIVs) are significant viral agents causing acute respiratory infections (ARIs) and severe acute respiratory infections (SARIs) in children globally (1–3). Currently, there are four known serotypes (HPIV1 to HPIV4) (2). HPIV1 and HPIV3 are more prevalent, with epidemics typically occurring in the fall and summer, respectively. In contrast, HPIV2 and HPIV4 are primarily active during the winter and spring months (4–5). The coronavirus disease 2019 (COVID-19) pandemic has led to observable seasonal changes in the patterns of several respiratory viruses (6–7). The objective of this study was to analyze epidemiological characteristics of HPIVs infections, aiming to offer a crucial scientific groundwork for preventing and controlling HPIVs epidemic in China.
-
Clinical samples were collected from 11 sentinel sites across 10 provincial-level administrative divisions (PLADs), including seven PLADs in northern China (Beijing Municipality; Inner Mongolia Autonomous Region; and Henan, Gansu, Jilin, Liaoning, and Shandong provinces) and three PLADs in southern China (Chongqing Municipality, Jiangxi and Guangdong provinces). Following the case definitions in the guideline for hospitalized acute respiratory infections (ARIs) and severe acute respiratory infections (SARIs, 2011 version) released by the National Health Commision (8), a minimum of 20 ARIs patients per month were included in the study, with respiratory samples taken for pathogen screening. The study was approved by the Second Ethics Review Committee of the National Institute for Viral Disease Control and Prevention at China CDC, and informed consent was obtained from all patients or their guardians before sample collection.
A commercial nucleic acid detection kit (Kinghawk, Beijing, China) was used to identify twelve viral respiratory pathogens, including HPIVs (HPIV1 to HPIV4), respiratory syncytial virus (HRSV), influenza virus (IFV), human adenovirus (HAdV), human rhinovirus (HRV), human metapneumovirus (HMPV), human enterovirus (HEV), human bocavirus (HBoV), and human coronavirus (HCoV). Prior to testing, all assays underwent validation.
Categorical data were analyzed using the chi-square (χ2) test and Fisher’s exact test, while continuous data were assessed using median tests. Statistical analyses were conducted using R (version 4.1.3, R Core Team and the R Foundation for Statistical Computing, Vienna, Austria). Statistical significance was defined as a P-value <0.05.
-
During the study period, we enrolled 12,866 cases of ARIs. Excluding the 14.18% (1,825) of cases that lacked relevant clinical information, 70.46% (9,066) were classified as SARIs, while 15.35% (1,975) were considered mild ARIs. The median age of patients with ARIs was 3 years (range: 1 day to 100 years), and 71.34% were under the age of 5 years. A majority of the patients, 80.7% (10,378/12,866) hailed from northern PLADs (Table 1), with males accounting for 57.88%. The overall viral detection rate among the ARIs was 38.18% (4,912/12,866). HPIVs were identified in 6.15% (791/12,866) of the cases, being the third most frequently detected viruses following HRSV at 12.37% (1,592/12,866) and HRV at 9.44% (1,214/12,866). Within the HPIVs-positive ARIs, HPIV3 was the most common serotype, accounting for 54.61% (432/791), followed by HPIV1 at 27.18% (215/791), HPIV2 at 12.77% (101/791), and HPIV4 at 6.19% (49/791) (Table 1,
Supplementary Table S1 ).PLADs Period No. of samples Region of China No. of HPIVs cases included in the analysis HPIV1 (%) HPIV2 (%) HPIV3 (%) HPIV4 (%) HPIVs Jilin 2019–2023 2,927 Northern 60 (43.5) 1 (0.7) 78 (56.5) 0 (0) 138* Henan 2019–2022 2,068 Northern 24 (22.6) 22 (20.8) 45 (42.5) 15 (14.2) 106 Shandong 2019–2023 1,509 Northern 21 (18.2) 14 (12.1) 76 (66.0) 5 (4.3) 115† Gansu 2020–2023 1,446 Northern 34 (23.1) 35 (23.8) 66 (44.9) 12 (8.2) 147 Beijing 2019–2023 1,444 Northern 36 (36.7) 14 (14.3) 40 (40.8) 9 (9.2) 98† Inner Mongolia 2021–2023 537 Northern 0 (0) 8 (21.6) 25 (67.6) 4 (10.8) 37 Liaoning 2021–2022 447 Northern 0 (0) 3 (60.0) 2 (40.0) 0 (0) 5 Jiangxi 2021–2023 1,069 Southern 4 (57.1) 0 (0) 3 (42.9) 1 (14.3) 7§ Guangdong 2021–2023 841 Southern 21 (31.3) 0 (0) 46 (68.7) 0 (0) 67 Chongqing 2020–2023 578 Southern 15 (21.1) 4 (5.6) 51 (71.8) 3 (4.2) 71*¶ Total 2019–2023 12,866 China 215 (27.2) 101 (12.8) 432 (54.6) 49 (6.2) 791 Note: Due to co-infection among the four HPIVs serotypes, the total number of cases counted in the table for the four serotypes was higher than the number of actual HPIVs infections.
Abbreviation: HPIVs=human parainfluenza viruses; PLADs=provincial-level administrative divisions.
* it included one case with HPIV1 and HPIV3 co-infection.
† it included one case with HPIV2 and HPIV4 co-infection.
§ it included one case with HPIV1 and HPIV4 co-infection.
¶ it included one case with HPIV3 and HPIV4 co-infection.Table 1. Geographical distribution of HPIVs infections in China from 2019 to 2023.
Out of 9,066 SARIs, the overall viral detection rate was 37.13% (3,366/9,066). The detection rates of HPIVs at 5.40% (490/9,066) in SARIs were in line with ARIs. Among HPIVs-infected individuals, HPIV3 was the most prevalent at 58.16% (285/490), followed by HPIV1 at 27.35% (134/490), HPIV2 at 8.98% (44/490), and HPIV4 at 5.92% (29/490) (
Supplementary Table S2 ).The detection rate of HPIVs among mild ARIs (6.84%, 135/1,975) was similar to that of all ARIs and SARIs. HPIV3 (40%, 54/135) was the most commonly detected type, while HPIV4 (5.93%, 8/135) was the least detected. Interestingly, in mild ARIs, HPIV2 (28.15%, 38/135) had a slightly higher prevalence than HPIV1 (25.96%, 35/135).
-
The detection rate of HPIVs increased from 5.07% (78/1,539) in 2019 to 9.70% (146/1,505) in 2020, decreased to 7.63% (311/4,075) in 2021, and further dropped to 5.04% (208/4,124) in 2022 (Figure 1,
Supplementary Table S3 ). The epidemics of HPIV1 and HPIV3 exhibited distinct seasonal patterns.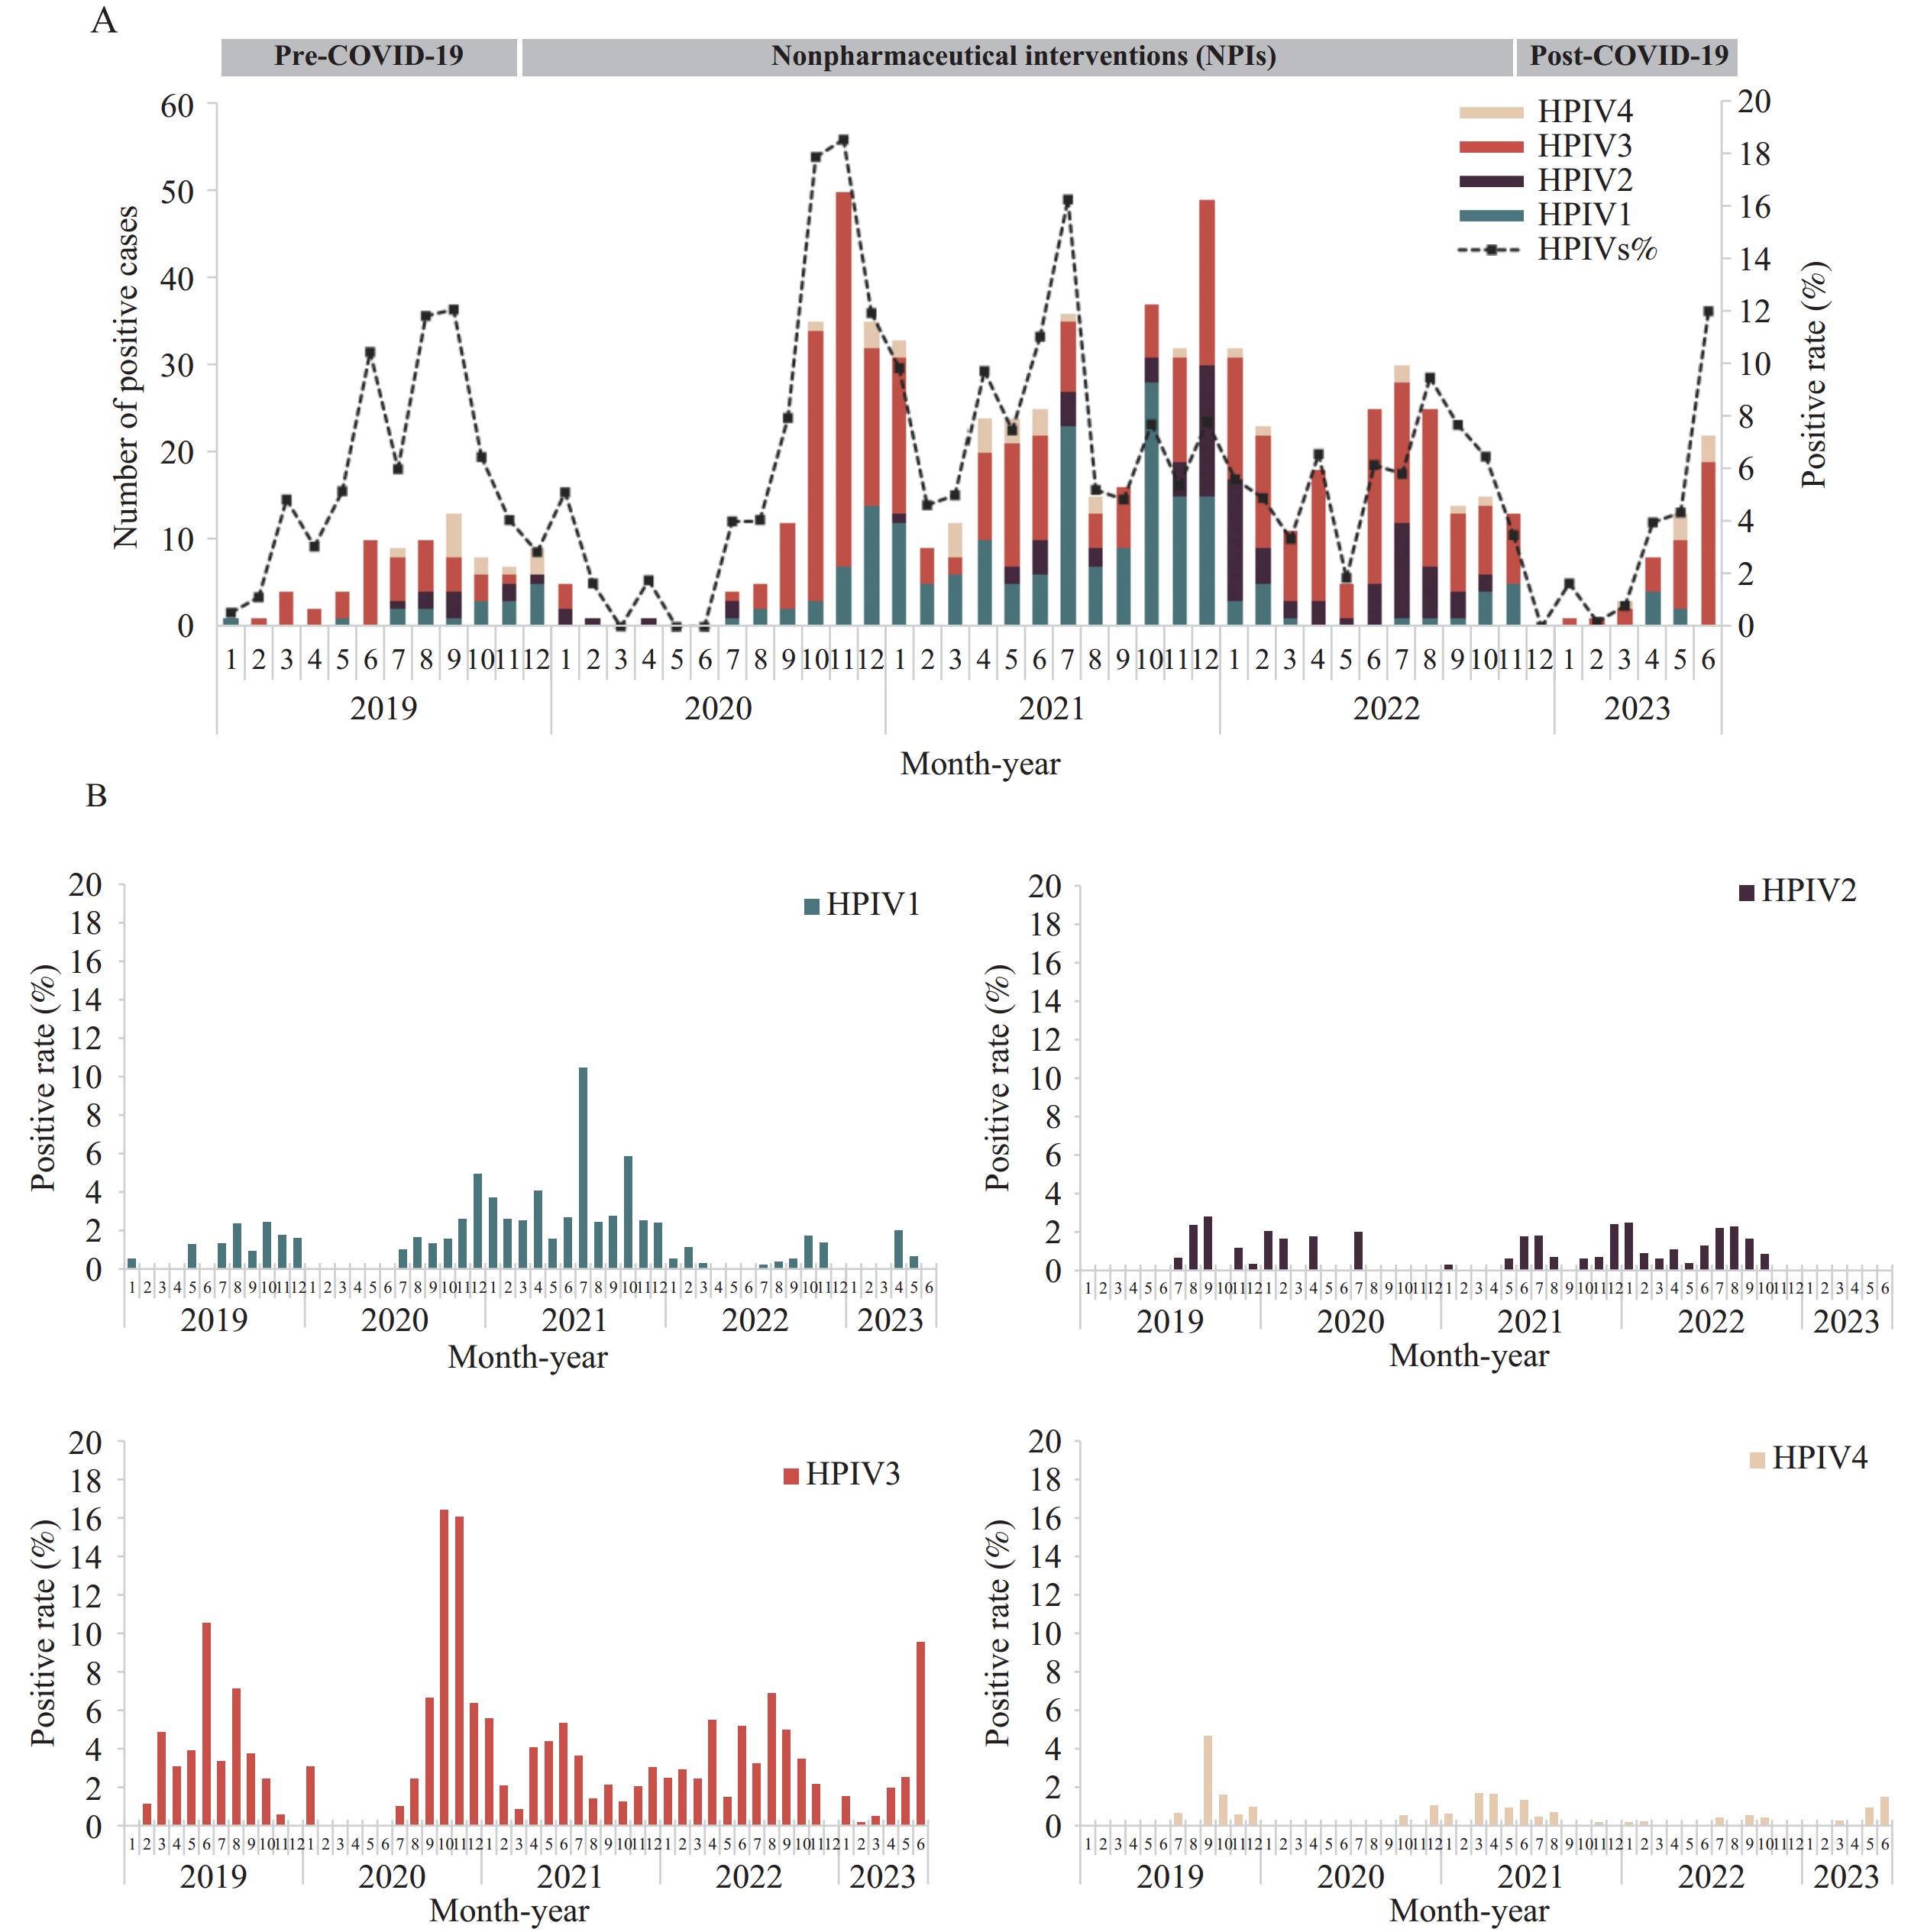 Figure 1.
Season pattern of HPIVs in China from 2019 to 2023. (A) Detection of HPIVs by year. (B) Detection of HPIV1 to HPIV4 by year.
Abbreviation: HPIVs=human parainfluenza viruses; COVID-19=coronavirus disease 2019.The incidence of HPIV1 showed a peak between August and December 2019, then shifted to the winter period from December 2020 to January 2021. Subsequently, two peaks were observed in July and October 2021. In 2021, the detection rate of HPIV1 was highest at 3.46% (141/4,075) (P<0.001) (
Supplementary Table S3 ). However, from January 2022 to June 2023, the detection of HPIV1 decreased, maintaining a relatively low level at 0.51% and 0.37% without a distinct peak (Figure 1).The incidence of HPIV3 differed from HPIV1, peaking in summer (June–August) in 2019, shifting to autumn and winter (October–November) in 2020, and returning to summer (June–August) in 2021 and 2022.
HPIV2 showed the highest detection rate in 2022 (1.24%, P=0.010) and was present all year except in November and December. In contrast, HPIV4 was only sporadically detected, with a higher rate in 2019 (0.78%, P=0.002) (
Supplementary Table S3 ). There was no significant seasonal pattern observed for these two serotypes (Figure 1). -
The prevalence of HPIVs serotypes varied across different PLADs as shown in Table 1. HPIV1 and HPIV3 were the most common in northern and southern China, especially HPIV3 which had a higher prevalence in southern regions (4.02%, 100/2,488) compared to northern regions (3.20%, 332/10,378) (P<0.001). Conversely, the detection rates of HPIV2 (0.93%, 97/10,378) and HPIV4 (0.43%, 45/10,378) were higher in northern PLADs than in the southern PLADs (P<0.001, P=0.047) (
Supplementary Table S3 ). -
Among the 791 patients infected with HPIVs, 59.29% were male, with no sex-based difference observed (Table 2). The median age of the patients was 3 years, ranging from 1 month to 90 years, with the majority being children under 5 years old (77.24%), followed by individuals aged 5–17 years (16.69%) and those aged 65 years and older (3.92%)(Table 2). Notably, a significant difference was found in the age distribution for HPIV2 and HPIV4 infections (P<0.001). HPIV2 was more prevalent in the 5-17 years age group (42.57%), while HPIV4 was predominant in those over 65 years old (12.24%) (Table 2). Moreover, there were no significant variations in sex, age, or region for mono- and co-infections of HPIVs (
Supplementary Table S4 ).Characteristic HPIV1 HPIV2 HPIV3 HPIV4 P HPIVs n=215 n=101 n=432 n=49 n=791 M (Q1, Q3) 3 (1, 4) 4 (3, 6) 2 (1, 3) 3 (2, 5) <0.001 3 (1, 4) Age (years), N (%) <0.001 0–4 169 (78.60) 52 (51.49) 361 (83.56) 33 (67.35) 611 (77.24) 5–17 30 (13.95) 43 (42.57) 52 (12.04) 8 (16.33) 132 (16.69) 18–39 1 (0.47) 0 (0) 1 (0.23) 1 (2.04) 3 (0.38) 40–64 3 (1.40) 2 (1.98) 8 (1.85) 1 (2.04) 14 (1.77) 65+ 12 (5.58) 4 (3.96) 10 (2.31) 6 (12.24) 31 (3.92) Sex, N (%) 0.746 Male 121 (56.28) 59 (58.42) 262 (60.65) 30 (61.22) 469 (59.29) Female 94 (43.72) 42 (41.58) 170 (39.35) 19 (38.78) 322 (40.71) Abbreviation: HPIVs=human parainfluenza viruses; ARIs=acute respiratory infections. Table 2. Demographic characteristics of HPIVs infections among patients with ARIs (January 2019–June 2023).
In 490 SARIs caused by HPIVs, the median age was 2 years (range: 1 month to 90 years). The gender and age distributions of HPIVs infections among SARIs were similar to those in ARIs (
Supplementary Table S5 ). -
The analysis included 6,442 ARIs with complete clinical information, of which 357 cases were HPIVs infections. The symptoms manifested by HPIVs patients included fever (87.39%, P=0.002), cough (83.47%, P=0.023), phlegm production (49.86%, P<0.001), sore throat (33.33%, P<0.001), headache (14.57%, P<0.001), and diarrhea (7.28%, P=0.013) (Table 3). HPIV2-infected patients were particularly more likely to experience fever (97.73%, P=0.024), produce phlegm (72.73%, P<0.001), headaches (65.91%, P<0.001), and sore throats (54.55%, P=0.008). Rhinorrhea was notably seen in HPIV4 infections (75%, P<0.001), although this observation could be influenced by the limited number of HPIV4 cases within the study (Table 3). Additionally, co-infection with HPIVs was associated with a higher incidence of headache symptoms (33.33%), which was higher than that in patients with HPIVs mono-infection (0.97%, P<0.001)(Table 3).
Symptoms HPIVs infection in 6,442 ARIs 4 types of distribution in 357 HPIVs-positive ARIs HPIVs infections status HPIVs-positive HPIVs-negative P HPIV1 HPIV2 HPIV3 HPIV4 P Mono- HPIVs Co-pathogens P (n=357) (n=6,085) (n=108) (n=44) (n=197) (n=8) (n=207) (n=150) Fever 312 (87.39) 4,904 (80.59) 0.002 98 (90.74) 43 (97.73) 164 (83.25) 7 (87.50) 0.024 175 (84.54) 137 (91.33) 0.081 Cough 298 (83.47) 4,762 (78.26) 0.023 90 (83.33) 32 (72.73) 169 (85.79) 7 (87.50) 0.204 180 (86.96) 118 (78.67) 0.053 Sore throat 119 (33.33) 1,243 (20.43) <0.001 30 (27.78) 24 (54.55) 61 (30.96) 4 (50.00) 0.008 60 (28.99) 59 (39.33) 0.053 Rhinorrhoea 114 (31.93) 2,128 (34.97) 0.045 30 (27.78) 14 (31.82) 94 (47.72) 6 (75.00) <0.001 80 (38.65) 64 (42.67) 0.513 Phlegm 178 (49.86) 2,410 (39.61) <0.001 64 (59.26) 32 (72.73) 79 (40.10) 3 (37.50) <0.001 95 (45.89) 83 (55.33) 0.098 Chest pain 2 (0.56) 70 (1.15) 0.437 0 (0) 1 (2.27) 1 (0.51) 0 (0) 0.361 2 (0.97) 0 (0) 0.511 Dyspnea 19 (5.32) 416 (6.84) 0.317 5 (4.63) 3 (6.82) 10 (5.08) 1 (12.50) 0.570 12 (5.80) 7 (4.67) 0.818 Headache 52 (14.57) 437 (7.18) <0.001 15 (13.89) 29 (65.91) 7 (3.55) 1 (12.50) <0.001 2 (0.97) 50 (33.33) <0.001 Abdominal pain 12 (3.36) 195 (3.20) 0.993 5 (4.63) 1 (2.27) 5 (2.54) 1 (12.50) 0.281 8 (3.86) 4 (2.67) 0.747 Diarrhea 26 (7.28) 263 (4.32) 0.013 4 (3.70) 1 (2.27) 21 (10.66) 0 (0.00) 0.074 13 (6.28) 13 (8.67) 0.516 Abbreviation: HPIVs=human parainfluenza viruses; ARIs=acute respiratory infections. Table 3. Clinical characteristics of HPIVs infections.
Among the 278 SARIs caused by HPIVs, common symptoms were “cough” (88.85%, P=0.001), “rhinorrhea” (44.24%, P=0.007), and “diarrhea” (9.35%, P=0.010). Conversely, non-SARIs were more likely to experience symptoms such as “fever” (96.20%, P=0.013), “phlegm” (69.62%, P=0.001), “headache” (56.96%, P=0.010), or “sore throat” (51.90%, P=0.001) (
Supplementary Table S6 ). -
Co-infection was frequent in HPIVs infections, with co-infection rate of 22.12% (175/791). Dual co-infections were the most common (132/175, 75.43%), followed by triple co-infections (26/175, 14.86%) and quadruple or higher co-infections (17/175, 9.71%). The top three pathogens co-infected with HPIVs were HRV (69/791, 8.72%), HRSV (43/791, 5.44%), and HAdV (40/791, 5.06%). However, the rates of co-infection between HPIVs and associated viruses varied by year (P=0.04). The highest co-infection rate with HPIVs was in 2019 (25/78, 32.05%), with HCoV (9/25, 36%) being the most common co-infected virus. The lowest co-infection rate was in 2020 (26/146, 17.81%), with HAdV (10/26, 38.46%) as the predominant co-infected virus. HRV was the primary co-infected virus in 2021 (26/60, 43.33%) and 2022 (25/49, 51.02%). During January–June 2023, both HRV (5/15, 33.33%) and IFV (5/15, 33.33%) were the major co-infected viruses (Table 4).
Time HPIVs infections 8 respiratory viruses co-infected with HPIVs Co-infection status HRSV HAdV HRV HMPV HEV HBoV HCOV IFV Dual Triple and more Total [n, (%)] 2019 78 0 6 7 1 6 2 9* 1 19 6 25 (32.05) 2020 146 5 10* 6 1 7 6 4 1 17 9 26 (17.81) 2021 311 24 13 26* 4 13 13 0 1 43 17 60 (19.29) 2022 208 11 9 25* 3 4 3 2 8 40 9 49 (23.56) 2023 (Jan–Jun) 48 3 2 5* 0 0 2 0 5* 13 2 15 (31.25) Total 791 43 40 69* 9 30 26 15 16 132 43 175 (22.12) Abbreviation: HPIVs=human parainfluenza viruses; HRSV=respiratory syncytial virus; HAdV=human adenovirus; HRV=humanrhinovirus; HMPV=human metapneumovirus; HEV=human enterovirus; HBoV=humanbocavirus; HCoV=human coronavirus; IFV=influenzavirus.
* represents the most common co-infected virus per year.Table 4. Co-infection status of HPIVs infections in China from 2019 to 2023.
The co-infection rate among SARIs caused by HPIVs was 26.9% (132/490), which was not different from ARIs (P=0.050). Dual co-infections were predominant in HPIVs-related infections.
The most common viruses co-infected with HPIVs in ARIs, SARIs, and mild ARIs were HRV, HRSV, and HADV. The association between combined viral infections and increased disease severity was not observed.
-
The recent surge of ARIs in children within China has garnered international concern (9), epidemic trends of HPIVs were examined in this study. The current analysis found an overall HPIVs detection rate of 6.15% in ARIs and 5.40% in SARIs, aligning with the results of earlier research (10–11). HPIVs ranked third among the most commonly identified respiratory pathogens, following HRSV and HRV. Among four HPIVs serotypes, HPIV3 and HPIV1 were the most frequently observed strains, suggesting these two serotypes chiefly influence HPIVs epidemiology in China. Interestingly, the study also noted HPIV2 as prevalent in mild ARIs, a finding which warrants further verification. Additionally, nonpharmacological interventions (NPIs) might influence HPIVs epidemic patterns. Notably, fewer HPIVs infections were recorded in the first half of 2020; however, cases surged in the latter half of the year following the easing of NPIs.
This study identified notable alterations in the seasonal patterns of HPIV3 and HPIV1 following the COVID-19 pandemic. Specifically, the 2020 epidemic peak for HPIV3 shifted to the autumn and winter months, a three-month postponement from its usual summer peak observed in 2019. Post-2020, HPIV3 levels stabilized. In 2021, two successive epidemic peaks of HPIV1 were recorded in July and October, which directly succeeded the peak of HPIV3. A comparable delay in HPIVs seasonal peaks has been documented in South Africa post-pandemic (12). These timing shifts may be attributed to the enactment of NPIs, changes in societal behaviors, and the presence of immunity gaps among the population. No conspicuous seasonal trends were identified for HPIV2 and HPIV4, and their epidemiological patterns remain largely undefined within China, underscoring the imperative for ongoing monitoring.
Although co-infections with HPIVs were common, their incidence varied annually, peaking at 32.05% in 2019 and dropping to 17.81% in 2020. The decrease may be attributed to the reduced presence of common co-infecting viruses due to NPIs. HRV was frequently identified as a co-infecting agent, showing a positive correlation with HPIVs (13). The high occurrence of HPIVs and HRV co-infections could be linked to their transmission modes via direct contact, which might have been facilitated by lower adherence to preventive measures during NPIs. The co-infection rate of HPIVs rose significantly following the relaxation of NPIs. Given that co-infections often lead to severe conditions (14), the significance of addressing co-infections in HPIVs cases should be underscored.
HPIVs are distinguished by their infection age, clinical manifestations, and geographic prevalence (15). This study found that HPIVs predominantly infected children under five years old. However, HPIV2 was more frequently diagnosed in both children and adolescents, whereas HPIV4 was often detected in the elderly, confirming earlier reports (12). Furthermore, although HPIVs infections are known to cause a broad spectrum of clinical symptoms, certain serotype-specific manifestations such as fever, phlegm, and headache have been particularly associated with HPIV2 infections. The distribution of HPIVs across China also exhibited regional variability; for instance, HPIV3 was more commonly found in the southern PLADs, whereas HPIV2 and HPIV4 showed higher occurrences in the northern areas. Nevertheless, these observed serotype-specific epidemiological trends necessitate corroboration through extended surveillance data.
In conclusion, analysis of five years of surveillance data has unveiled the epidemic patterns of HPIVs in China. This has enhanced comprehension of the epidemiological and clinical features of HPIVs and has implications for the prevention and management of HPIVs-related respiratory diseases in China.
-
No conflicts of interest.
HTML
Overall Detection
Season Pattern
Geographical Distribution
Demographic Profile
Clinical Features
Co-Infection Status
| Citation: |

|