

 Download:


-
Preterm birth (PTB), defined as the delivery of an infant prior to 37 complete weeks of gestation, accounted for approximately 10.9% of all live births worldwide in 2019 and has emerged as the leading cause of neonatal and under-five mortality (1–3). Recently, maternal liver health has become a focus of interest, given its potential influence on PTB (4–6). Serum alanine aminotransferase (ALT), a critical biomarker for evaluating hepatocellular injury and liver dysfunction (7), suggests that regular monitoring and maintaining ALT levels within an appropriate range before and during pregnancy may enhance maternal health and decrease the likelihood of PTB. Current clinical references for ALT, however, are derived from a generalized population pool consisting of both sexes, raising the question of their validity for preconception women, a concern that lacks empirical support. In this study, we examined the link between preconception maternal serum ALT concentrations and PTB risk within a cohort of reproductive-aged Chinese women. The findings revealed that abnormal increases, as well as somewhat diminished levels, of preconception serum ALT are associated with PTB and its subcategories, presenting a non-linear, J-shaped correlation.
This retrospective cohort study was carried out by the National Free Preconception Checkups Project (NFPCP), a nationwide initiative offering complimentary preconception health services, including examinations, counseling, and post-conception outcome monitoring to couples of reproductive age aiming to start a family. Further specifics regarding the structure, management, and execution of the NFPCP have been documented in previous publications (8–10).
Between January 1, 2013, and December 31, 2016, a total of 5,817,003 Chinese women aged 20 to 49 who took part in the NFPCP successfully conceived within a year after their preconception examination. By December 31, 2017, all participants were followed up on their pregnancy outcomes. Exclusions were made for those with a history of multiparous pregnancies (n=433,212), non-viable births (such as fetal death, ectopic pregnancy, spontaneous abortion, included therapeutic or medical abortions) (n=21,720), or self-reported medication use (n=174,835). Individuals with missing preconception serum ALT values (n=17,414) or insufficient information on gestational weeks (n=10) were also removed from the study.
Experienced doctors conducted physical examinations and routine clinical laboratory measurements following standard guidelines. Venous blood samples, collected after an 8-hour fasting period, were stored at −30 °C and analyzed within 24 hours for ALT, blood glucose, and hepatitis B surface antigen (HBsAg). Serum ALT levels were analyzed using an automatic biochemical analyzer by measuring the absorbance change at 340 nm following a substrate reaction with the serum.
The gestational age was determined by the interval in weeks between the date of the last menstrual period (LMP) adjusted by ultrasound examination and the delivery date. PTB was defined as live birth before completion of 37 weeks of gestation, with further classification into moderate to late preterm birth (MPTB, 32 to less than 37 weeks), very preterm birth (VPTB, 28 to less than 32 weeks), and extremely preterm birth (EPTB, less than 28 weeks) based on gestational age (1).
Baseline characteristics were presented as counts and percentages, means with standard deviations (SDs), or medians with interquartile ranges (IQRs). Group differences in ALT levels were analyzed using the χ2 test, Fisher’s exact test, or Kruskal-Wallis H test. The relationship between maternal preconception serum ALT levels and PTB was examined through restricted cubic spline (RCS) curves, with nonlinearities assessed using Wald statistics. ALT levels were categorized based on general thresholds (normal: ≤40 U/L; elevated: >40 U/L) and population-specific threshold ranges derived from RCS curves: <20 U/L, 20–40 U/L (reference range), and >40 U/L.
Logistic regression models were utilized to calculate odds ratios (ORs) and 95% confidence intervals (CIs), with and without adjusting for pre-selected covariates, to assess the relationship between maternal preconception serum ALT levels and the risk of PTB and its subtypes. The covariates used for adjustment are described in
Supplementary Table S1 . Subgroup analyses were conducted to confirm the consistency of the association across different populations after controlling for multiple covariates. Statistical analyses were carried out using R software (version 4.2.2; R Foundation for Statistical Computing, Vienna, Austria). All tests were two-sided, and a P-value <0.05 was considered statistically significant.A total of 5,169,812 women were included in this cohort study, with an average age of 26.52 years (SD: 4.21) and a PTB incidence rate of 6.65% (343,992 events) (Figure 1). PTB rates across different serum ALT level groups — <20 U/L, 20–40 U/L, and >40 U/L — were 6.78% (218,403 events), 6.31% (106,062 events), and 7.38% (19,527 events), respectively, with the lowest rate observed in the 20–40 U/L group. Women with preconception ALT levels <20 U/L had a higher likelihood of being underweight [body mass index (BMI) <18.5 kg/m2, n (%): 481,090 (14.92%) vs. 189,707 (11.28%)], whereas those with ALT levels >40 U/L were more inclined to be overweight or obese [BMI of 24.0–27.9 kg/m2: 46,612 (17.61%) vs. 232,028 (13.80%); BMI ≥28 kg/m2: 16,438 (6.21%) vs. 57,561 (3.42%)] (P<0.001) (Table 1).
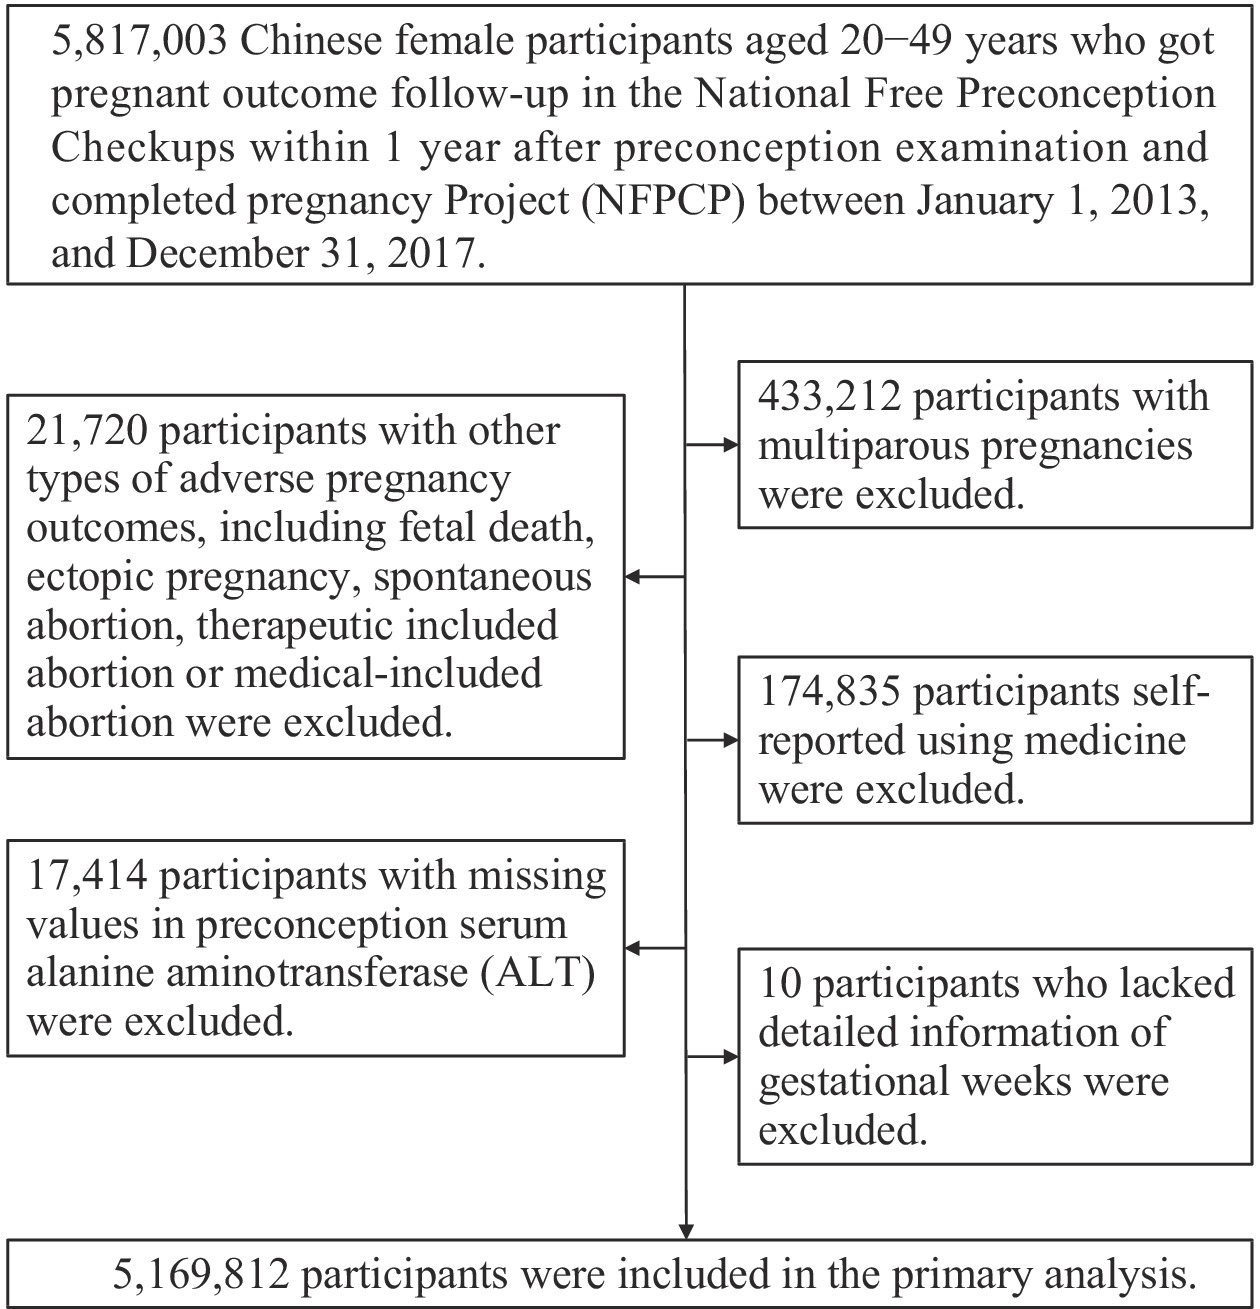 Figure 1.
Flowchart illustrating the study population of reproductive-aged women in China from 2013 to 2017.
Maternal characteristic Total (n=5,169,812) ALT level (U/L) P value* <20 (n=3,223,504) 20–40 (n=1,681,607) >40 (n=264,701) Age at LMP (years), mean (SD) 26.52 (4.21) 26.52 (4.16) 26.52 (4.30) 26.46 (4.27) <0.001† Age at LMP (years), n (%) <0.001† 20–24 1,811,519 (35.04) 1,112,313 (34.51) 601,897 (35.79) 97,309 (36.76) 25–29 2,327,309 (45.02) 1,477,004 (45.82) 736,831 (43.82) 113,474 (42.87) 30–34 741,964 (14.35) 459,234 (14.25) 243,827 (14.50) 38,903 (14.70) 35–39 241,702 (4.68) 147,047 (4.56) 81,958 (4.87) 12,697 (4.80) ≥40 47,318 (0.92) 27,906 (0.87) 17,094 (1.02) 2,318 (0.88) Preconception BMI (kg/m2), n (%) <0.001† <18.5 698,452 (13.51) 481,090 (14.92) 189,707 (11.28) 27,655 (10.45) 18.5–23.9 3,665,734 (70.91) 2,295,998 (71.23) 1,196,830 (71.17) 172,906 (65.32) 24.0–27.9 635,294 (12.29) 356,654 (11.06) 232,028 (13.80) 46,612 (17.61) ≥28 145,745 (2.82) 71,746 (2.23) 57,561 (3.42) 16,438 (6.21) Missing 24,587 (0.48) 18,016 (0.56) 5,481 (0.33) 1,090 (0.41) Education, n (%) <0.001 Junior high school and below 3,135,739 (60.65) 1,892,092 (58.70) 1,079,663 (64.20) 163,984 (61.95) Senior high school or above 1,879,334 (36.35) 1,226,039 (38.03) 561,238 (33.38) 92,057 (34.78) Missing 154,739 (2.99) 105,373 (3.27) 40,706 (2.42) 8,660 (3.27) Nationality, n (%) <0.001 Han 4,754,322 (91.96) 2,973,137 (92.23) 1,541,688 (91.68) 239,497 (90.48) Other 354,381 (6.85) 208,609 (6.47) 124,208 (7.39) 21,564 (8.15) Missing 61,109 (1.18) 41,758 (1.30) 15,711 (0.93) 3,640 (1.38) Occupation, n (%) <0.001 Farmer 3,670,941 (71.01) 2,215,353 (68.72) 1,268,826 (75.45) 186,762 (70.56) Non-farmer 1,329,778 (25.72) 893,104 (27.71) 368,175 (21.89) 68,499 (25.88) Missing 169,093 (3.27) 115,047 (3.57) 44,606 (2.65) 9,440 (3.57) Residence, n (%) <0.001 Rural 4,719,410 (91.29) 2,915,213 (90.44) 1,561,686 (92.87) 242,511 (91.62) Urban 449,991 (8.70) 307,948 (9.55) 119,867 (7.13) 22,176 (8.38) Missing 411 (0.01) 343 (0.01) 54 (0.00) 14 (0.01) Region, n (%) <0.001 Eastern 1,800,946 (34.84) 1,539,760 (47.77) 889,719 (52.91) 89,548 (33.83) Central 2,552,013 (49.36) 1,236,843 (38.37) 474,555 (28.22) 122,534 (46.29) Western 816,853 (15.80) 446,901 (13.86) 317,333 (18.87) 52,619 (19.88) Parity, n (%) <0.001 Primipara 3,158,062 (61.09) 1,960,188 (60.81) 1,030,173 (61.26) 167,701 (63.35) Multipara 2,011,750 (38.91) 1,263,316 (39.19) 651,434 (38.74) 97,000 (36.65) Hypertension, n (%) <0.001 No 5,055,184 (97.78) 3,154,849 (97.87) 1,644,195 (97.78) 256,140 (96.77) Yes 81,071 (1.57) 47,032 (1.46) 27,382 (1.63) 6,657 (2.51) Missing 33,557 (0.65) 21,623 (0.67) 10,030 (0.60) 1,904 (0.72) Hyperglycemia, n (%) <0.001 No 4,937,590 (95.51) 3,079,691 (95.54) 1,612,949 (95.92) 244,950 (92.54) Yes 201,358 (3.89) 123,428 (3.83) 59,698 (3.55) 18,232 (6.89) Missing 30,864 (0.60) 20,385 (0.63) 8,960 (0.53) 1,519 (0.57) Smoking, n (%) <0.001 No 5,132,139 (99.27) 3,198,243 (99.22) 1,671,189 (99.38) 262,707 (99.25) Yes 10,608 (0.21) 6,761 (0.21) 3,156 (0.19) 691 (0.26) Missing 27,065 (0.52) 18,500 (0.57) 7,262 (0.43) 1,303 (0.49) Drinking, n (%) <0.001 No 4,997,403 (96.67) 3,104,545 (96.31) 1,636,845 (97.34) 256,013 (96.72) Yes 140,600 (2.72) 97,448 (3.02) 36,014 (2.14) 7,138 (2.70) Missing 31,809 (0.62) 21,511 (0.67) 8,748 (0.52) 1,550 (0.59) Periconception folic acid intake, n (%) <0.001 No 1,059,359 (20.49) 650,583 (20.18) 354,576 (21.09) 54,200 (20.48) Yes 4,055,168 (78.44) 2,536,091 (78.67) 1,311,328 (77.98) 207,749 (78.48) Missing 55,285 (1.07) 36,830 (1.14) 15,703 (0.93) 2,752 (1.04) Preconception harmful exposure, n (%) <0.001 No 4,555,857 (88.12) 2,815,462 (87.34) 1,508,161 (89.69) 232,234 (87.73) Yes 586,854 (11.35) 389,622 (12.09) 166,073 (9.88) 31,159 (11.77) Missing 27,101 (0.52) 18,420 (0.57) 7,373 (0.44) 1,308 (0.49) History of adverse pregnancy outcomes, n (%) <0.001 No 4,337,030 (83.89) 2,684,307 (83.27) 1,436,552 (85.43) 216,171 (81.67) Yes 832,782 (16.11) 539,197 (16.73) 245,055 (14.57) 48,530 (18.33) Serum HBsAg status, n (%) <0.001 Negative 4,920,895 (95.19) 3,109,439 (96.46) 1,579,261 (93.91) 232,195 (87.72) Positive 244,832 (4.74) 111,470 (3.46) 101,070 (6.01) 32,292 (12.20) Missing 4,085 (0.08) 2,595 (0.08) 1,276 (0.08) 214 (0.08) Abbreviation: ALT=alanine aminotransferase; IQR=interquartile range; SD=standard deviation; LMP=last menstrual period; BMI=body mass index; HBsAg=hepatitis B surface antigen.
* Multiple comparison with Bonferroni-adjusted P<0.05 compared with the ALT 20–40 U/L group (<20 U/L group vs. 20–40 U/L group; >40 U/L group vs. 20–40 U/L group).
† The Kruskal-Wallis H test was used to examine the differences of baseline characteristics among ALT groups; otherwise, the χ2 test was used.Table 1. Baseline characteristics of 5,169,812 reproductive-aged women in China, 2013–2017.
The dose-response relationship between preconception serum ALT levels in mothers and various categories of PTB is delineated in Figure 2, which suggests a J-shaped association. Statistically significant nonlinear effects were observed for all categories of PTB, including MPTB, VPTB, and EPTB, with chi-square values and P-values indicating nonlinearity as follows: for PTB (χ²=613.12, P<0.001), MPTB (χ²=476.43, P<0.001), VPTB (χ²=128.03, P<0.001), and EPTB (χ²=138.01, P<0.001). Notably, critical serum ALT threshold ranges were identified: 17 to 40 U/L for PTB and MPTB, 17 to 37 U/L for VPTB, and 15 to 31 U/L for EPTB. Compared to the reference group with preconception ALT levels between 20–40 U/L, women with ALT levels below 20 U/L had a 7% increased risk of PTB (OR: 1.07, 95% CI: 1.06, 1.07), while those with levels above 40 U/L had a 15% higher risk (OR: 1.15, 95% CI: 1.13, 1.17), as outlined in Table 2. Similar patterns were evident across different PTB subtypes (Table 3). Subgroup analyses revealed that the observed associations were consistent across most subgroups and were not markedly affected by modifying factors. Compared to women with preconception ALT levels within the reference range, both lower and higher ALT concentrations were linked to increased PTB risk in the majority of subgroups, as illustrated in Figure 3.
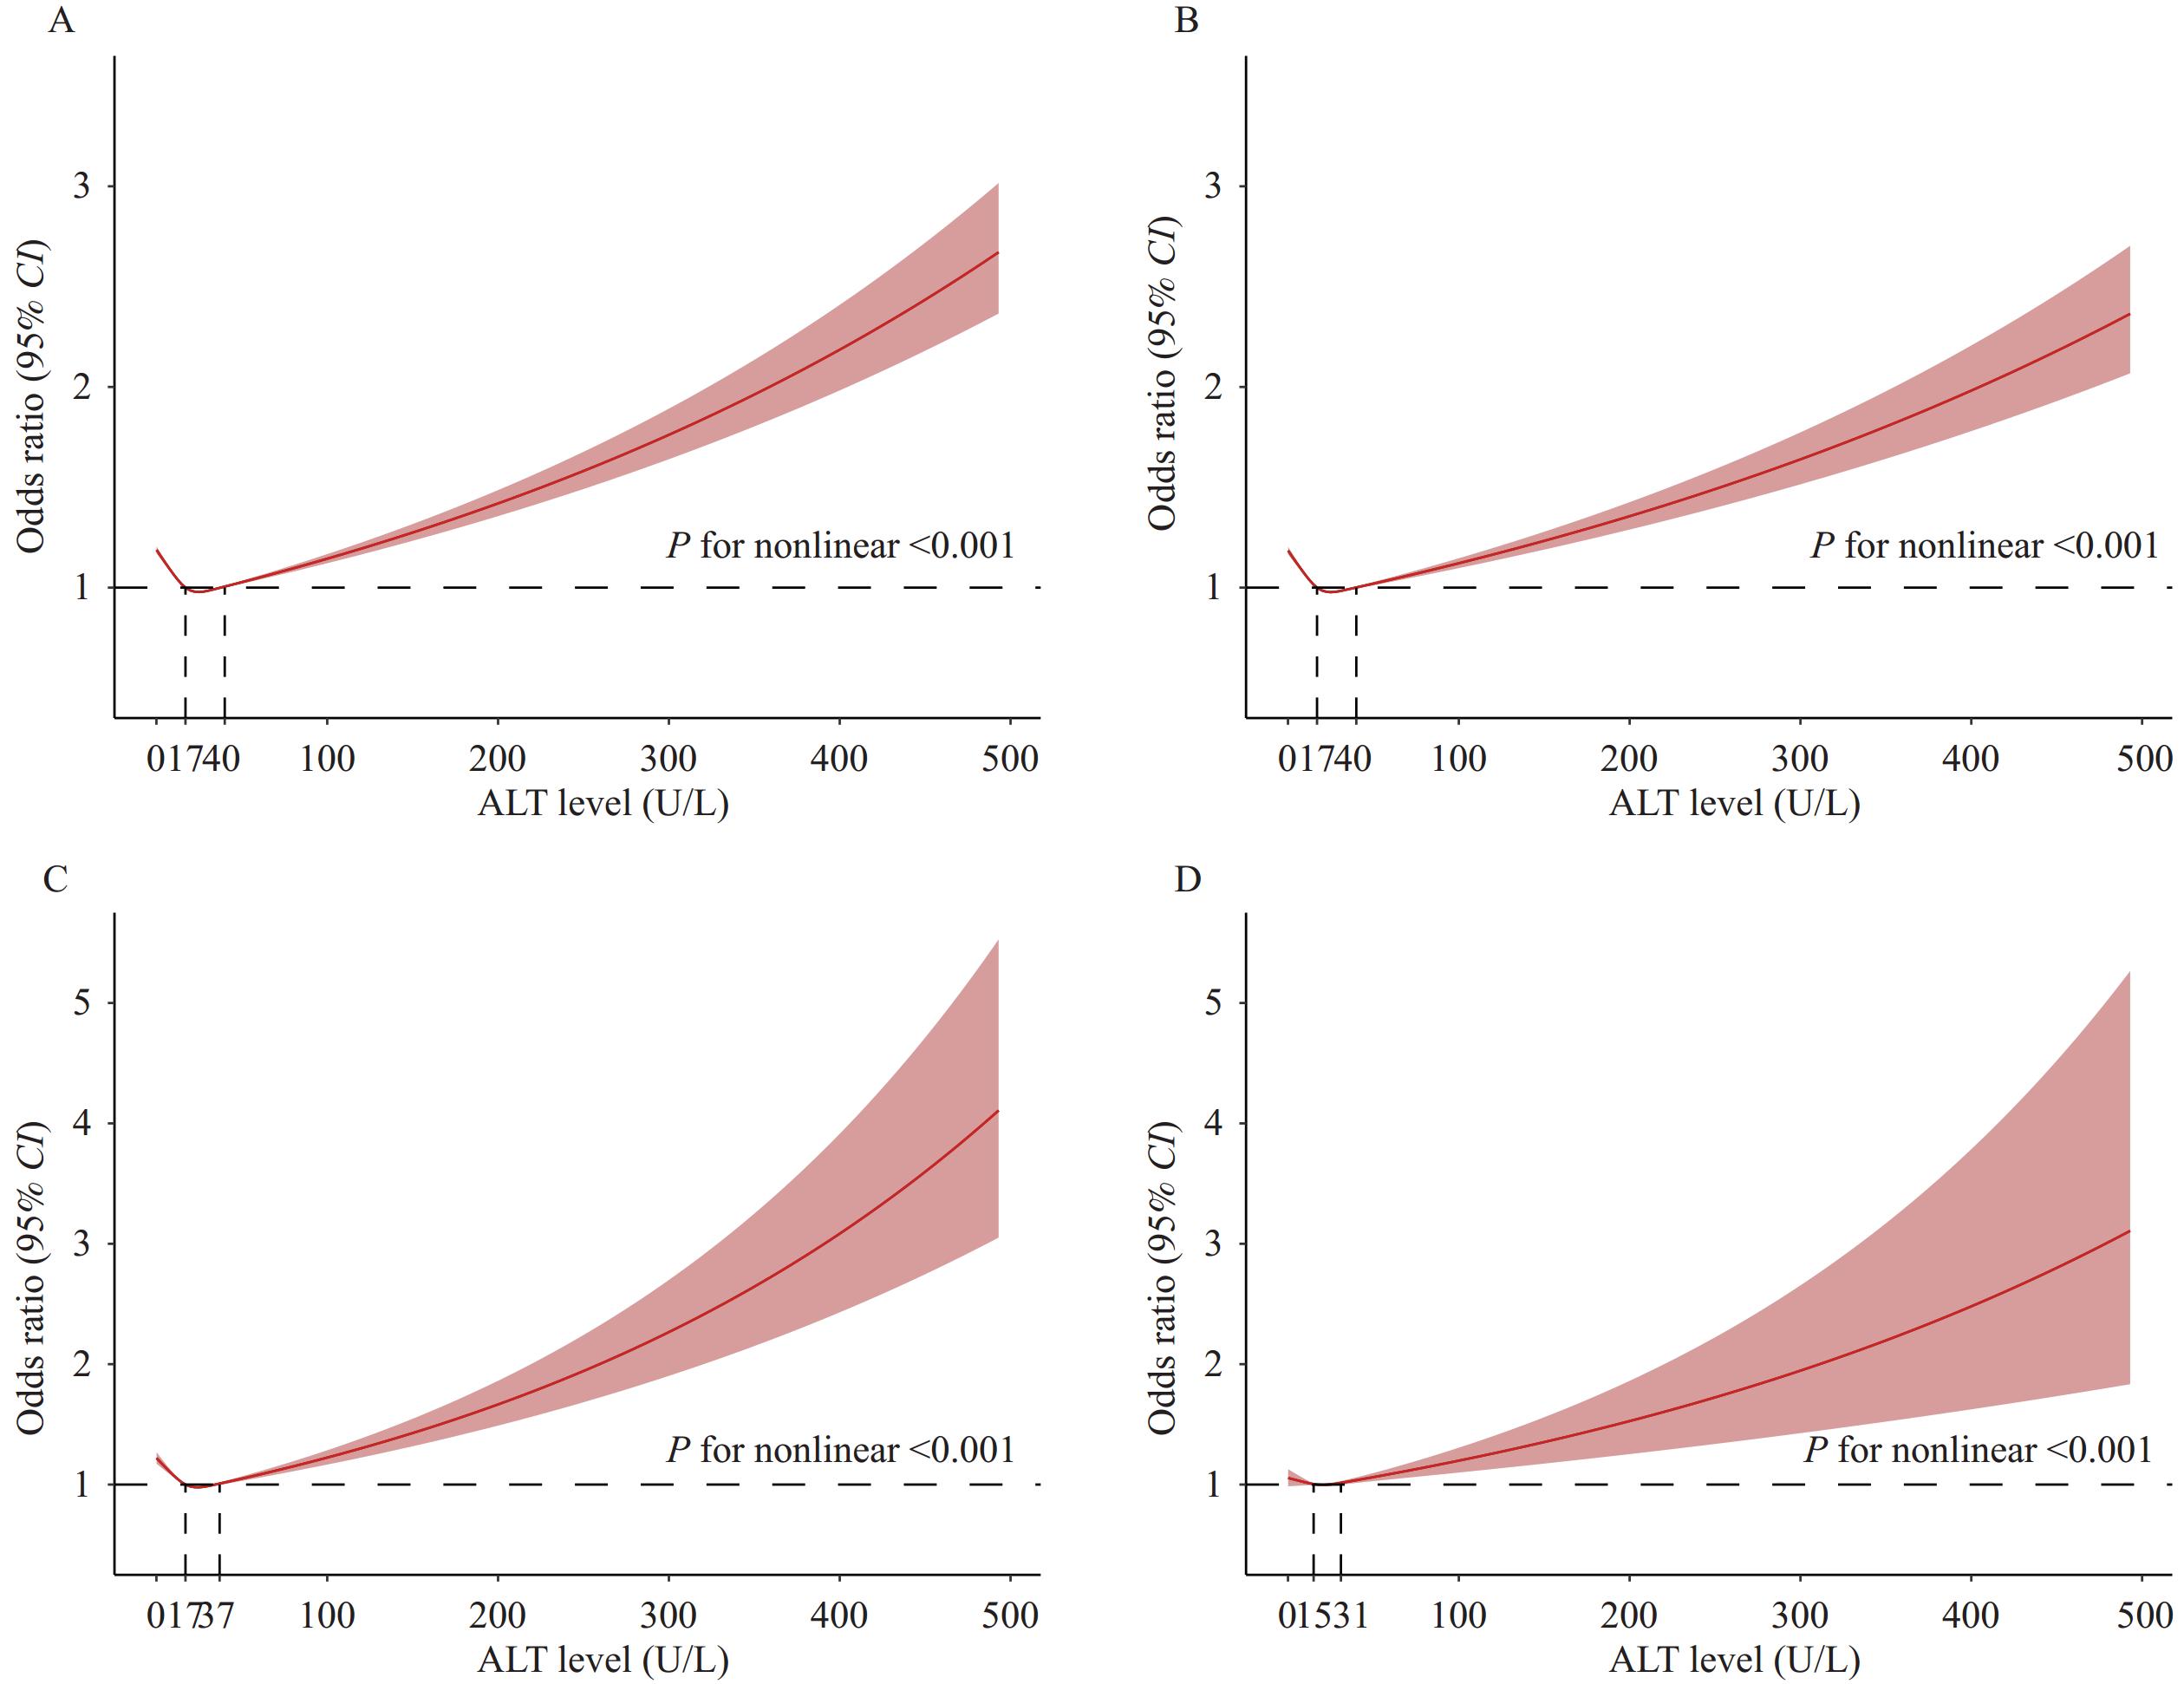 Figure 2.
Restricted cubic spline curves with logistic regression between maternal preconception serum ALT concentrations and risk of (A) PTB (<37 weeks), (B) MPTB (32 to <37 weeks), (C) VPTB (28 to <32 weeks), and (D) EPTB (<28 weeks) among 5,169,812 reproductive-aged women in China, 2013–2017.
Note: Red dashed horizontal lines depict an odds ratio of 1.0. Red lines represent the estimated OR, while shaded ribbons depict a 95% CI. The dashed line denotes the reference level. The models were adjusted for maternal age at the last menstrual period, preconception BMI, education, nationality, occupation, residence, region, parity, hypertension, hyperglycemia, smoking, drinking, periconception folic acid intake, exposure to harmful substances, history of adverse pregnancy outcomes, and serum HBsAg status.
Abbreviation: PTB=preterm birth; MPTB=moderate-to-late preterm birth; VPTB=very preterm birth; EPTB=extremely preterm birth; ALT=alanine aminotransferase; OR=odds ratio; CI=confidence interval; BMI=body mass index.
ALT level (U/L) No. cases (%) OR (95% CI) Model Ⅰ* Model Ⅱ† Model Ⅲ§ Classification Ⅰ ≤40 324,465 (6.61) 1.00 (Reference) 1.00 (Reference) 1.00 (Reference) >40 19,527 (7.38) 1.12 (1.11, 1.14) 1.11 (1.09, 1.13) 1.11 (1.09, 1.12) Classification Ⅱ <20 218,403 (6.78) 1.08 (1.07, 1.09) 1.06 (1.06, 1.07) 1.07 (1.06, 1.07) 20–40 106,062 (6.31) 1.00 (Reference) 1.00 (Reference) 1.00 (Reference) >40 19,527 (7.38) 1.18 (1.16, 1.20) 1.16 (1.14, 1.17) 1.15 (1.13, 1.17) Abbreviation: PTB=preterm birth; ALT=alanine aminotransferase; OR=odds ratio; CI=confidence interval.
* Model Ⅰ was an unadjusted model.
† Model Ⅱ was adjusted for maternal age at the last menstrual period, preconception body mass index (BMI), education, nationality, occupation, residence, region, parity, hypertension, hyperglycemia, smoking, drinking, periconception folic acid intake, harmful exposure, and history of adverse pregnancy outcomes.
§ Model Ⅲ was additionally adjusted for maternal serum hepatitis B surface antigen (HBsAg) status.Table 2. Associations between maternal preconception serum ALT concentrations and the risk of PTB among 5,169,812 reproductive-aged women in China, 2013–2017.
ALT level (U/L) MPTB VPTB EPTB No. cases (%) OR (95% CI) No. cases (%) OR (95% CI) No. cases (%) OR (95% CI) Classification Ⅰ ≤40 268,398 (5.47) 1.00 (Reference) 41,378 (0.84) 1.00 (Reference) 14,689 (0.30) 1.00 (Reference) >40 16,099 (6.08) 1.10 (1.08, 1.12) 2,508 (0.95) 1.11 (1.07, 1.16) 920 (0.35) 1.15 (1.08, 1.23) Classification Ⅱ <20 181,402 (5.63) 1.07 (1.06, 1.08) 27,504 (0.85) 1.05 (1.02, 1.07) 9,497 (0.29) 0.98 (0.95, 1.01) 20–40 86,996 (5.17) 1.00 (Reference) 13,874 (0.83) 1.00 (Reference) 5,192 (0.31) 1.00 (Reference) >40 16,099 (6.08) 1.15 (1.13, 1.17) 2,508 (0.95) 1.14 (1.09, 1.19) 920 (0.35) 1.14 (1.06, 1.22) Note: The models were adjusted for maternal age at the last menstrual period, preconception body mass index (BMI), education, nationality, occupation, residence, region, parity, hypertension, hyperglycemia, smoking, drinking, periconception folic acid intake, harmful exposure, history of adverse pregnancy outcomes, and serum hepatitis B surface antigen (HBsAg) status.
Abbreviation: MPTB=moderate-to-late preterm birth; VPTB=very preterm birth; EPTB=extremely preterm birth; ALT=alanine aminotransferase; OR=odds ratio; CI=confidence interval.Table 3. Associations between maternal preconception serum ALT concentrations and the risk of MPTB, VPTB, and EPTB among 5,169,812 reproductive-aged women in China from 2013 to 2017.
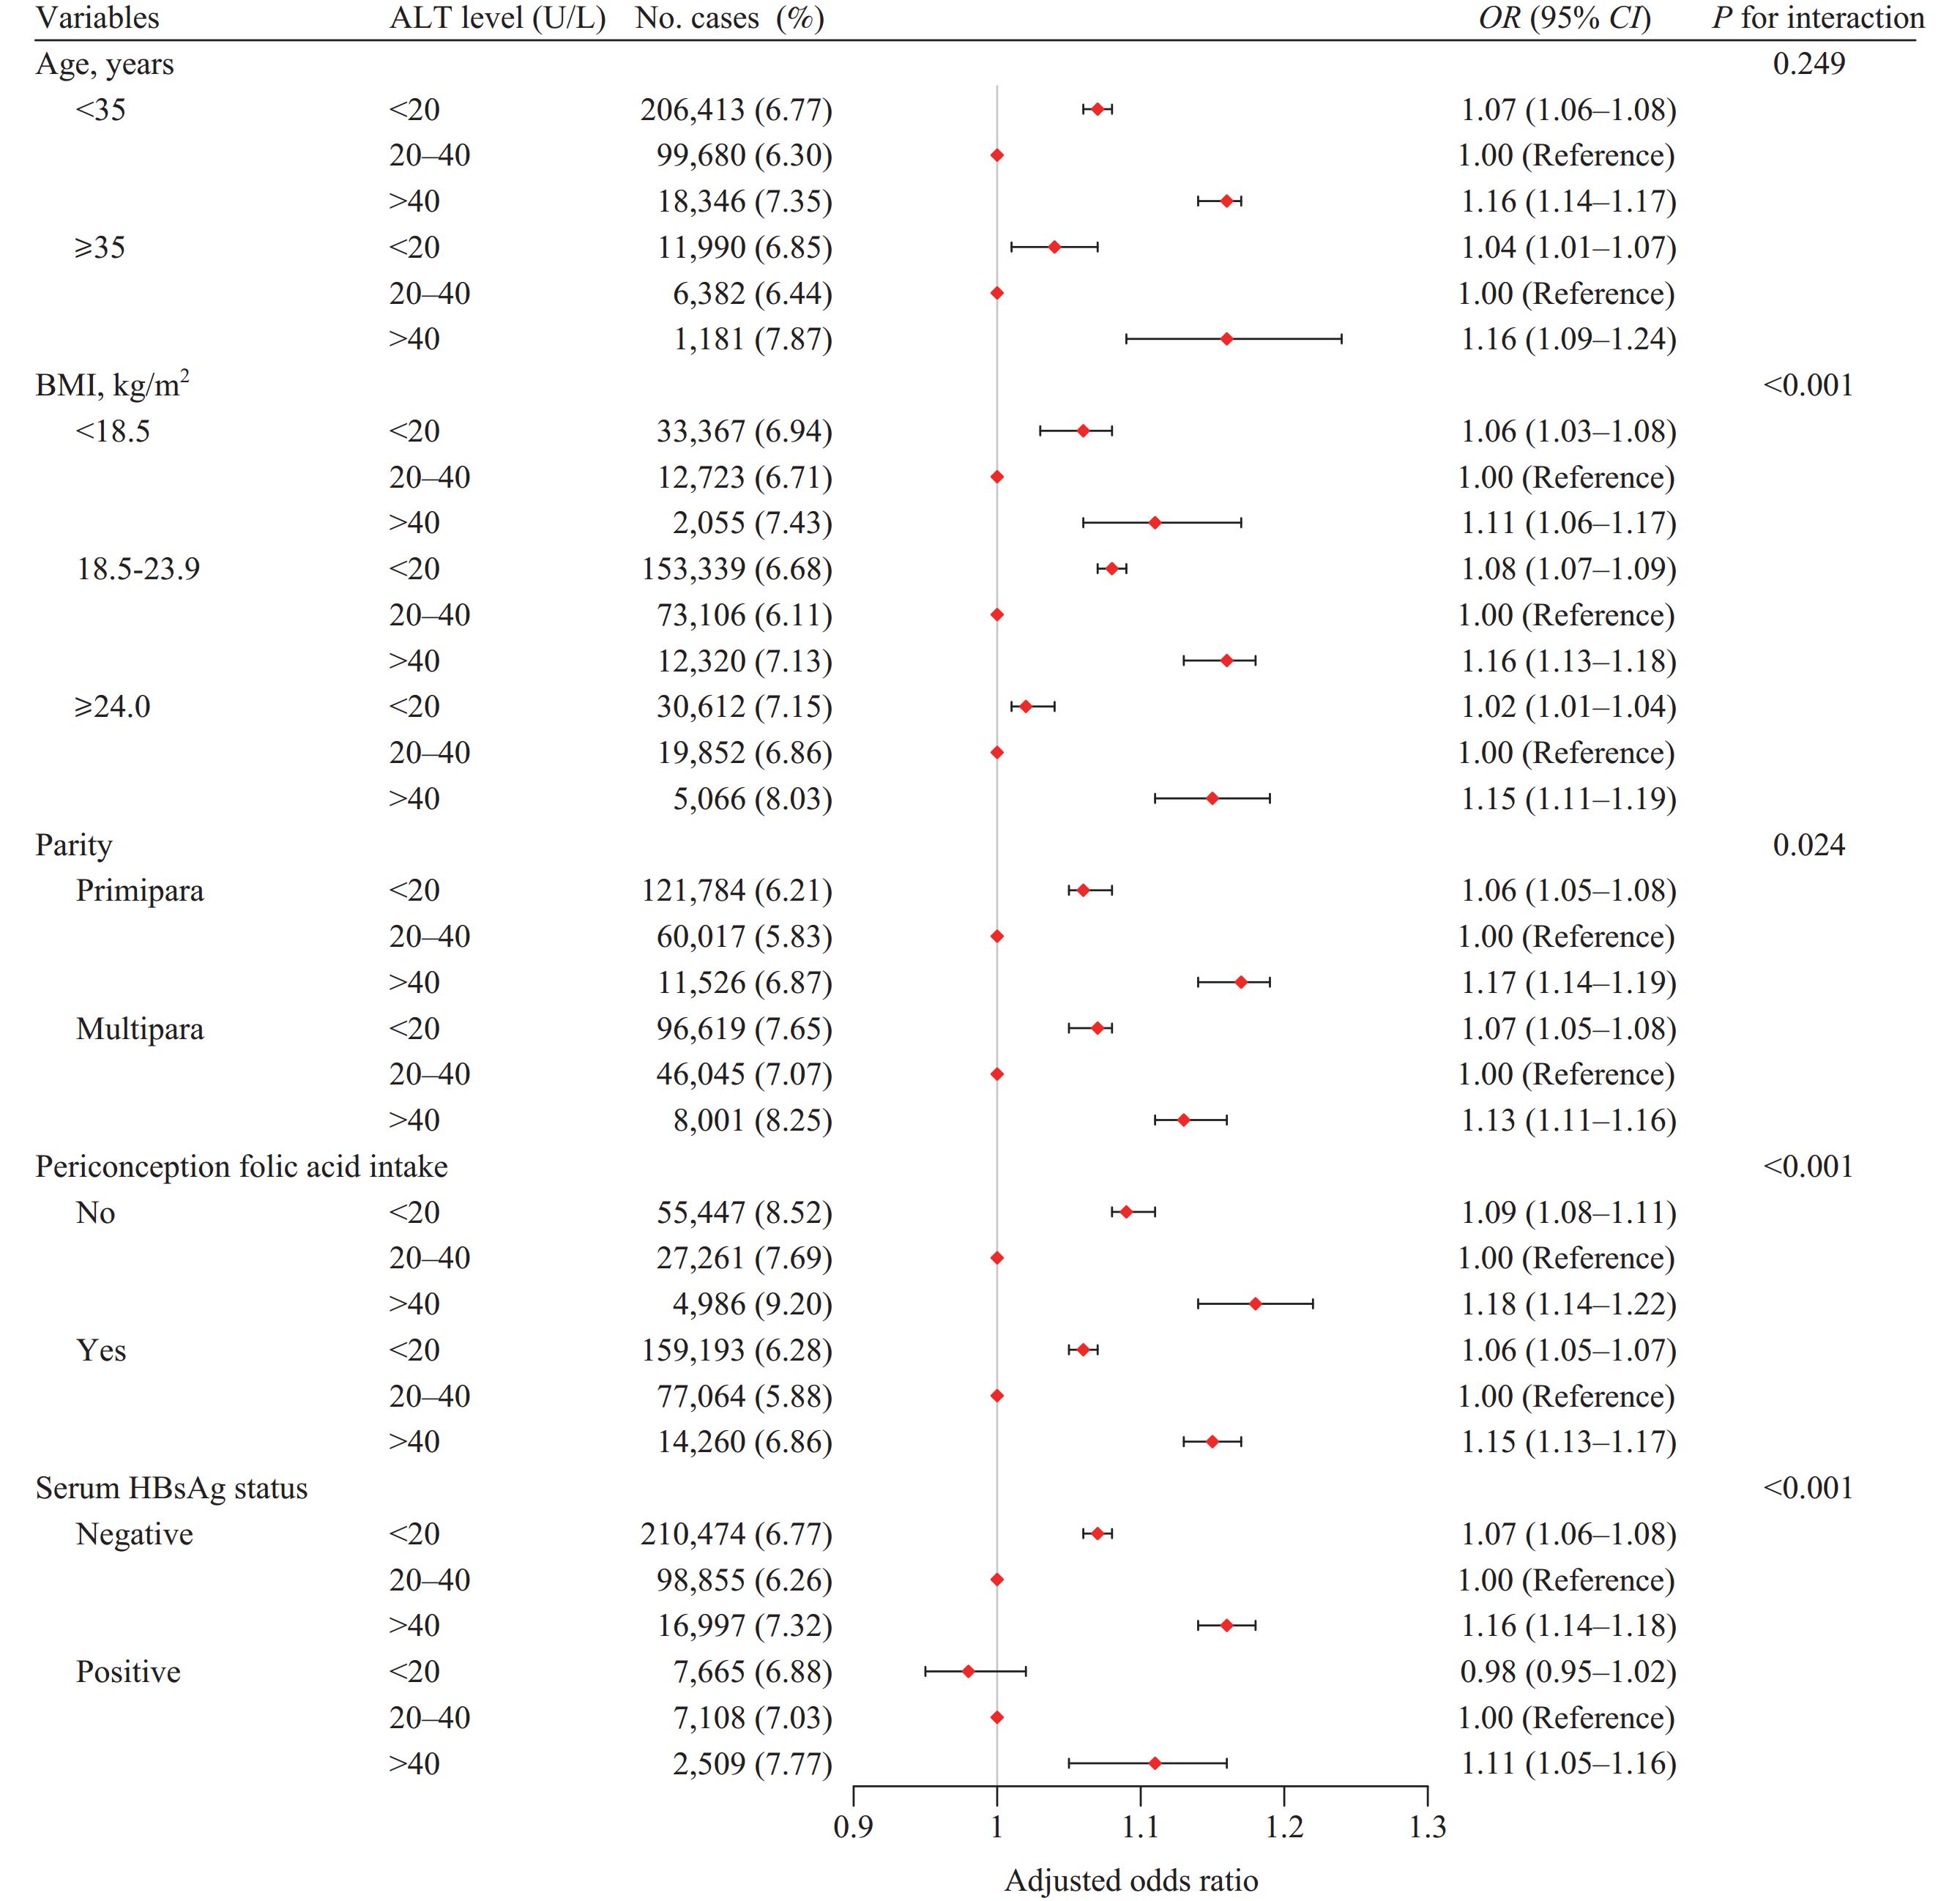 Figure 3.
Subgroup analyses of the association between maternal preconception serum ALT concentrations and the risk of PTB among 5,169,812 reproductive-aged women in China from 2013 to 2017.
Note: Covariates in subgroup analyses were consistent with the variables adjusted in the multivariable logistic regression model for all participants, with the exception of the grouping variable.
Abbreviations: PTB=preterm birth; ALT=alanine aminotransferase; BMI=body mass index; HBsAg=hepatitis B surface antigen; OR=odds ratio; CI=confidence interval.
-
In this large population-based retrospective cohort study involving more than 5.1 million Chinese women, we found that individuals with preconception serum ALT levels below 20 U/L had a 7% higher risk of PTB, while those with levels above 40 U/L had a 15% higher risk, compared to participants with ALT levels between 20–40 U/L.
Elevated ALT is often a sign of hepatocellular injury or liver dysfunction and acts as an indicator for conditions such as viral hepatitis, non-alcoholic fatty liver disease, or metabolic syndrome (11–13). These conditions are associated with systemic inflammation and metabolic disturbances, including insulin resistance, heightened pro-inflammatory cytokine production, oxidative stress, and mitochondrial dysfunction, which can lead to hepatocyte damage or demise (14). These are recognized pathophysiological mechanisms implicated in the development of PTB (15). Conversely, preconception serum ALT levels that are low but within the normal range may signal malnutrition, frailty, disability, and sarcopenia (16–18), reflecting a compromised health status. Such a condition could interrupt vital metabolic processes necessary for fetal development and pregnancy, thereby representing an alternative, yet significant, pathway that may increase the risk of PTB.
Our study has several notable strengths. First, we conducted a detailed classification to assess the link between preconception serum ALT levels and the risk of PTB. This analysis was based on the largest Chinese population-based preconception cohort, comprising over 5.1 million participants. Second, all serum ALT tests were done within a year before pregnancy, offering a more accurate reflection of preconception liver function status. The NFPCP ensured data reliability by conducting quality checks and reviewing all testing procedures, including serum ALT measurements. Additionally, the inclusion of comprehensive individual covariate information provided ample statistical power for subgroup analysis.
This study was subject to some limitations. First, due to its observational design, causal relationships cannot be determined, and findings should be interpreted cautiously. Second, the absence of longitudinal liver function assessments during pregnancy may restrict the complete comprehension of the link between serum ALT levels and PTB. Third, similar to prior research, not all potential confounding variables were accounted for, and there is a chance of unmeasured or unidentified covariates.
Our results indicate that both abnormally high and relatively low levels of preconception serum ALT are linked to the risk of PTB and its subtypes in a J-shaped relationship. This underscores the importance of maintaining optimal preconception serum ALT levels to decrease the risk of PTB, highlighting the need for specific interventions in women of reproductive age.
-
No conflicts of interest.
-
All healthcare professionals and numerous participants across 31 provincial-level administrative divisions for their contributions in the National Free Preconception Checkup Project.
HTML
| Citation: |

|