

 Download:


-
Varicella (chickenpox) is a respiratory infection caused by the varicella zoster virus (VZV). It is characterized by fever and a generalized, self-limiting vesicular rash (1). WHO has emphasized the need for adequate disease surveillance to assess the burden of varicella before incorporating the varicella vaccine into routine immunization programs (2). Since 2006, China has been monitoring varicella outbreaks through a passive surveillance system (3). Previous studies conducted in various districts of China have shown that varicella outbreaks are the most commonly reported vaccine-preventable infectious disease outbreaks, leading to disruptions in school activities and putting a burden on health departments for investigation and control measures (4–5). In this study, we aimed to describe the epidemiological characteristics of varicella outbreaks in China from 2006 to 2022 in order to provide evidence for the development of strategies and policies for varicella outbreak prevention and control.
-
The research obtained data from varicella outbreak reports between 2006 and 2022 in the Public Health Emergency Reporting Management Information System. Outbreak events were classified as Grade I (particularly significant), Grade II (significant), Grade III (large), Grade IV (general), or ungraded according to the nature of the event, the degree of harm, and the scope. Ungraded events met reporting standards but not classification standards.
In this study, China was divided into seven regions by provincial-level administrative divisions: eastern (Anhui, Jiangsu, Zhejiang, Shanghai, Shandong, Jiangxi, and Fujian), southwestern (Sichuan, Chongqing, Yunnan, Guizhou, and Xizang), southern (Guangdong, Guangxi, and Hainan), northwestern (Shaanxi, Qinghai, Gansu, Ningxia, Xinjiang, and northern Inner Mongolia), central (Henan, Hubei, and Hunan), northern (Beijing, Tianjin, Hebei, Shanxi, and central Inner Mongolia), and northeastern (Heilongjiang, Jilin, Liaoning, and eastern Inner Mongolia).
The outbreak settings were classified into seven categories: kindergartens, primary schools, middle schools, high schools, 9-or 12-year schools, universities, and others. The size of the outbreaks was divided into four categories: 2 to 10 cases, 10 to 49 cases, 50 to 99 cases, and 100 or more cases. The duration of the outbreak was defined as the number of days between the onset of symptoms in the index patient and the last patient. Response time was defined as the number of days between the onset date of the first case and the date of outbreak reporting.
The study utilized frequencies and proportions to describe categorical variables and medians and inter-quartile ranges (IQR) for numerical variables. The attack rate was calculated as the number of outbreak cases divided by the number of individuals exposed in the outbreak. We employed the Mann-Kendall trend test in R (version 4.1.3, R Foundation for Statistical Computing, Vienna, Austria) to assess trends in case counts, outbreak size, and duration. A two-sided P-value less than 0.05 was considered statistically significant. Statistical analyses were conducted using SPSS (version 27.0, IBM, Armonk, New York, USA).
-
A total of 11,990 varicella outbreaks, involving 354,082 cases, were reported in China between 2006 and 2022. The number of outbreaks and the number of cases followed a similar pattern, initially decreasing until reaching a low point in 2012, then increasing until reaching a peak in 2018–2019, and finally showing a downward trend in the past three years (Figure 1). Outbreaks were reported in every month of the study period, with two prominent peaks in incidence — one from October to December, and a smaller peak from April to June (Figure 2).
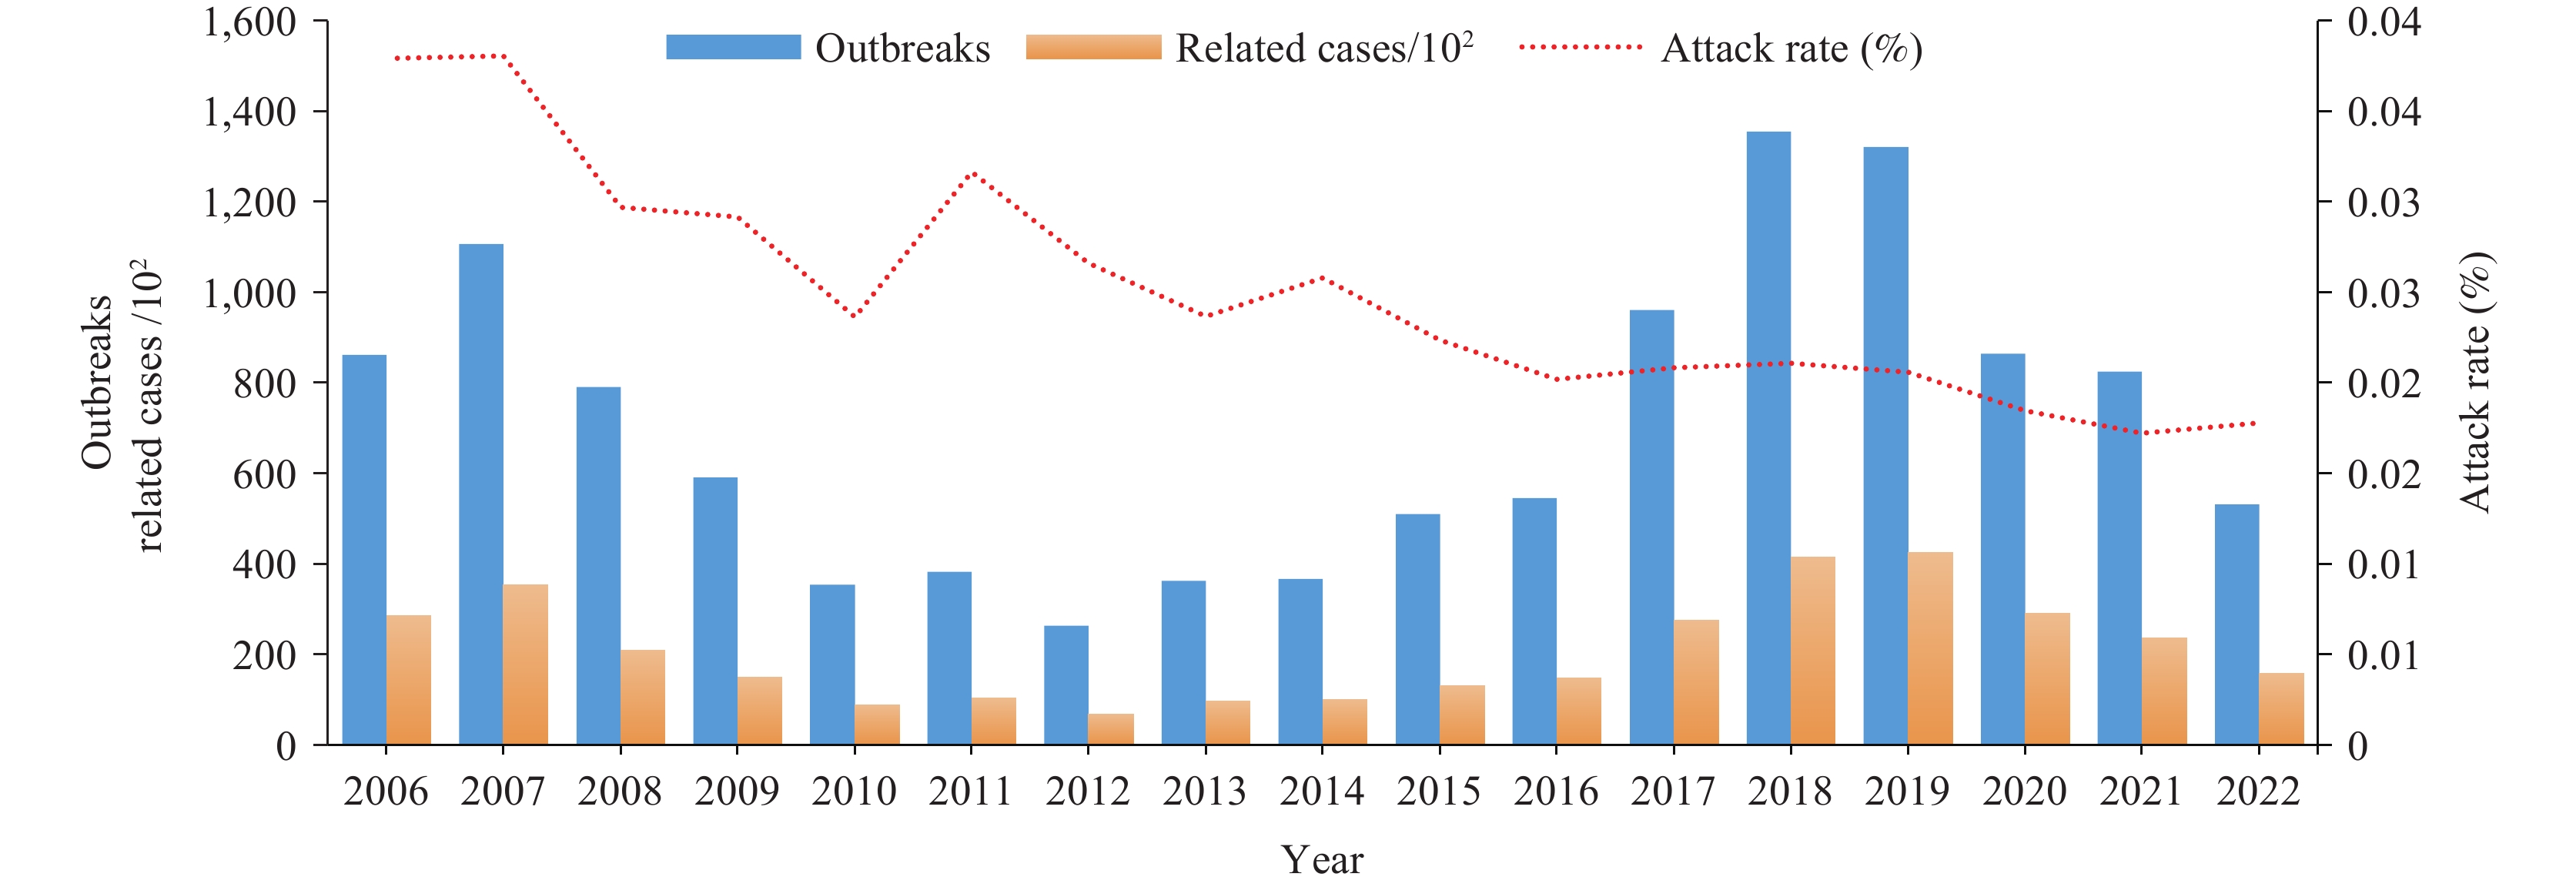 Figure 1.
Number of varicella outbreaks and related cases and attack rate, China, 2006–2022.
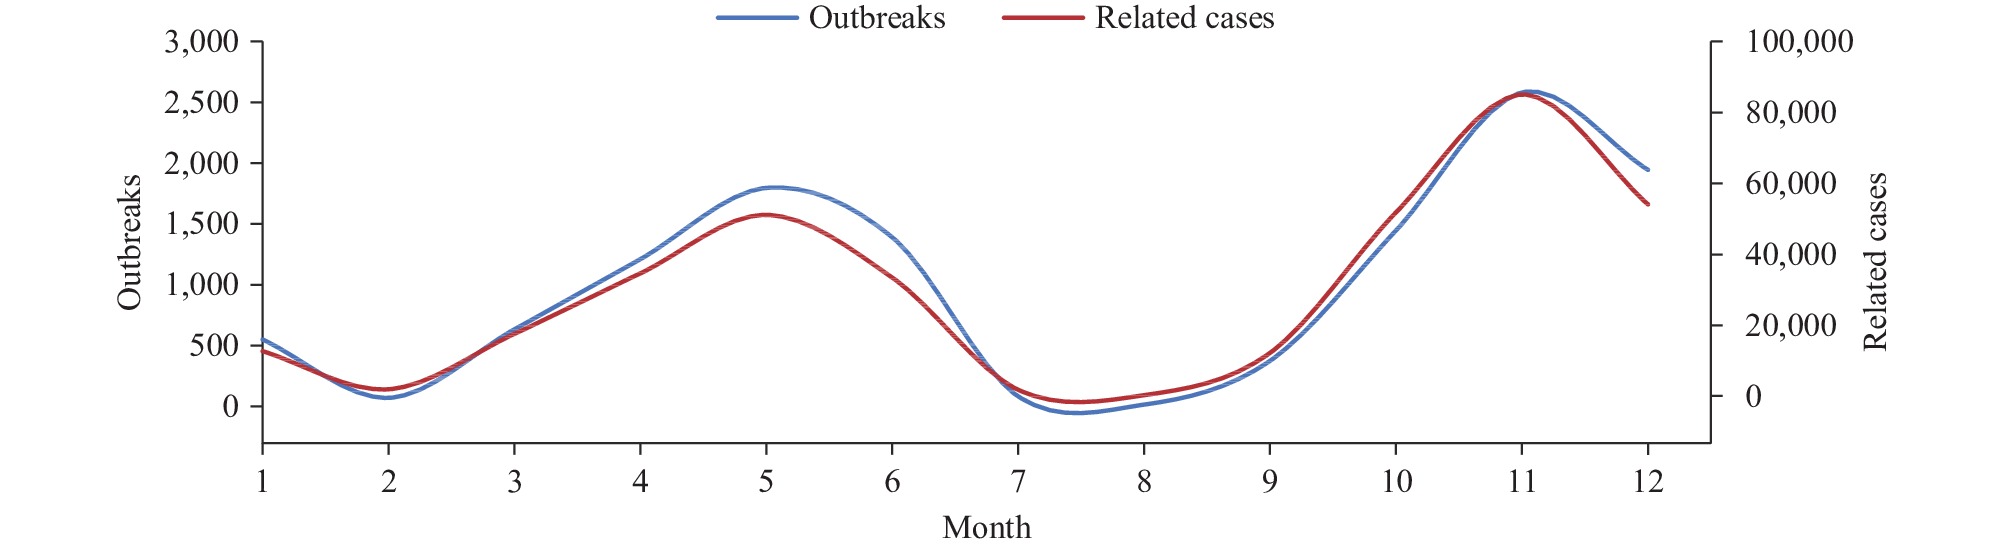 Figure 2.
Monthly reported varicella outbreaks and cases in China, 2006–2022.
The eastern region accounted for 31.53% of all outbreaks and 30.49% of all cases, making it the region with the highest number of reported outbreaks and cases. The southwestern region and southern region followed closely behind with 24.22% and 17.93% of outbreaks, and 23.88% and 19.72% of cases, respectively. The southern region had the highest attack rate at 3.09%, while the eastern region had the lowest attack rate at 1.85%. The attack rates for other regions ranged between 2.35% and 2.77%. Schools were the most common setting for outbreaks, accounting for 87.89% of outbreaks and 90.29% of cases. Within school outbreaks, primary schools had the highest occurrence rate, with 72.26% of outbreaks and 73.90% of cases. Attack rates were lower in higher grade levels, with the highest attack rate of 6.11% observed in kindergartens. The attack rate in communities was 0.96%. No Grade I or Grade II outbreaks were reported, while Grade IV outbreaks accounted for the highest number of outbreaks (60.43%) and cases (64.34%). Ungraded outbreaks made up 39.50% of all reported outbreaks. A total of 162 outbreaks with fewer than 10 cases, while the majority of outbreaks (86.41%) had 10–49 cases. Additionally, there were 197 outbreaks with more than 100 cases (Table 1).
Variable Outbreaks Related cases Number Proportion (%) Number Proportion (%) Attack rate (%) Area Eastern 3,780 31.53 107,932 30.49 1.85 Southwest 2,903 24.22 84,553 23.88 2.35 Southern 2,150 17.93 69,797 19.72 3.09 Northwest 1,060 8.84 32,975 9.31 2.57 Central 1,006 8.39 28,642 8.09 2.77 Northern 789 6.58 21,336 6.03 2.58 Northeast 300 2.50 8,770 2.48 2.46 Setting Kindergarten 1,401 11.72 33,157 9.38 6.11 Primary school 8,641 72.26 261,106 73.90 2.50 Middle school 1,159 9.69 34,012 9.63 1.81 High school 365 3.05 12,240 3.46 1.15 9-or12-year schools 266 2.22 9,316 2.64 2.05 University 80 0.67 2,339 0.66 0.36 Community/unit 47 0.39 1,167 0.33 0.96 Outbreak classification Grade III 9 0.08 1,157 0.33 −* Grade IV 7,245 60.43 227,806 64.34 −* Ungraded 4,736 39.50 125,119 35.34 −* Size of outbreaks <10 cases 162 1.35 1,150 0.32 −* 10–49 cases 10,360 86.41 241,597 68.23 −* 50–99 cases 1,271 10.60 83,364 23.54 −* ≥100 cases 197 1.63 27,971 7.84 −* * it is inessential to calculate the attack rate owing to a fact that both the outbreak classification and size of outbreaks belong to qualitative data. Table 1. Characteristics of reported varicella outbreaks in China, 2006–2022.
The medians and IQR for outbreak duration, response time, and case count were 21 (10, 39), 4 (0, 12), and 23 (16,35), respectively. The Spearman rank correlation coefficient revealed a positive correlation between outbreak duration and response time (r=0.10, P<0.001), a strong positive correlation between outbreak duration and case count (r=0.55, P<0.001), and a weak positive correlation between outbreak duration and case count (r=0.04, P<0.001).
Compared to the period of 2006–2012, there was an increase in the number of varicella outbreaks and outbreak-related cases from 2013 to 2019. Within the period of 2013 to 2019, although the number of outbreaks decreased, there was an increase in the number of grade III and IV outbreak-related cases. Additionally, ungraded outbreaks increased while outbreak-related cases decreased, leading to a decrease in the attack rate. Both reported outbreaks and related cases during the period of 2020–2022 were lower compared to both 2006–2012 and 2013–2019. Furthermore, the attack rate continued to decrease (Table 2).
Variable 2006–2012 2013–2019 2020–2022 Outbreaks Related cases Outbreaks Related cases Outbreaks Related cases Total 4,347 125,703 5,419 159,447 2,217 68,501 Range III 5 458 3 549 1 150 Range IV 3,297 27,057 2,985 95,549 958 33,663 Unraged 1,045 98,188 2,431 63,349 1,258 34,688 Attack rates 3.26 (125,703/3,861,549) 2.12 (159,447/7,486,698) 1.78 (68,501/3,839,824) Table 2. Comparing varicella outbreaks and attack rates in different periods, 2006–2022.
-
Between 2006 and 2022, the annual number of varicella outbreaks exhibited a fluctuating pattern. The number initially decreased from 2007 to 2012, followed by an increase from 2013 to 2019, and then another decrease after 2020. However, the attack rates showed a slight, continuous decline over the years, which may be attributed to the increasing varicella vaccination rates in China and the subsequent increase in immunity among children (6). Interestingly, despite this decline in attack rates, the number of varicella outbreaks and related cases did not decrease but instead increased, particularly from 2017 to 2019. This phenomenon is mainly due to improved reporting sensitivity. The subsequent decline after 2020 is believed to be primarily influenced by the implementation of strict control measures to combat the coronavirus disease 2019 (COVID-19) pandemic, with many schools suspending classes or shifting to online learning. Notably, even during the COVID-19 pandemic, the number of outbreaks and related cases remained relatively high in primary and secondary schools as well as kindergartens across the country (7).
This research observed a higher number of varicella outbreaks and outbreak-related cases during the months of April to June and October to December. In most schools in China, there are two vacation periods each year between semesters: summer vacation, typically from mid-July to August, lasting approximately seven weeks, and winter vacation, usually occurring in January and lasting for about three weeks. Varicella outbreaks tended to increase about a month after the start of the semester, reaching their peak during the semester, and gradually declining during vacations. Similar findings were reported in a study conducted in Korea (8). This pattern suggests a reduced risk of varicella exposure during vacation periods, although climate may also have influenced the outbreak risk (9).
This study identified that varicella outbreaks in China were primarily concentrated in the eastern, southwestern, and southern regions, accounting for a combined 73.68% of all reported outbreaks. The northern and northeastern regions experienced fewer outbreaks. However, the regional variations in attack rates were minimal, ranging from 1.85% to 3.09%. This suggests that the factors contributing to these differences were likely influenced by climate and population density, both of which impact the transmission risk of VZV. Additionally, differences in outbreak identification and reporting awareness among reporting personnel may have played a role. Therefore, it is imperative to enhance the training of reporting personnel to improve their awareness and accuracy in reporting.
More than 85% of varicella outbreaks occur in schools, with elementary schools being the most common setting. Classrooms, being enclosed and overcrowded, provide favorable conditions for the transmission of VZV. It is crucial to promote adherence to implementing timely and strict isolation measures for varicella cases, particularly in elementary schools. Our study found that the attack rate decreases with increasing grade level, as most children develop immunity to varicella through either active or passive immunization as they grow older. However, in China, where the varicella vaccination coverage is low (67.1% with one dose), many children remain susceptible to varicella due to lack of vaccination-induced immunity (10). Children with varicella play a significant role in the transmission of VZV. In the United States, varicella outbreaks are monitored through a combination of active and passive surveillance, which has shown a noteworthy decline in outbreaks since the implementation of a routine two-dose varicella vaccination schedule in 2007 (11). Therefore, extensive vaccination of eligible-age children is essential to effectively prevent the spread of varicella and reduce the attack rate.
This research observed a positive correlation between the response time and both the case number and outbreak duration. This suggests that faster response times are associated with smaller and shorter outbreaks of varicella. This finding underscores the importance of accurately identifying varicella outbreaks and improving the timeliness of reporting in order to reduce the intensity of epidemics. A previous study also demonstrated that varicella vaccination can reduce the number, size, and duration of varicella outbreaks (12). However, the varicella vaccine has not been widely included in routine immunization programs in most regions of China. Therefore, it is essential for health departments to actively assess the burden of the disease and gather more evidence to support the early integration of the varicella vaccine into immunization programs as soon as possible.
The Public Health Emergency Reporting Management Information System, established in 2006, is a unique system in China for reporting all types of public health emergencies (13). Initially, varicella was classified under other infectious diseases for reporting. In 2012, a nationwide risk assessment mechanism was established for public health emergencies, further improving awareness, early reporting, and timely response to emergencies (14). In this study, we found a significant increase in the number of varicella outbreaks and cases during 2013–2019 compared to 2006–2012. This indicates that the effective implementation of the strategy helped increase the awareness of health agency staff and improve the sensitivity of varicella outbreak monitoring. Conversely, the number of grade III and grade IV outbreaks, as well as the overall attack rate, declined during 2013–2019, suggesting that the capabilities of early identification and response of health agency staff improved with the implementation of the strategy, effectively controlling varicella outbreaks at the early stages. We also observed lower numbers of reported outbreaks, related cases, and attack rates during 2020–2022. This indicates that the non-pharmaceutical interventions implemented to mitigate the pandemic during this period have potential value for the prevention and control of varicella outbreaks.
Limitations of the study include reliance on data from a passive surveillance system, which may lead to an underestimation of the number and magnitude of reported outbreaks and cases due to limitations in monitoring sensitivity and reporting awareness.
In conclusion, this study conducted a comprehensive analysis of the epidemic characteristics and responses to varicella outbreaks in China from 2006 to 2022. We evaluated trends, regional distribution, settings, sizes, durations, and response times of reported varicella outbreaks. The findings of the research offer valuable insights to enhance varicella outbreak responses and optimize varicella control strategies.
-
No conflicts of interest.
-
We would like to express our gratitude to Lance Rodewald, Senior Advisor at China CDC, for his valuable input in refining the manuscript’s English language and providing insightful suggestions.
HTML
| Citation: |

|