

 Download:


-
Declining birth rates combined with increased life expectancy have led to an irreversible trend of population aging within contemporary society. This demographic shift poses profound challenges to social governance, for instance, increasing dependency ratios, and higher social security and medical care costs for the elderly. Simultaneously, however, it presents opportunities through a new demographic dividend (1). Given the burgeoning number of older adults worldwide, understanding not only their life expectancy but also the quality of those years lived, is of growing importance (2). Although life expectancy has been a crucial health population metric (3), distinguishing between “healthy” and “unhealthy” years lived gains heightened significance, particularly in the face of medical advancements that prolong life. Despite extensive research on life expectancy and healthy life expectancy (HALE) (3), a noticeable gap prevails in concurrent investigations of healthy and unhealthy life expectancies in the older demographic. This research void potentially hampers the development of optimal aging policies and healthcare strategies.
Using data derived from the Global Burden of Disease Study 2019 (GBD 2019), our research provides an in-depth analysis of global trends in these three metrics from 1990 to 2019 for older adults. For the study, Life Expectancy at age 60 (LE-60), constructed based on age-specific mortality rates from all locations and estimations years across all populations by sex (4), and the HALE at age 60 (HALE-60) were employed , using Sullivan’s approach to assess “healthy” years. Proportion of Years in Ill Health at age 60 (PYIH-60) [(LE-60−HALE-60)/LE-60] has been used to calculate the “unhealthy” years proportion in life expectancy (4). Furthermore, essential national integrated indices such as the sociodemographic index (SDI), universal health coverage (UHC) effective coverage index, healthcare access and quality index (HAQ), and others were borrowed from GBD 2019.
Our objective is to illuminate the complex health trajectories of the world’s aging population. We utilized the Joinpoint Regression Program (version 4.9.1.0, Statistical Research and Application Branch, National Cancer Institute, Rockville, Maryland, US) to compute annual percentage changes (APCs) and average annual percentage changes (AAPCs) with the help of Joinpoint regression models featuring natural log-transformed rates. In addition, correlations between HALE-60 and PYIH-60 with national integrated critical indices including SDI, UHC effective coverage index, HAQ, human resources for health (HRH) and per capita healthcare expenditures were explored with Spearman correlation and locally weighted regression (LOESS) using R (version 4.2.2; R Core Team, 2022, Vienna, Austria).
This research is critical in guiding the development of public health strategies and policies that are evidence-based and are specifically designed to address the distinct challenges associated with an increasingly aging global population.
From 1990 to 2019, global life expectancy and healthy life expectancy among older adults exhibited a steady incline. The most rapid pace of advancement in life expectancy was recorded in South Asia and the East Asia & Pacific regions, with AAPCs of 0.81% and 0.67% respectively. A substantial upswing was seen between 1990–1998 (0.80%) and 2003–2019 (0.72%). A closely comparable trend was observed in Europe and Central Asia with an AAPC of 0.50%, marked by a significant surge across 1995–2014 (0.76%) (Table 1). Other locations globally showcased a uniform life expectancy growth rate of 0.40% per year. Intriguingly, while the healthy life expectancy growth trends reflect those of the respective regions (Figure 1A), the life expectancy growth rate exhibited a marginal lead (average AAPC of 0.51%) over the healthy life expectancy growth rate (0.47%). China demonstrated remarkable progress in both parameters, with its growth rates being among the highest on the global stage (Table 1).
Categories Location Years Total study period Period 1 Period 2 Period 3 1990 2019 AAPC (%) 95% CI Years APC (%) Years APC (%) Years APC (%) LE-60 China 17.32 21.29 0.75* (0.65, 0.85) 1990–1998 0.91* 1998–2003 0.15 2003–2019 0.86* East Asia & Pacific-WB 18.13 21.82 0.67* (0.60, 0.74) 1990–1998 0.80* 1998–2003 0.33 2003–2019 0.72* Europe & Central Asia-WB 19.44 22.46 0.50* (0.40, 0.59) 1990–1995 −0.35 1995–2014 0.76* 2014–2019 0.32 Latin America & Caribbean-WB 19.72 22.39 0.44* (0.42, 0.47) 1990–2007 0.58* 2007–2019 0.24* – – Middle East & North Africa-WB 17.73 19.86 0.38* (0.34, 0.42) 1990–1994 0.27* 1994–2011 0.49* 2011–2019 0.21* North America 21.23 23.65 0.38* (0.35, 0.42) 1990–2000 0.27* 2000–2011 0.74* 2011–2019 0.04 South Asia-WB 15.31 19.05 0.81* (0.73, 0.89) 1990–1998 0.60* 1998–2019 0.89* – – Sub-Saharan Africa-WB 15.59 17.67 0.42* (0.37, 0.48) 1990–1998 −0.23* 1998–2001 0.28 2001–2019 0.74* HALE-60 China 13.36 16.26 0.71* (0.62, 0.80) 1990–1998 0.90* 1998–2003 0.07 2003–2019 0.82* East Asia & Pacific-WB 13.91 16.62 0.65* (0.56, 0.73) 1990–1998 0.78* 1998–2002 0.22 2002–2019 0.69* Europe & Central Asia-WB 14.76 17.01 0.49* (0.39, 0.59) 1990–1995 −0.31 1995–2014 0.75* 2014–2019 0.29 Latin America & Caribbean-WB 14.97 16.96 0.43* (0.40, 0.45) 1990–2007 0.58* 2007–2019 0.22* – – Middle East & North Africa-WB 13.57 15.01 0.35* (0.26, 0.44) 1990–2012 0.42* 2012–2015 −0.25 2015–2019 0.43* North America 15.27 16.53 0.27* (0.22, 0.32) 1990–2001 0.31* 2001–2012 0.49* 2012–2019 –0.15* South Asia-WB 11.15 13.79 0.74* (0.61, 0.87) 1990–1998 0.55* 1998–2016 0.91* 2016–2019 0.22 Sub-Saharan Africa-WB 11.90 13.51 0.43* (0.40, 0.47) 1990–2000 -0.18* 2000–2012 0.81* 2012–2019 0.66* PYIH-60 China 0.23 0.24 0.10* (0.02, 0.17) 1990–1994 −0.41* 1994–1999 0.36* 1999–2019 0.13* East Asia & Pacific-WB 0.23 0.24 0.10* (0.00, 0.20) 1990–2007 0.10* 2007–2010 −0.27 2010–2019 0.22* Europe & Central Asia-WB 0.24 0.24 0.03* (0.01, 0.04) 1990–1994 −0.19* 1994–2015 0.05* 2015–2019 0.12* Latin America & Caribbean-WB 0.24 0.24 0.02 (−0.02, 0.07) 1990–1994 −0.23 1994–2019 0.06* – – Middle East & North Africa-WB 0.23 0.24 0.19* (0.11, 0.28) 1990–1998 −0.04 1998–2019 0.28* – – North America 0.28 0.30 0.23* (0.18, 0.28) 1990–1995 −0.74* 1995–2010 0.49* 2010–2019 0.32* South Asia-WB 0.27 0.28 0.03 (−0.06, 0.11) 1990–2007 0.02 2007–2010 0.31 2010–2019 −0.06 Sub-Saharan Africa-WB 0.24 0.24 −0.06* (−0.09, –0.03) 1990–2019 −0.06* – – – – Abbreviation: WB=world bank; LE-60=life expectancy at age 60; HALE-60=health-adjusted life expectancy at age 60; PYIH-60=proportion of years in ill health at age 60; CI=confidence interval; APC=annual percentage change; AAPC=average annual percentage change.
* Significant difference from zero (P<0.05).Table 1. Joinpoint analysis of LE, HALE, and PYIH in individuals 60 years of age worldwide.
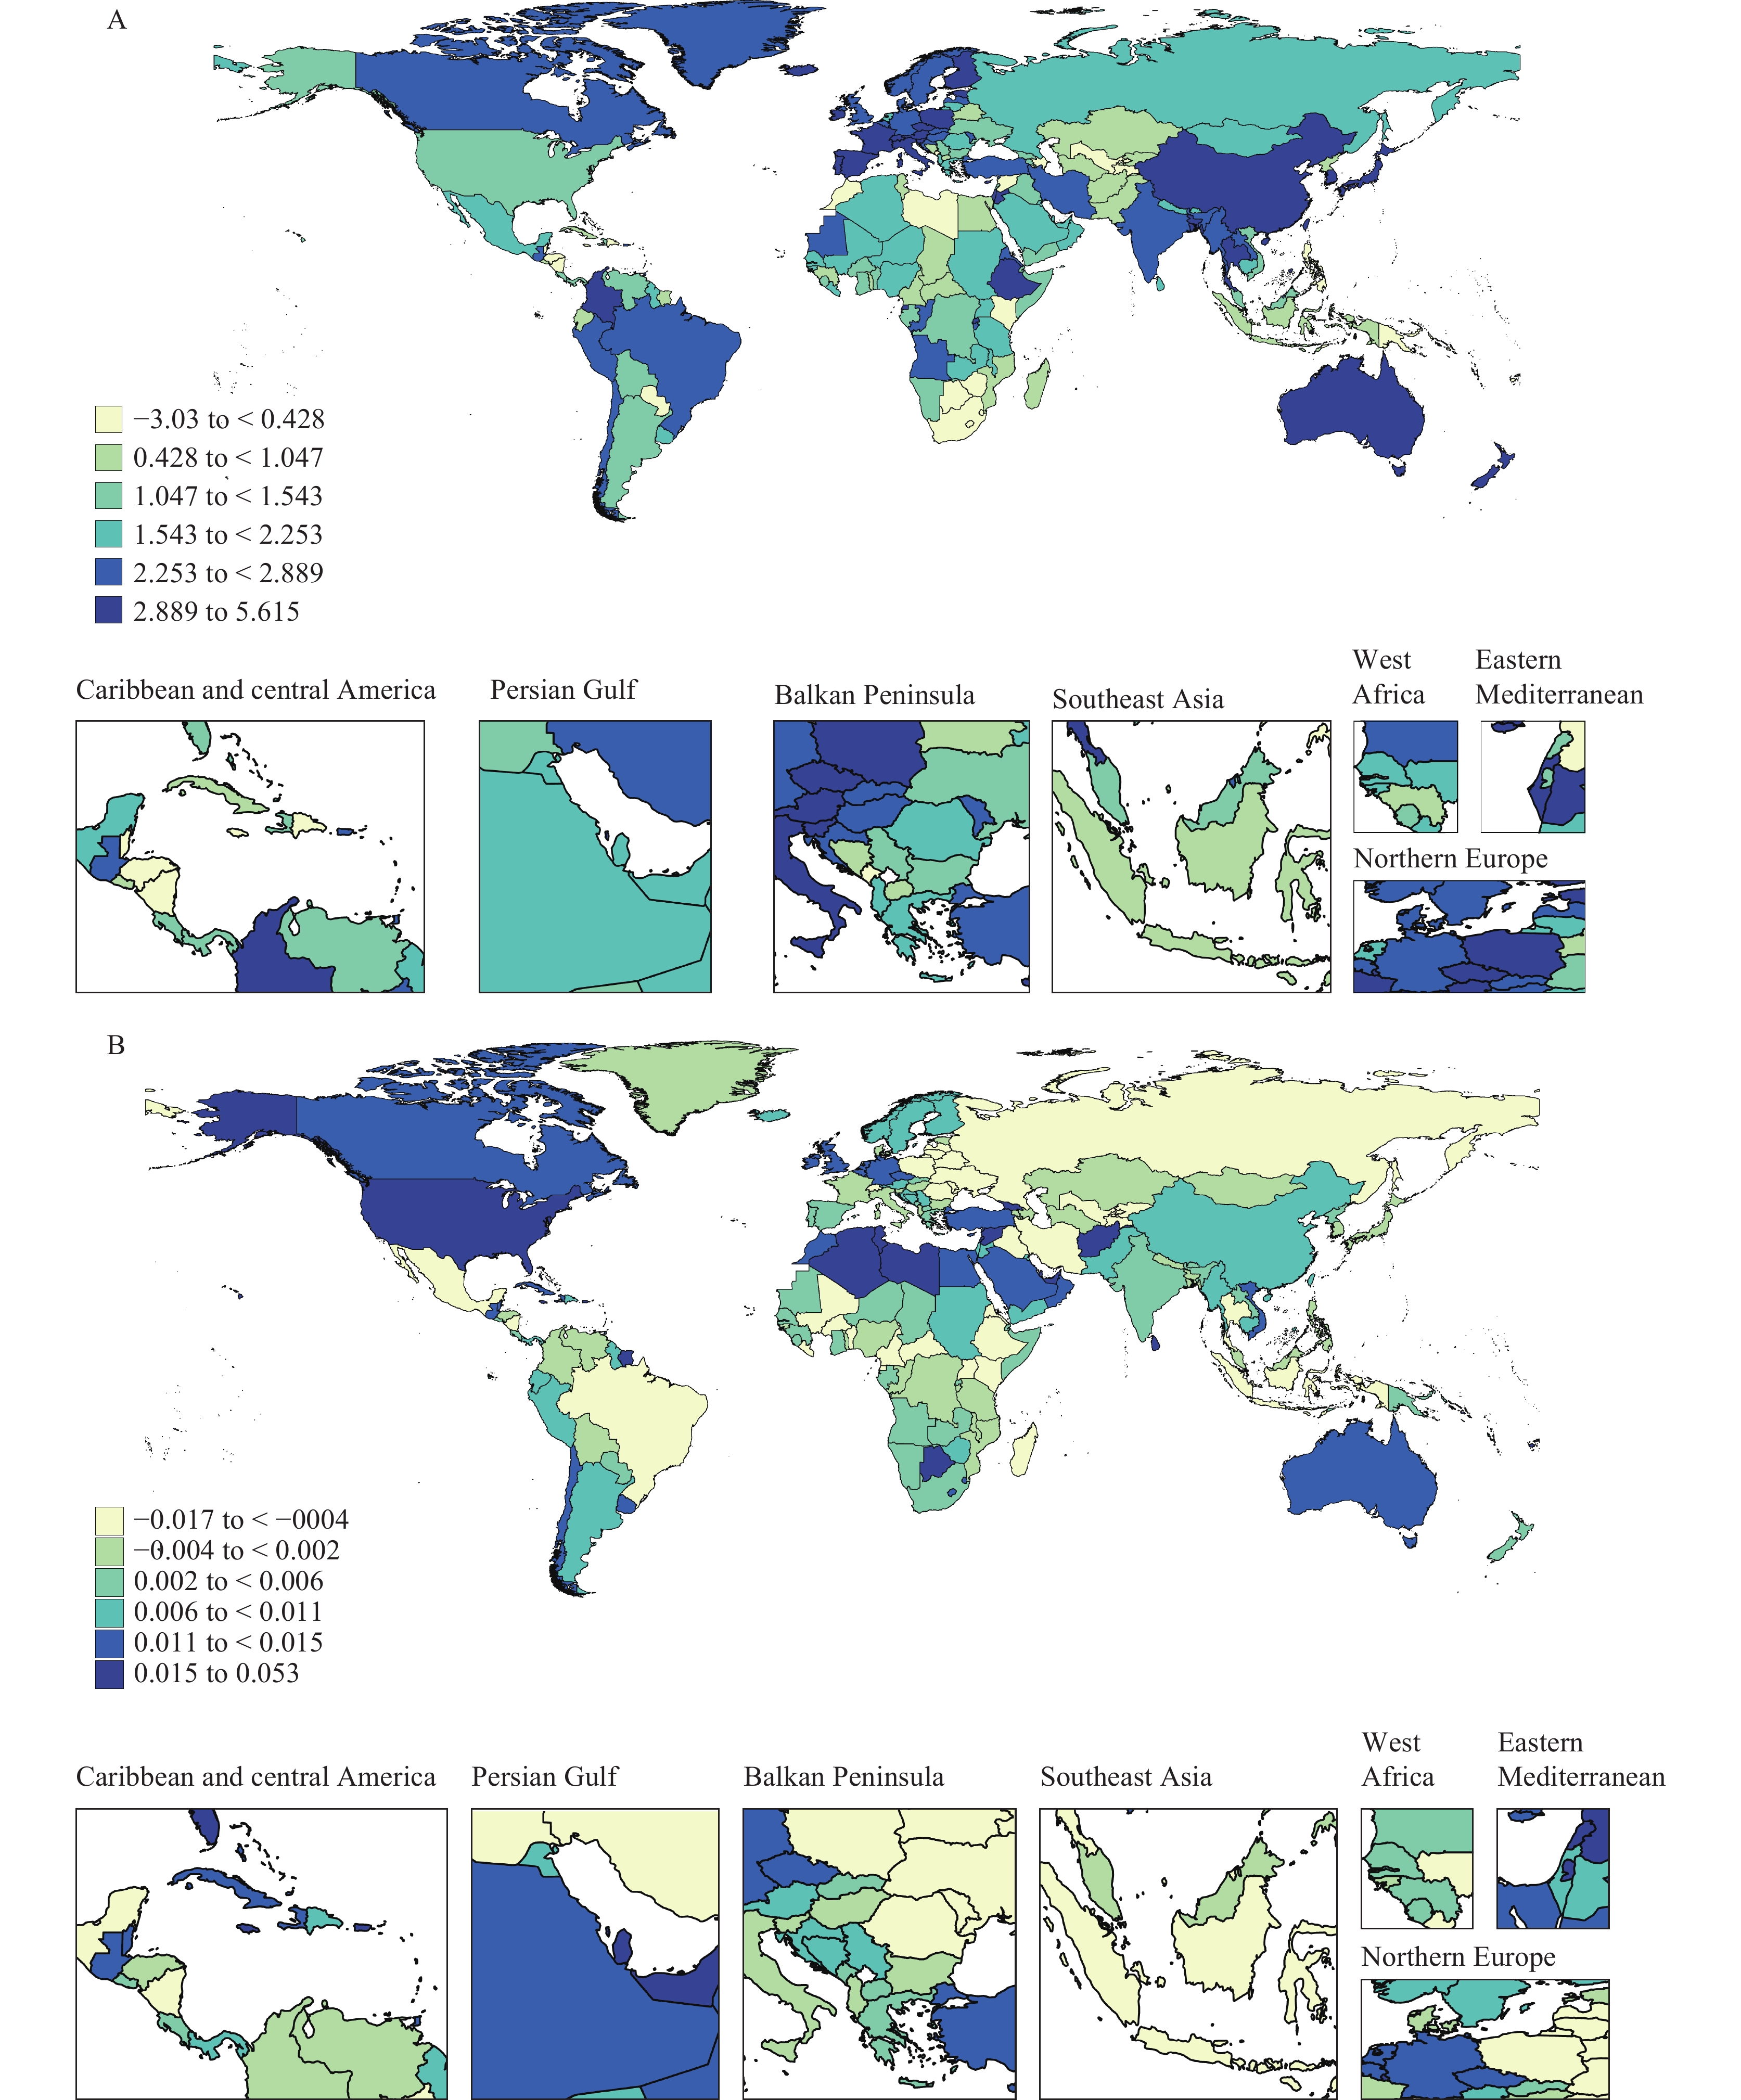 Figure 1.
Global changes in HALE-60 (A), and PYIH-60 (B) among individuals aged 60 years and above from 1990 to 2019.
Abbreviation: HALE-60=healthy life expectancy at age 60; PYIH-60=proportion of years in Ill health at age 60.Excluding sub-Saharan Africa, all regions have experienced an increase in the proportion of life expectancy spent in ill health relative to total lifespan (Figure 1B). The most significant annual increases were observed in the Middle East & North Africa and North America, with both registering an annual growth rate of 0.19%. North America notably experienced the most rapid increase between 1995–2010, peaking at 0.49%. The East Asia & Pacific region also demonstrated an annual growth of 0.10%. On the other hand, regions such as Latin America & Caribbean and South Asia demonstrated consistent levels throughout the study period (Table 1).
China has made substantial strides in enhancing both life expectancy and healthy life expectancy, showcasing an annual growth rate of 0.75% and 0.71% respectively, positioning the country as a global pioneer in this regard. Notably, from 1990 to 1998, growth rates in these measures for the elderly population peaked at 0.91%, marking the highest globally. Parallel to this, the Potential Years of Life Lost (PYLL) of older Chinese citizens showed a consistent upward trend from 1990 to 2019, registering an annual growth rate of 0.10%. Despite a transitory dip in PYLL among those aged 60 and above, observed between 1990 and 1994, a steady rise recommenced after 1994 (Table 1).
In an attempt to provide a comprehensive overview, our study also examined the historical correlation between HALE-60 and PYIH-60, and four key socio-demographic and health system factors. A noticeable increase in HALE-60 was associated with rises in the SDI {rs=0.73 [95% confidence interval (CI): 0.67, 0.79]}, P<0.001, Figure 2A–B]. The UHC effective coverage index varied between 34.08 (Vanuatu) to 96.34 (Japan), and a noticeable increase in HALE-60 corresponded with an increase in the UHC effective coverage index [rs=0.87 (95% CI: 0.83, 0.91), P<0.001, Figure 2C–D]. A simultaneous surge in both HALE-60 and PYIH-60 was observable in correspondence with an increase in the allocation of health human resources per 10,000 inhabitants (Figure 2E–F). With HAQ serving as a key determinant, a rise in HAQ was associated with an increased trend in both HALE-60 and PYIH-60 (Figure 2G–H). Furthermore, our empirical evidence highlighted the significant positive effect of per capita healthcare expenditure on anticipated HALE and PYIH for elderly individuals. A distinct rise in HALE-60 was linked to ln (Total Spending per Capita) in 2019 [rs=0.79 (95% CI: 0.74, 0.85), P<0.001, Figure 3].
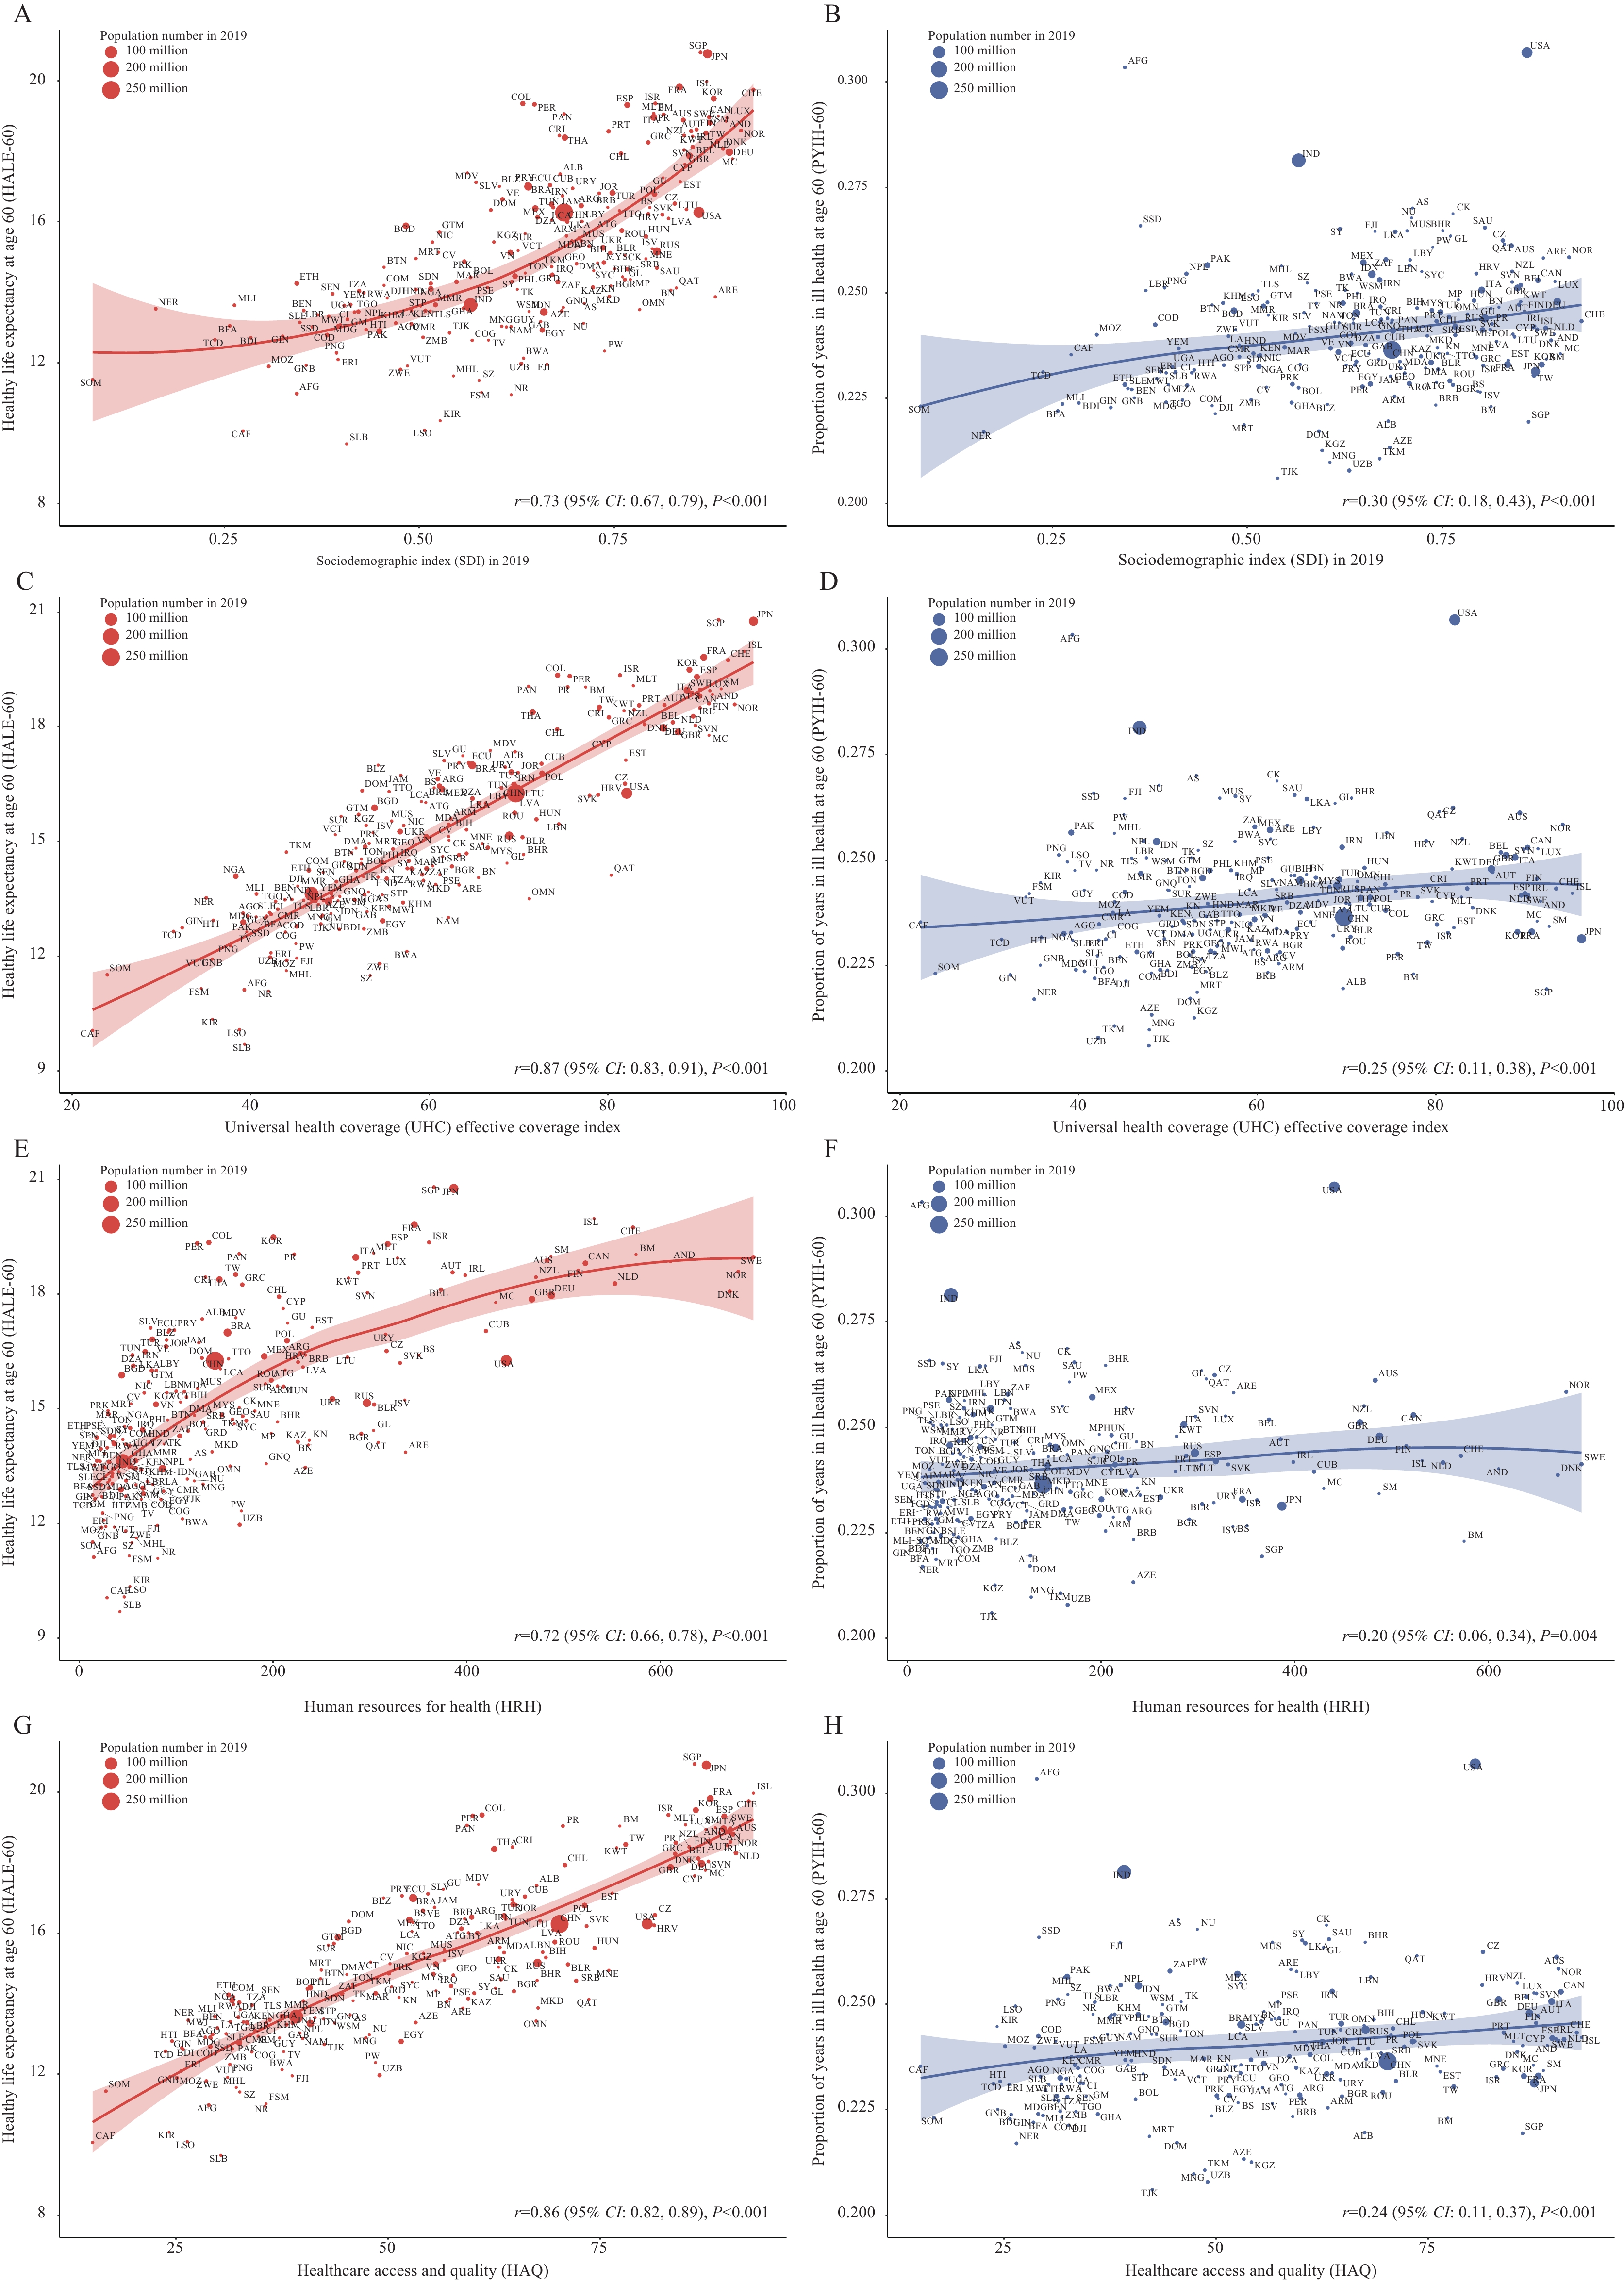 Figure 2.
Relationships between HALE-60 and PYIH-60 with SDI (A–B), UHC effective coverage index (C–D), HRH index (E–F), HAQ index (G–H) among individuals aged 60 years in 2019.
Abbreviation: SDI=socio-demographic Index; UHC=universal health coverage; HRH=human resource for health; HAQ=healthcare access and quality; HALE-60=healthy life expectancy at age 60; PYIH-60=proportion of years in Ill health at age 60; CI=confidence interval.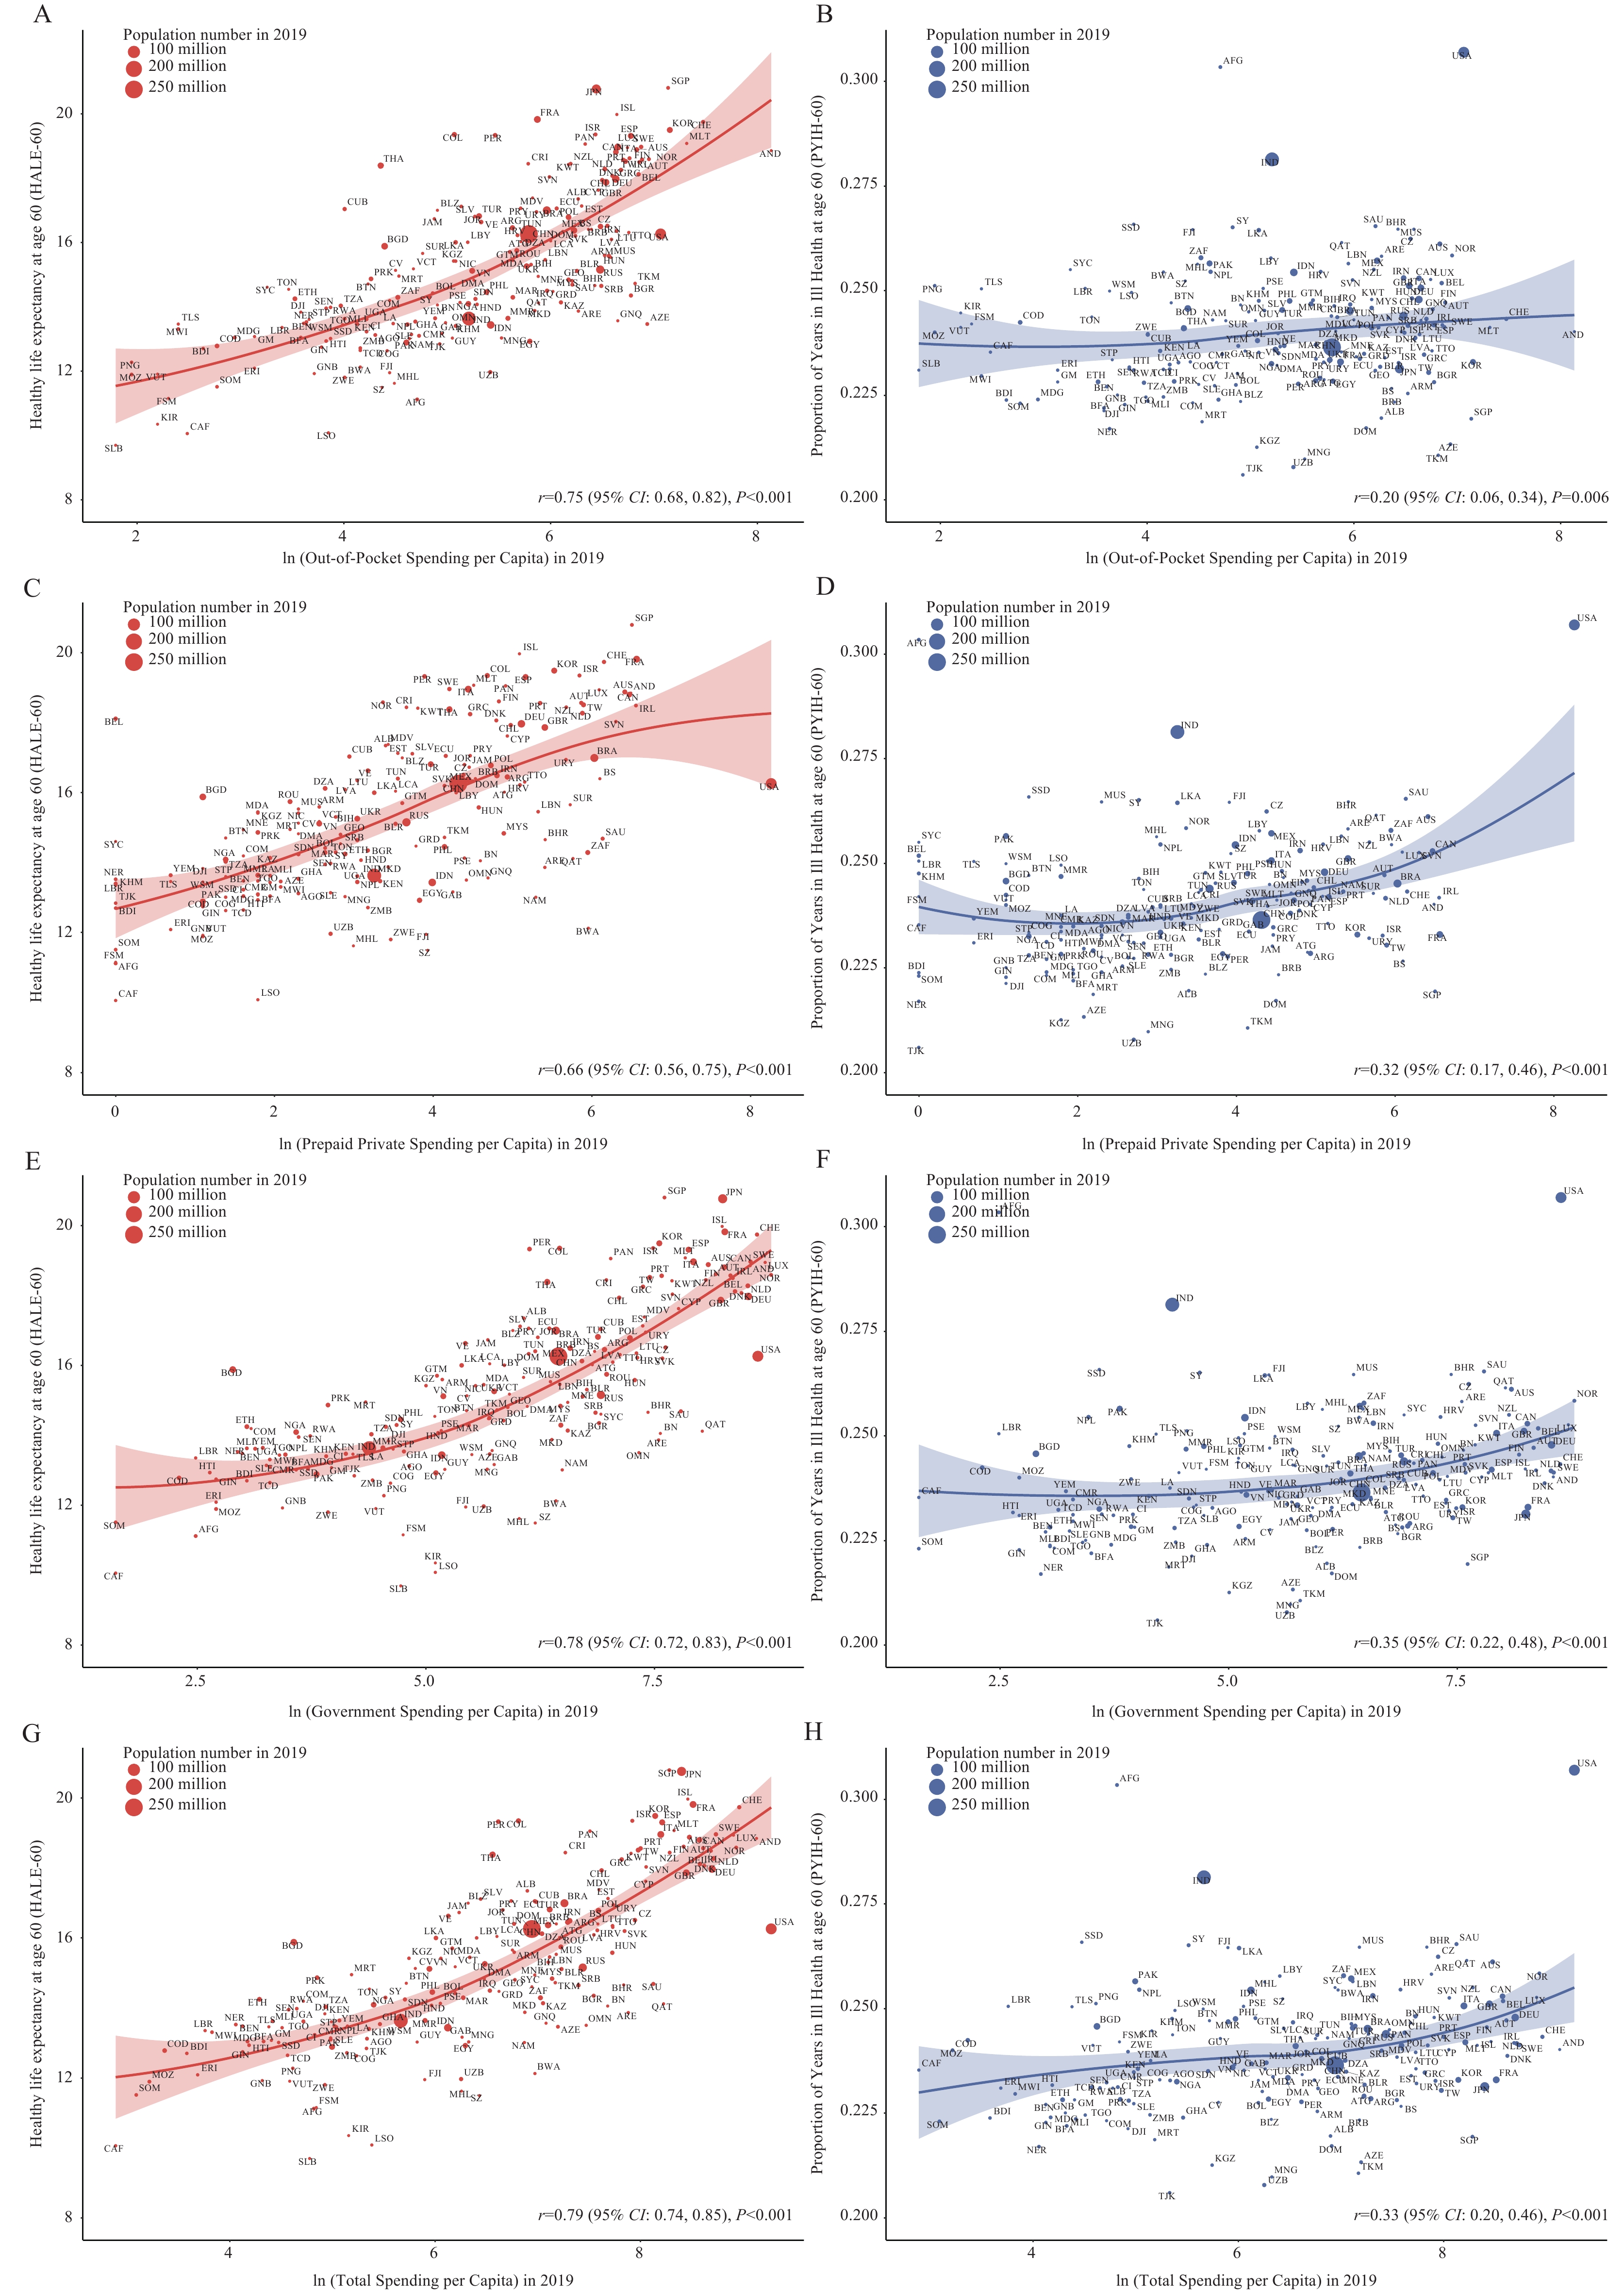 Figure 3.
Associations between HALE-60/PYIH-60 and healthcare expenditure in 2019.
Abbreviation: HALE-60=healthy life expectancy at age 60; PYIH-60=proportion of years in Ill health at age 60. -
The divergence of life expectancies in older adults into “healthy” and “unhealthy” durations has offered new perspectives on the health dynamics of the aging global population. Our analysis reveals that the growth in overall life expectancy does not always correlate with a proportional increase in years lived in good health, a phenomenon that requires further investigation.
The study yields several critical observations. First, the disparity between global life expectancy, which has been on a steady rise, and HALE, suggests a prolonged period of morbidity or disability for older adults (5). This emphasizes the need for health systems to shift focus from extending life to prioritizing quality of the extended years. Unlike unhealthy life expectancy, augmenting the health life expectancy of a population results in higher per capita output levels and improved labor productivity. This also allows for the reduction of social and medical security costs for older adults. Future research assessing the impact of specific healthcare interventions on healthy life expectancy in aging populations is of substantial interest.
Attention must also be paid to regional variations. The swift increase in life expectancy in regions like South Asia and East Asia may be attributed to economic growth (6), enhancements in healthcare infrastructure (7), and successful public health interventions. Yet, the concurrent enlargement of unhealthy life expectancy in certain regions underlines the urgency for interventions targeted at addressing health challenges unique to specific regions. The significant increase in China’s life expectancy warrants special attention. This progress may be attributed to the country’s strategic health reforms, economic growth, and public health initiatives (8). However, the rise in PYIH-60 among older adults in China indicates an area of concern, suggesting potential areas for targeted healthcare interventions and policy implementation.
The correlation between HALE-60 and various sociodemographic and health system indicators illuminates the interaction between social determinants and health outcomes (9). The observed positive relationship, showing that an increase in SDI, UHC coverage, HAQ, and healthcare expenditure leads to an improvement in HALE-60, suggests that comprehensive socio-economic development paired with accessible, high-quality healthcare yields measurable benefits for the aging population.
Nonetheless, the study was subject to several limitations. Sole reliance on GBD 2019 data may miss subtle variances found in localized or regional databases. Furthermore, the study does not explore the precise causes for the increase in unhealthy life expectancy, an understanding of which could better inform intervention strategies. Lastly, the availability and quality of raw data from the GBD differ significantly across various countries.
In conclusion, the findings of our research highlight the necessity to consider both healthy and unhealthy life expectancies for a comprehensive comprehension of health trends within the aging global population. Such an understanding becomes essential for policymakers and public health practitioners to devise strategies that prioritize not only longevity, but also quality of life. As global demographics trend towards older age profiles, these insights may serve as the groundwork for transformative health policies and interventions, thus ensuring both increased longevity and vitality.
-
The authors claim that there are no potential competing financial interests or personal relationships that could affect the work reported in this paper.
HTML
| Citation: |

|