

 Download:


-
Scarlet fever is an acute respiratory disease caused by Streptococcus pyogenes (Group A Streptococcus, GAS) infection (1), and is classified as a Class B infectious disease in China. The principal sources of infection are individuals afflicted with scarlet fever and GAS carriers. The disease is primarily characterized by fever, sore throat, diffuse rash, and a “strawberry tongue”. Transmission primarily occurs through respiratory droplets (2), but can also result from direct contact with an infected person’s skin or bodily fluids (3). Though it is possible for people of any age to contract GAS, it predominantly affects children under the age of 10 (4). Once considered a fatal disease for children in the 19th century, both morbidity and mortality of scarlet fever drastically decreased worldwide with the widespread use of antimicrobial drugs. In the early 21st century, China’s average annual incidence rate of scarlet fever was relatively low, at 1.46 per 100,000 individuals. Nonetheless, this rate has been on the rise since 2011, surpassing 4.00 per 100,000 individuals annually (5–6). Increased rates of scarlet fever have also been reported concurrently in England, the Republic of Korea, and other countries (7–8). The current literature on scarlet fever in China mostly focuses on specific provinces rather than on the country as a whole. This study utilized data from reported cases of scarlet fever amongst children aged 0–9 years in China from 2010 to 2019, applying trajectory model analysis to probe the disease’s incidence patterns and attributes by age, gender, urban-rural location, and region over this period. The objective was to discern the long-term trend of scarlet fever incidence in China and offer insights to inform modifications to the country’s prevention and control strategies for the disease.
-
This study focuses on scarlet fever, a condition primarily impacting children under ten years of age. Data were collected on reported instances of this disease within this demographic, from January 1, 2010 to December 31, 2019, spanning all 31 provincial-level administrative divisions (PLADs) in China. Case information was sourced from the National Notifiable Disease Reporting System (NNDRS), a division of the Chinese Center for Disease Control and Prevention. Each case was classified into one of numerous subgroups, established through various combinations of categories such as gender (i.e., male or female), region (divided into North, Northeast, East, Central, South, Southwest, or Northwest China) (Table 1), type of area (i.e., urban or rural), and age groupings (i.e., 0–1, 2–3, 4–5, 6–7, 8–9 years). This categorization resulted in 70 distinct groups for each, male and female.
Region North China Northeast China East China Central China South China Southwest China Northwest China PLADs Beijing Liaoning Shanghai Henan Guangdong Chongqing Shaanxi Tianjin Jilin Jiangsu Hubei Guangxi Sichuan Gansu Hebei Heilongjiang Zhejiang Hunan Hainan Guizhou Qinghai Shanxi – Anhui – – Yunnan Ningxia Inner Mongolia – Fujian – – Tibet Xinjiang – – Jiangxi – – – – – – Shandong – – – – Note: −, not applicable.
Abbreviation: PLADs=provincial-level administrative divisions.Table 1. PLADs included in each region of China.
-
The latent class growth model (LCGM), also known as the trajectory model, is a semi-parametric statistical modeling technique. This model seeks to classify subgroups within an analysis based on distinctive developmental trajectory trends. It determines the quantity and configuration of the trajectories, describing and fitting each developmental trajectory set. The trajectory model is tailored according to different data distributions. This study examined data pertaining to the incidence of scarlet fever, which presents as continuous data within a designated range. Consequently, a censored normal distribution model was employed to fit the trajectory of annual changes in the incidence of scarlet fever. In this censored normal distribution model, the latent variable
$ {y}_{it}^{*} $ is utilized to represent the predicted value of the dependent variable Y, as illustrated below:$$ {(y}_{it}^{*})={\beta }_{0}^{\;j}+{\beta }_{1}^{\;j}{X}_{it}+{\beta }_{2}^{\;j}{X}_{it}^{\;2}+{\beta }_{3}^{\;j}{X}_{it}^{\;3}+{\varepsilon }_{it} $$ Here,
$ {X}_{it} $ ,${X}_{it}^{\;2}$ , and${X}_{it}^{\;3}$ represent the independent variables of the primary, secondary, and tertiary terms. The${\varepsilon }_{it}$ represents the residuals assuming a normal distribution. The${\beta }_{0}^{\;j}$ represents the intercept. The${\beta }_{1}^{\;j}$ ,${\beta }_{2}^{\;j}$ , and${\beta }_{3}^{\;j}$ represent the slopes. Three metrics were used to evaluate the effectiveness of the trajectory model 1) Bayesian Information Criterion (BIC), in which lower absolute values indicate a better fit. 2) Log Bayes Factor: approximately equal to two times the difference in the BIC values for the two models being compared. Values greater than 6 indicate that a more complex model is acceptable. 3) Average Posterior Probability (AvePP), in which group averages of >0.7, the fitting effect is better (9).In this study, the Proc traj procedure was employed using the SAS software (version 9.4, SAS Institute Inc., Cary, USA). The independent variable identified was the year, and the dependent variable was the incidence rate for each subgroup. We applied a censored normal distribution model to accurately fit the incidence rate trajectory for each respective subgroup.
-
From 2010 to 2019, a total of 554,695 cases of scarlet fever were reported in children aged 0–9 years across all 31 PLADs in China. This figure results in an average annual incidence rate of 35.36 per 100,000 individuals. Despite variations, all PLADs reported instances of the disease. The year 2010 recorded the lowest incidence rate with 18,751 cases, translating to a rate of 12.09 per 100,000. However, there was a significant increase in 2011 to 59,793 cases, escalating the incidence rate to 41.57 per 100,000. Subsequently, the incidence rates of scarlet fever presented an irregular yet increasing trend, recurring approximately every 3–4 years, with a peak in 2019 reporting 78,242 cases and an incidence rate of 48.56 per 100,000. Over this decade, the number of reported scarlet fever cases among children in China multiplied by 3.17 times, with the incidence rate intensifying by 3.02 times (Figure 1).
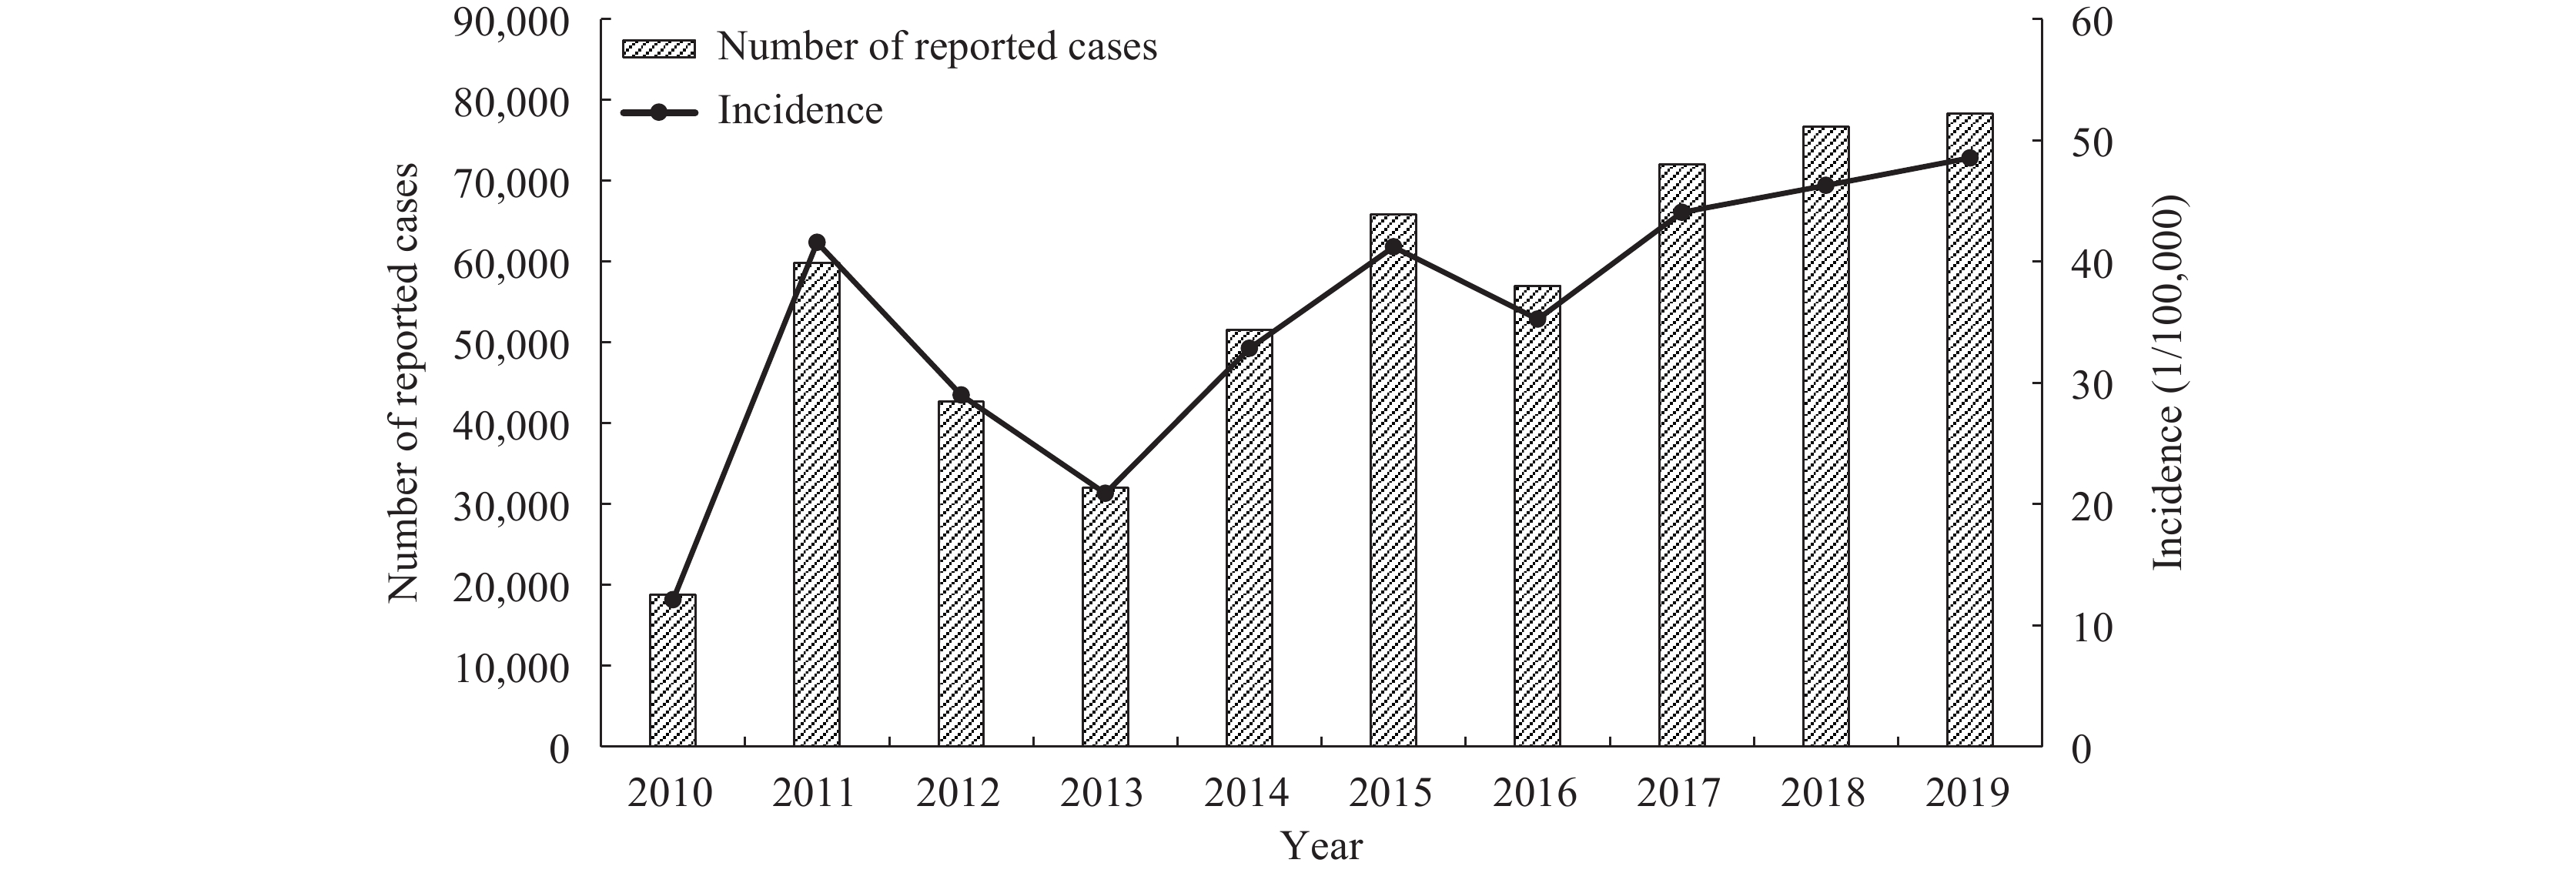 Figure 1.
Reported cases and incidence rate of scarlet fever in children aged 0–9 years in China, 2010–2019.
-
Line graphs were utilized to separately chart the trajectories of scarlet fever incidence rates over time for specific subpopulations (7/70) of boys and girls in China. Analysis revealed obvious heterogeneity in the incidence rate trends across the years for different regions, contrasting urban and rural areas, and between age groups for boys and girls. This justified employing the trajectory model to discern distinct patterns of scarlet fever incidence over time. Notably, incidence rates for girls were considerably lower than for boys; consequently, the trajectories for male and female children were modeled distinctly to more effectively investigate the epidemiological trends of scarlet fever in Chinese children aged 0–9 years (Figure 2).
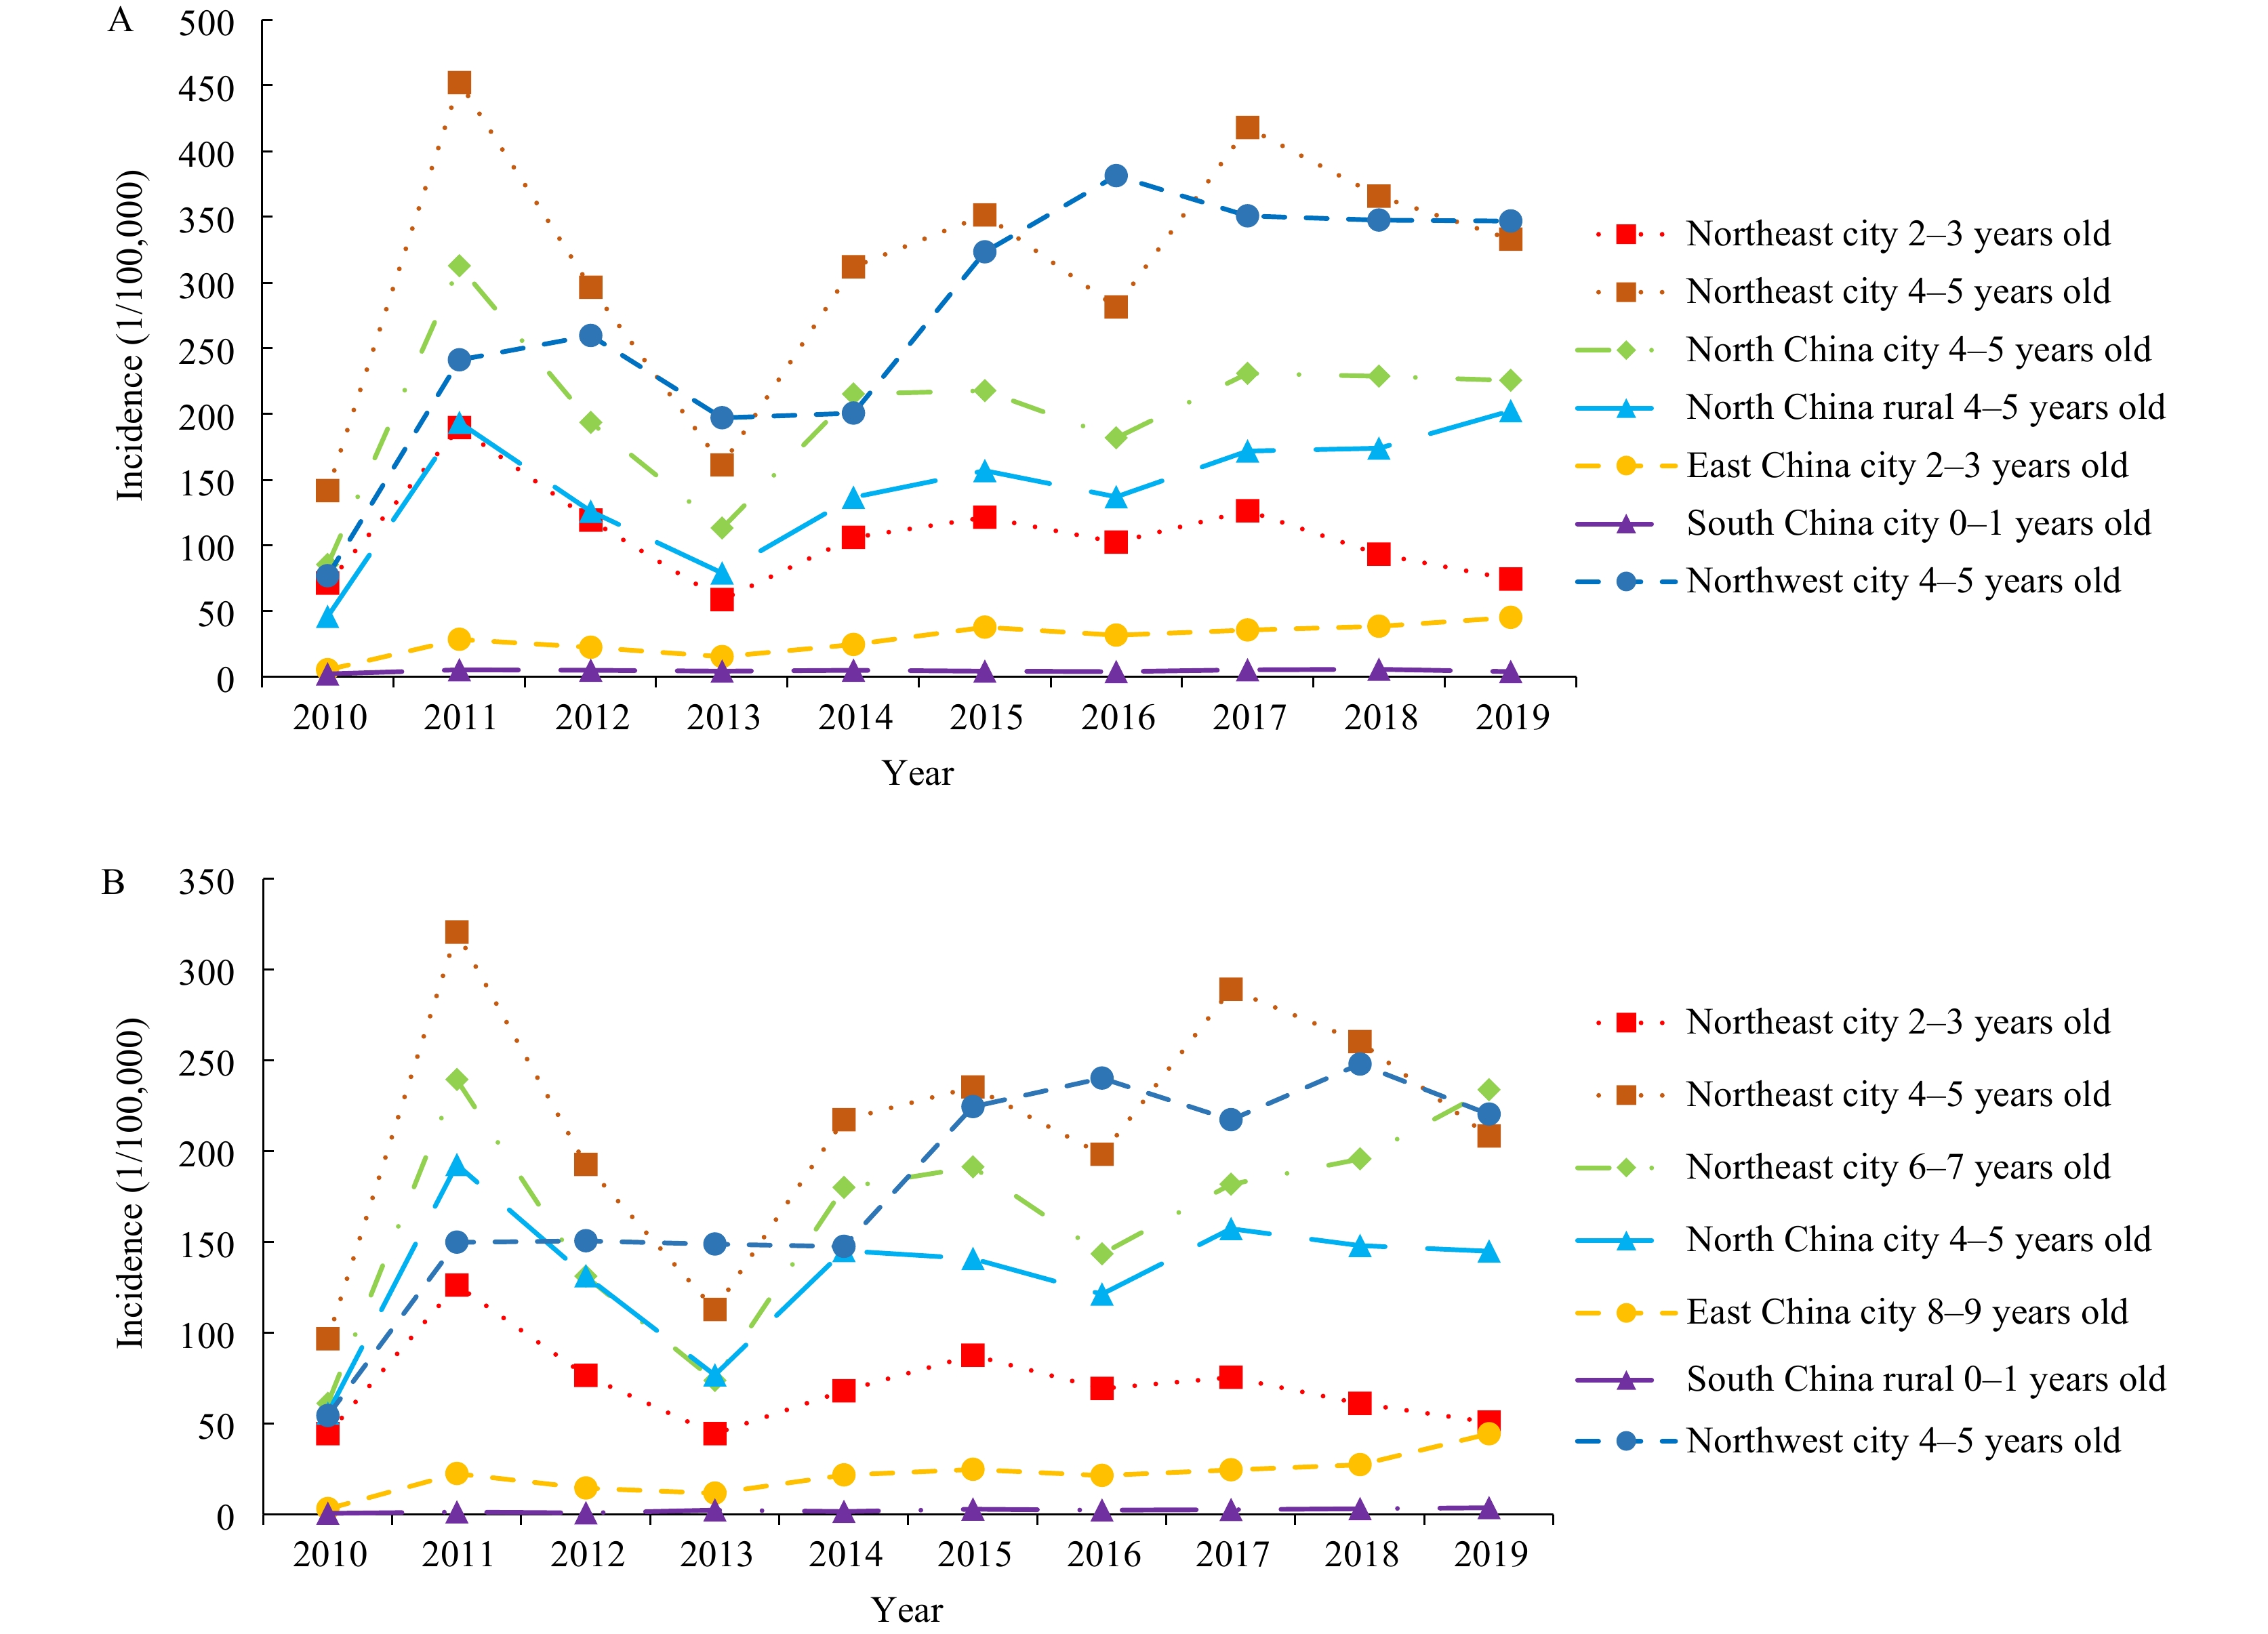 Figure 2.
Trends in scarlet fever incidence among boys and girls aged 0–9 years in China from 2010 to 2019. (A) Incidence rate patterns for boys. (B) Incidence rate patterns for girls.
-
The model achieved optimal performance for both sexes when implemented with three developmental trajectories. These trajectories respectively conformed to the 1st, 5th, and 5th order development trends. The first trajectory evidenced the least incidence rate, showing a slight positive linear progression. The second and third trajectories demonstrated an “up-down-up-down-up” curve, indicative of an overall oscillating upward trend. Nevertheless, the third trajectory was associated with the highest incidence rate and the most pronounced overall increase (Table 2).
Trajectory Boys Girls Intercept Parameter estimation P-value AvePP Intercept Parameter estimation P-value AvePP 1 2 3 4 5 1 2 3 4 5 1 18.02 1.78 − − − − <0.01 ≥0.85 12.00 1.62 − − − − <0.01 ≥0.84 2 37.68 484.13 −227.75 46.65 −4.3 0.15 <0.01 ≥0.82 26.25 326.87 −153.35 31.48 −2.92 0.10 <0.01 ≥0.93 3 96.52 1243.22 −581.39 118.53 −10.89 0.37 <0.01 ≥0.99 65.11 769.04 −354.63 71.68 −6.54 0.22 <0.01 ≥0.99 Note: −, not applicable.
Abbreviation: AvePP=average posterior probability.Table 2. Estimated parameters for fitting three trajectory groups for boys and girls.
The boys’ trajectory model interpretation divulges that trajectory group 3 is solely composed of urban residents aged 4–7 years from Northeastern, Northern, and Northwestern China, alongside rural populations aged 4–5 years from Northeastern China. Compared to other groups, this assemblage demonstrated a notable surge in incidence rates, frequent variations, and a significant aggregate escalation. Conversely, in Eastern, Southern, Central, and Southwestern China, the trajectory of the incidence rate within each subgroup demonstrated relative uniformity, primarily aligning within trajectory group 1. This category exhibited a less pronounced incidence rate, minimal fluctuations, and a more stable overall progression.
Our examination of the various groups revealed that the incidence rate trajectories of all urban subgroups were either higher or equal to their rural counterparts. Similarly, the incidence rate trajectories of subgroups in northern areas matched or exceeded those in central and southern regions. As for age, the incidence rate trajectory for the group aged 0–1 year was the lowest amongst all groups in each region. However, as age increased, the incidence rate trajectory also increased, revealing the highest rates in the 4–5 and 6–7-year age groups (Figure 3).
 Figure 3.
Depiction of fitted trajectory results for the incidence of scarlet fever in male children aged 0–9 years in China, 2010–2019. (A) Trend of trajectories for each group. (B) Subgroups represented within each group’s trajectories.
The evaluation of fit results from the trajectory model for girls indicated that the variations in developmental trends across each trajectory group and its constituent subgroups closely mirrored those observed in boys (Figure 4). However, both the incidence rates for each trajectory group and the increments in these rates were relatively lower than those found in boys, suggesting a higher incidence rate among the male cohort.
 Figure 4.
Illustrated fitted trajectory results for the incidence of scarlet fever among female children aged 0–9 years in China, 2010–2019. (A) Demonstration of the trend in trajectories for each group. (B) Identification of the subgroups incorporated in each group’s trajectories.
-
The incidence rate of scarlet fever among children from 0–9 years old in China displayed a volatile upward trend from 2010 to 2019, with a peak every 3–4 years. This pattern mirrored the incidence level in China from 1980–1994 and was significantly higher than the rate from 1995–2009 (10). Multiple factors may contribute to the escalating incidence of scarlet fever in China. First, the prevalent GAS genotypes in recent years in China predominantly were emm1 and emm12, diverging from the genotypes prevalent in the 1990s (11). Simultaneously, pathogenic surveillance of GAS in various provinces across China indicates that the proportions of each scarlet fever subtype are in constant flux (12–13), hindering the development of a formidable herd immunity. Secondly, at the dawn of the 21st century, scarlet fever sustained a low incidence rate for an extended time in China, leading to a relatively weak herd immunity and a considerable build-up of susceptible individuals (14). This condition facilitates the dissemination of scarlet fever among the populace, subsequently enhancing the risk of infection.
The trajectory model analysis revealed disparities in the incidence of scarlet fever in China, based on gender and age of the population. The incidence was found to be higher in boys across all three developmental trajectories, supporting previous research (15). This could potentially be attributed to boys being more active, displaying less hygiene practice, and consequently being more exposed to pathogens, thus resulting in a higher incidence rate. The mean annual incidence of scarlet fever among children aged 0–9 years in China was demonstrably higher, specifically 35.36 per 100,000, significantly surpassing the rate observed in the general population (5). Additionally, the most substantial increase in incidence was observed among children aged 4–5 and 6–7 years — an element that significantly influenced the shift in the overall incidence of scarlet fever in China. This trend may be attributed to children and adolescents’ underdeveloped immune systems, lower immunity levels, and increased time spent in enclosed, pathogen-prone spaces like schools. Furthermore, a lack of personal hygiene awareness and high concentration of children in school settings possibly contribute to the heightened risk of contracting scarlet fever.
The findings from our analysis revealed that urban locales within China demonstrated a more substantial incidence rate of scarlet fever compared to their rural counterparts, reinforcing the conclusions from previous studies conducted in this nation (16). A significant correlation between population density and the prevalence of scarlet fever was also unveiled in this study (17). The accelerating economic progression occurring in urban spaces, along with the increase in the influx of transient population, could be associated with an elevated concentration of individuals susceptible to this disease within these regions. Contributing factors such as a denser presence of educational institutions and larger class populations synergistically amplify the propagation of scarlet fever, consequently causing an escalation in its incidence within urban environments.
The analysis revealed a notably higher incidence of scarlet fever in northern China compared to the southern and central regions — a finding supported by previous studies (18). Recent years have seen a significant rise in scarlet fever rates in the north, while its increase has been more gradual in both the central and southern areas. The elevated prevalence of this disease in the northern region has largely contributed to the rise in national incidence. Scarlet fever, an acute respiratory infection, is influenced by varying meteorological elements and atmospheric pollutants. Factors such as monthly average temperature, humidity, and rainfall have displayed an inverse correlation with the onset of scarlet fever (19–20), whereas atmospheric pollutant concentration showed a positive correlation (21–22). The humid climate and enhanced rainfall in the south promote bacterial adhesion to droplets, thereby lowering airborne pathogen concentration and potentially limiting scarlet fever transmission. Consequently, this results in a lower incidence rate. Conversely, the drier climate, reduced humidity, and severe air pollution found in high-altitude areas of northern China may exacerbate airborne pathogen concentration and thus increase the susceptibility of individuals to infection, accounting for the higher incidence rates in these regions.
This study is not without its limitations. The case data analyzed were drawn from the National Notifiable Disease Reporting System. Given that the reporting of scarlet fever is dependent on the quality of healthcare and diagnostic accuracy in each region, the potential for underdiagnosis and misdiagnosis cannot be discounted. However, the broad geographical coverage of the study and the extended duration of analysis lend considerable credibility to the findings.
Overall, the prevalence of scarlet fever in China has steadily increased in recent years. The rates are observed to be highest among urban populations, particularly those aged 4–7 years old in the Northeast, North, and Northwest China, as well as that in rural populations in the Northeast, particularly those aged 4–5 years old. It is crucial to enhance preventive and control measures targeting these high-prevalence populations and regions. Timely disinfection of densely populated areas, increased ventilation, and stringent maintenance of environmental hygiene are vital. Reinforcing scarlet fever surveillance and early warning systems will enable timely responses to potential outbreaks, limiting the spread of the disease, and thereby protecting public health.
HTML
Source of Data
Statistical Analysis


Patterns in scarlet fever incidence among children aged 0–9 years in China from 2010 to 2019.
Identification of heterogeneity in the incidence trends of scarlet fever among boys and girls by region, urban and rural areas, and age groups.
Modeling scarlet fever incidence trajectories across regions, urban/rural locations, and age groups
| Citation: |

|